


Linear Regression Divergence
Table of Contents
- Understanding the Linear Regression Divergence Filter
- Linear Regression Divergence Filter Settings
- Using the Linear Regression Divergence Filter
- FAQs
Understanding the Linear Regression Divergence Filter
Linear regression in trading is used to identify the main trend of a stock's price over a specific period. Divergence occurs when the price of a stock moves in the opposite direction of a technical indicator or, in this case, the slope of the linear regression line. Divergence can signal a weakening trend and possible reversal.
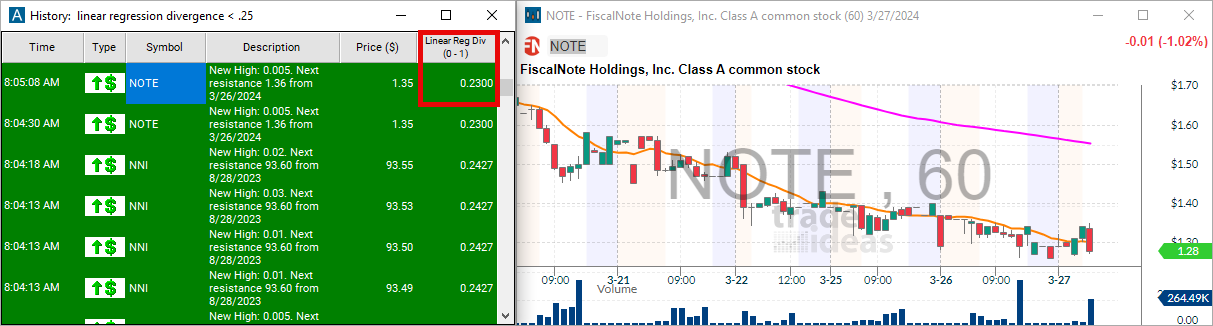
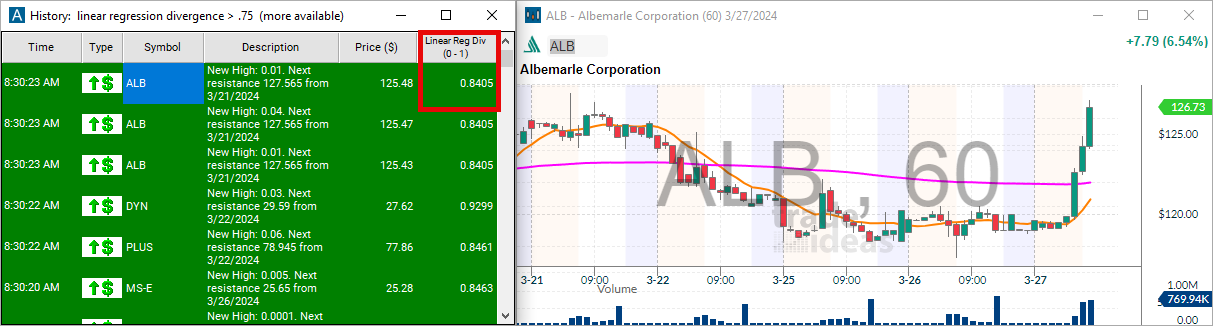
This filter tells you how well or poorly each stock’s price matches a straight line. 0 represents a stock moving up or down in a perfectly straight line. 1 represents a stock which does not move in a linear pattern at all. This filter describes a stock’s price over the previous 8 trading days. When the linear regression value falls below 0.25, it often indicates a clear trend direction—either upward or downward—over the recent 8-day period. However, when this value exceeds 0.75, the price movements become significantly more erratic and unpredictable during the same timeframe.
A stock with a low value is sometimes called a "bunny." This means that the stock has picked a direction and now keeps going and going.
This filter is what we call an overnight filter (updated during the overnight routine) and does not change during the day.
- Here is an example of a chart with a linear regression divergence value of < 0.25, indicating a strong trend line in the last 8 days:
- Conversely, this example shows a linear regression divergence value of > 0.75, indicating more eratic price movements in the last 8 days:
Linear Regression Divergence Filter Settings
The settings of each Trade Ideas filter are defined in the Window Specific Filters Tab located in the Configuration Window of your Alert/Top List Window.
Here is how to setup the filter in your configuration window:
- Set the max value to .25 to see only stocks with a strong trend line over the last 8 days.
Using the Linear Regression Divergence Filter
Several trading strategies can be employed with the Linear Regression Divergence filter. Here are a few examples:
Trend Following Strategy: When the Linear Regression Value is Below 0.25: This indicates a strong, clear trend. Traders could implement a trend-following strategy, entering trades in the direction of the trend. For example, if the trend is upward, consider taking long positions on dips; if the trend is downward, consider short selling on rallies.
Reversal Trading Strategy: Anticipating Reversals at Extreme Values: Although not directly mentioned, if a stock consistently shows a linear regression value close to 0 (indicating a very strong trend), it might become overextended. Traders could look for signs of exhaustion in such trends for potential reversal trades, especially if other indicators suggest an overbought or oversold condition.
Range Trading in Erratic Markets: When the Linear Regression Value Exceeds 0.75: Since the price movement is erratic and does not follow a clear linear pattern, traders might opt for a range trading strategy. This involves identifying support and resistance levels within the price fluctuations and trading within these bounds—buying near support levels with sell orders near resistance levels.
Breakout Trading Strategy: Monitoring Transition from High to Lower Values: A stock transitioning from a linear regression value above 0.75 to below 0.25 could indicate that a previously erratic price pattern is beginning to follow a more defined trend. Traders can use this signal to enter early on potential breakout trades, positioning in the direction of the emerging trend.
FAQs
What does a linear regression value close to 0 indicate?
- A linear regression value close to 0 indicates that the stock’s price movement over the previous 8 trading days has been in a very strong and clear trend, either upward or downward. This suggests high predictability and consistency in the trend direction.
How can I interpret a linear regression value above 0.75?
- A value above 0.75 signifies that the stock's price movement has been erratic and lacks a clear linear pattern over the last 8 days. This indicates high volatility and unpredictability, making trend-based strategies less reliable.
Is the linear regression filter effective in all market conditions?
- The linear regression filter is most effective in identifying and confirming trends in varying market conditions. However, its effectiveness can vary depending on market volatility, the presence of news or events affecting stock prices, and the inherent nature of the stock. It's recommended to use it alongside other analysis tools to validate trading signals.
Can the linear regression filter be used for both long and short positions?
- Yes, the linear regression filter can be used to identify potential entry points for both long and short positions. A value below 0.25 might indicate a potential entry for a trend-following trade, suitable for both buying (in an uptrend) or short-selling (in a downtrend). Conversely, high values suggest caution and potentially preparing for volatility strategies or avoiding trades.
Filter Info for Linear Regression Divergence [LR130]
- description = Linear Regression Divergence
- keywords =
- units = 0 - 1
- format = 4
- toplistable = 1
- parent_code =