
Light Mode

SMA crossovers and golden-cross style breaks on every stock, as they happen.
Fast and slow SMA crosses on 1 to 30-minute charts, plus 20, 50 and 200-day breaks, streaming live.
Free account, just an email. No card. Live access for a limited time.

Named to the Inc. 5000 list of America’s fastest-growing private companies six years in a row (2017–2022).

Investopedia: Best Short Term Stock Screener, 2024
Pick the pair and the chart. Trade Ideas watches every stock and streams the cross.
Streaming Alerts run in TI Pro, our desktop app for Windows (on a Mac, through Parallels).
Stocks where a faster moving average just crossed a slower one. A fast average above a slow one means recent prices are higher than older ones, so the short-term trend is up.
All the averages here are simple moving averages (SMA). Trade Ideas does not scan EMA crosses, so this page does not claim them.
| Alert or filter | What it does |
|---|---|
| 5 SMA Crossed Above 8 SMA (1 Min) (X5A8_1) | 5 period SMA crosses above the 8, 1 minute. Also 2, 4, 5, 10, 20, 30 minute. |
| 5 SMA Crossed Above 8 SMA (5 Min) (X5A8_5) | The same on 5 minute bars. |
| 5 SMA Crossed Below 8 SMA (5 Min) (X5B8_5) | 5 period SMA crosses below the 8, 5 minute. |
| 8 SMA Crossed Above 20 SMA (5 Min) (ECAY5) | 8 period SMA crosses above the 20, 5 minute. Also 2 and 15 minute. |
| 8 SMA Crossed Below 20 SMA (5 Min) (ECBY5) | 8 crosses below 20, 5 minute. |
| 20 SMA Crossed Above 200 SMA (5 Min) (YCAD5) | 20 period SMA crosses above the 200, 5 minute. Also 2 and 15. |
| 20 SMA Crossed Below 200 SMA (5 Min) (YCBD5) | 20 crosses below 200, 5 minute. |
| Crossed Above 20 Day Moving Average (CA20) | Price crosses above the 20-day moving average. |
| Crossed Above 50 Day Moving Average (CA50) | Price crosses above the 50-day. |
| Crossed Above 200 Day Moving Average (CA200) | Price crosses above the 200-day. |
| Crossed Below 200 Day Moving Average (CB200) | Price crosses below the 200-day. |
| 20 vs. 200 Period SMA (5 min) (5Sma20a200) | Filter: is the 20 SMA above the 200 on the 5 minute chart? |
| Change From 50 Day SMA (%) (MA50P) | Filter: distance from the 50-day SMA, in percent. |
| Change From 200 Day SMA (%) (MA200P) | Filter: distance from the 200-day SMA. |
The 20 over 200 on an intraday chart is a big turn for the day. 20 SMA Crossed Above 200 SMA (5 Min) (YCAD5) and 20 SMA Crossed Above 200 SMA (15 Min) (YCAD15) fire it as it happens. Add 20 vs. 200 Period SMA (5 min) (5Sma20a200) to other scans when you only want stocks already above it.
For trend, not just a cross, Trade Ideas has thrust alerts. Upward Thrust (5 Minute) (SMAU5) fires when the 8 and 20 period SMAs have been rising together, and Downward Thrust (5 Minute) (SMAD5) when both are falling. 15 Minute Linear Regression Up Trend (PEU15) marks a turn up in a linear regression line on 15 minute bars.
These say "this stock is trending," which many traders find more useful than a single cross.
The classic 50/200-day golden cross has its own page: golden cross scanner. It covers the Formula Editor formula and the 200-day break alerts.
A short average, like 5 or 8 periods, follows price closely. A long average, like 20 or 200, moves slowly. When the short one crosses above the long one, recent prices have pulled above older ones.
The shorter both averages are, the more they cross and the earlier each cross comes. Longer pairs cross less and mark bigger turns.
5 over 8. Very fast. Suits scalps on 1 to 5 minute charts.
8 over 20. A common day-trade pair on 5 and 15 minute charts.
20 over 200. A big intraday turn.
Price over 20, 50 or 200-day. Daily trend changes, useful for swing traders.
There is no 60 minute crossover alert. Traders who want hourly crosses use 15 or 30 minute alerts with a daily-trend filter, or the 60 minute MACD crosses on the MACD scanner.
Some traders wait for two crosses in a row: 5 SMA Crossed Above 8 SMA (5 Min) (X5A8_5) fires first, then 8 SMA Crossed Above 20 SMA (5 Min) (ECAY5). Others take the fast cross only when 20 vs. 200 Period SMA (5 min) (5Sma20a200) says the 20 is already above the 200, so they trade with the bigger trend.
Change From 20 Day SMA (%) (MA20P), Change From 50 Day SMA (%) (MA50P) and Change From 200 Day SMA (%) (MA200P) show how far price is from each daily average. They help avoid buying a cross in a stock already far above its averages.
| Cross | 2 min | 5 min | 15 min |
|---|---|---|---|
| 8 over 20, up | 8 SMA Crossed Above 20 SMA (2 Min) | 8 SMA Crossed Above 20 SMA (5 Min) | 8 SMA Crossed Above 20 SMA (15 Min) |
| 8 under 20, down | 8 SMA Crossed Below 20 SMA (2 Min) | 8 SMA Crossed Below 20 SMA (5 Min) | 8 SMA Crossed Below 20 SMA (15 Min) |
| 20 over 200, up | 20 SMA Crossed Above 200 SMA (2 Min) | 20 SMA Crossed Above 200 SMA (5 Min) | 20 SMA Crossed Above 200 SMA (15 Min) |
| 20 under 200, down | 20 SMA Crossed Below 200 SMA (2 Min) | 20 SMA Crossed Below 200 SMA (5 Min) | 20 SMA Crossed Below 200 SMA (15 Min) |
| Upward thrust: 8 and 20 both rising 5 bars | Upward Thrust (2 Minute) | Upward Thrust (5 Minute) | Upward Thrust (15 Minute) |
| Downward thrust: 8 and 20 both falling | Downward Thrust (2 Minute) | Downward Thrust (5 Minute) | Downward Thrust (15 Minute) |
The 5 over 8 cross runs on more bar lengths: 5 SMA Crossed Above 8 SMA (1 Min) (X5A8_1), 5 SMA Crossed Above 8 SMA (2 Min), 5 SMA Crossed Above 8 SMA (4 Min), 5 SMA Crossed Above 8 SMA (5 Min), 5 SMA Crossed Above 8 SMA (10 Min), 5 SMA Crossed Above 8 SMA (20 Min) and 5 SMA Crossed Above 8 SMA (30 Min) minutes, with matching down crosses such as 5 SMA Crossed Below 8 SMA (5 Min) (X5B8_5). Daily crosses use the price alerts Crossed Above 20 Day Moving Average (CA20), Crossed Above 50 Day Moving Average (CA50) and Crossed Above 200 Day Moving Average (CA200) and their down versions.
An intraday cross is about the next hour or two. The 8 over 20 on a 5 minute chart can flip three or four times in one session on an active stock. Day traders use it to time an entry inside a move they already like.
A daily cross is about the next weeks. When price crosses the 50 or 200 day average, it fires once and may not fire again for months. Swing traders treat it as a change in the backdrop, not as an entry by itself.
Mixing the two works well: pick stocks with a daily filter, such as price above the 200 day, and time them with an intraday cross.
Most crossover losses come from sideways stocks where the averages cross back and forth. Three filters cut most of them:
Whipsaw filter
| Alert or filter | Setting |
|---|---|
| Average Directional Index (ADX) | Min 25. Daily ADX (14 period) measures trend strength, not direction. 25 is a moderate trend, 40 a strong one. |
| Relative Volume (RV) | Min 1.5. A cross on light volume is easier to undo. |
| Same-Alert Count Today (Count) | Max 2 for the same alert today. A stock crossing for the fifth time is chopping. |
| 20 vs. 200 Period SMA (5 min) (5Sma20a200) | Min 0 on long crosses, so the 20 is already above the 200 on the 5 minute chart. |
Start with these, then loosen one at a time if the window goes too quiet.
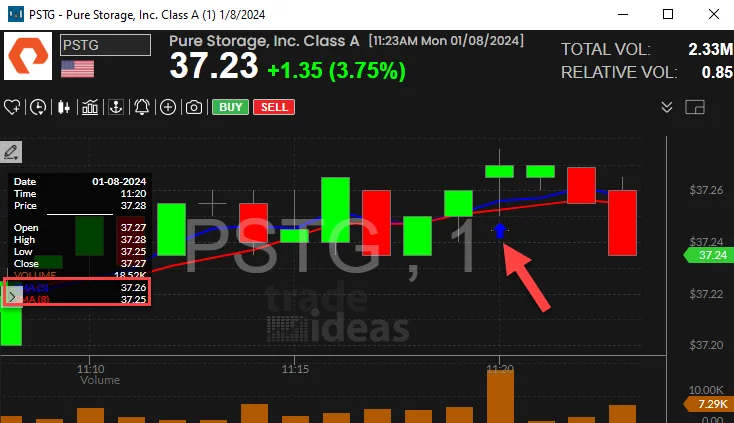
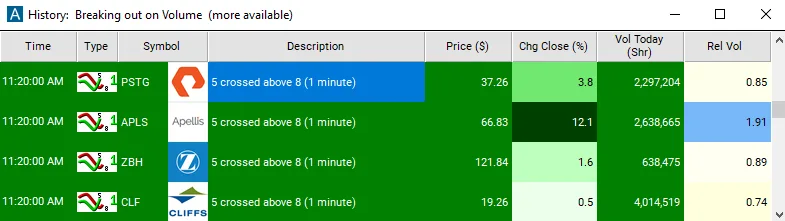
The real capture from the 5 over 8 SMA (1 minute) help page, shown on this page, is Pure Storage (PSTG) on January 8, 2024. At 11:20 a.m. ET the 5 period average (37.26) moved above the 8 period average (37.25) on the 1 minute chart, with price at $37.28, and the alert fired.
Two bars later, red bars took price back under both averages. That is a normal 1 minute cross: it marks the turn the moment it happens, and it can undo just as fast. Relative volume on the chart read 0.85, below normal, which is the kind of reading the whipsaw filter above is built to screen out.
The golden cross is one specific crossover: the 50 day average moving above the 200 day. It changes slowly and says something about the long-term trend. The alerts on this page cover the faster crosses traders use during the day. For the 50/200 day setup, built as a custom formula, see the golden cross scanner.
Every crossover alert in Trade Ideas uses simple moving averages. There are no EMA crossover alerts, so this page does not promise them. Simple averages weight every bar the same, so they turn a little later than exponential ones. If you trade EMA crosses on your charts, the SMA alerts still find the same trend changes, just a bar or two later, and the Formula Editor lets you build your own custom filters on top.
Example numbers, not a real trade
Crosses whip back and forth in choppy markets. Short averages on 1 minute bars cross many times an hour.
Averages lag. The cross can come after a good part of the move.
Test your rules in a simulated account first.
Free account, just an email. No card. Live access for a limited time.
Plain answers to what traders search for.
A scanner that alerts when a faster moving average crosses a slower one. Trade Ideas streams SMA crosses on 1 to 30 minute charts plus daily moving average breaks.
No. The crosses are simple moving averages.
Yes. 20 SMA Crossed Above 200 SMA (5 Min) (YCAD5) and 20 SMA Crossed Below 200 SMA (5 Min) (YCBD5) fire the 20/200 period SMA cross on 5 minute bars; 2 and 15 minute versions exist too.
The crosses come in 1 to 30 minute versions. For longer trends, use the daily 20, 50 and 200-day alerts.
On the golden cross scanner page.
You can try it with a free account, just an email, no card. Live access is for a limited time, then it is part of a paid plan.
There is no single best one. Shorter pairs fire earlier and more often; longer pairs fire later and less often.
Past results, including backtests, don't guarantee future results.
Free account, just an email. No card. Live access for a limited time. Ready to buy? See plans & pricing

