
Light Mode

Japanese candlestick patterns, spotted on every stock the moment the bar closes.
Doji, hammer, engulfing, piercing, tails and more, on 2 to 60-minute charts, streaming live.
Free account, just an email. No card. Live access for a limited time.

Named to the Inc. 5000 list of America’s fastest-growing private companies six years in a row (2017–2022).

Investopedia: Best Short Term Stock Screener, 2024
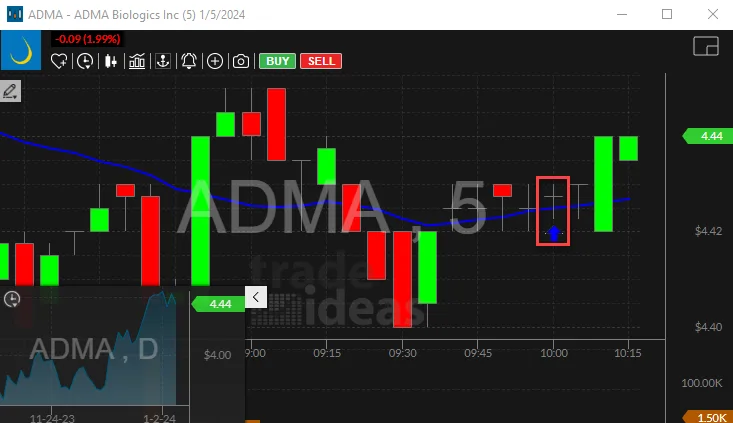
Each Japanese candlestick pattern is its own alert, on several bar lengths. When a bar closes and the pattern is there, the alert fires.
Streaming Alerts run in TI Pro, our desktop app for Windows (on a Mac, through Parallels).
Japanese candlestick patterns are shapes made by one, two or three bars: where a bar opened, closed, and how far it reached. Traders read them as signs of who won that bar, buyers or sellers.
A candlestick screener checks every stock's latest bar for those shapes. Trade Ideas does it live: the alert fires as each bar closes, since a candle is not finished until then.
For how pattern recognition works behind the scenes, see candlestick pattern recognition.
| Alert | Pattern |
|---|---|
| 5 Minute Doji (DOJ5) | Doji: open and close nearly the same. Also 10, 15, 30, 60 minute. |
| 5 Minute Hammer (HMR5) | Hammer: small body near the top, long lower tail. Also 2 to 60 minute. |
| 5 Minute Hanging Man (HGM5) | Hanging man: the hammer shape after a run up. |
| 5 Minute Bullish Engulfing (NGU5) | Bullish engulfing: a green body covers the prior red body. |
| 5 Minute Bearish Engulfing (NGD5) | Bearish engulfing: the reverse. |
| 5 Minute Piercing Pattern (PP5) | Piercing pattern: a green bar closes back into the prior red bar. |
| 5 Minute Dark Cloud Cover (DCC5) | Dark cloud cover: a red bar closes down into the prior green bar. |
| 5 Minute Bottoming Tail (BT5) | Bottoming tail: long lower tail, buyers stepping in. |
| 5 Minute Topping Tail (TT5) | Topping tail: long upper tail, sellers stepping in. |
| 5 Minute Wide Range Bar (WRB5) | Wide range bar: a bar much bigger than recent bars. |
| 5 Minute Green Bar Reversal (GBR5) | Green bar reversal after a run of red bars. |
| 5 Minute Red Bar Reversal (RBR5) | Red bar reversal after a run of green bars. |
| 5 Minute Narrow Range Buy Bar (NRBB5) | Narrow range buy bar. |
| NR7 (15 Minute) (NR7) | Narrowest range of the last seven bars. |
| 5 Minute 1-2-3 Continuation Buy Signal (C1U_5) | 1-2-3 continuation buy signal. |
A doji is a bar where the open and close are nearly the same. It says buyers and sellers were even for that bar. 5 Minute Doji (DOJ5), 15 Minute Doji (DOJ15) and 60 Minute Doji (DOJ60) fire it on 5, 15 and 60 minute bars.
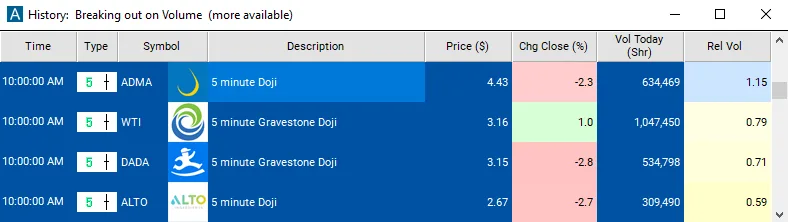
Traders look for doji after a run, as a sign the run is tiring. There is no separate dragonfly or gravestone alert to turn on, but the alert description can name the type: the real capture on this page shows “5 minute Gravestone Doji.”
A hammer has a small body near the top and a long lower tail. Sellers pushed it down, buyers pushed it back. 5 Minute Hammer (HMR5) and 15 Minute Hammer (HMR15) fire it live. The same shape after a run up is a hanging man, 5 Minute Hanging Man (HGM5).
A bullish engulfing bar is a green body that fully covers the prior red body. 5 Minute Bullish Engulfing (NGU5) fires it; 5 Minute Bearish Engulfing (NGD5) fires the bearish version. Engulfing alerts come in 5, 10, 15 and 30 minute versions.
A wide range bar is much bigger than the bars around it, often the start of a move. 5 Minute Wide Range Bar (WRB5) fires it on 5 minute bars; 2 and 15 minute versions exist too.
The 1-2-3 continuation is a tall bar, a small pause bar, then a break past both. 5 Minute 1-2-3 Continuation Buy Signal (C1U_5) and 5 Minute 1-2-3 Continuation Sell Signal (C1D_5) fire the buy and sell signals.
Candlestick charts started with rice traders in Japan centuries ago and came to Western traders in the late 1900s. The names, doji, hammer, engulfing, come from that tradition.
Each candle shows four prices: open, high, low and close. The body is the open-to-close range; the tails, or wicks, show how far price reached past it. Patterns are named shapes of one or more of those candles.
Doji, hammer, hanging man, wide range bar and the tails are single-candle patterns: the last bar alone has the shape.
Engulfing, piercing and dark cloud cover compare the last bar to the one before. The bar reversals look at a run of bars. The 1-2-3 continuation uses three.
A 2 minute hammer is a tiny event. A 60 minute hammer reflects an hour of trading. Most candle alerts come in several lengths so you can match your chart.
Day traders often use 5 and 15 minutes. Traders holding into the afternoon use 30 and 60.
A candle pattern means more at a level that matters. A hammer at VWAP, at yesterday's low, or at a 62% Fibonacci level gets more attention. Combine the candle alerts with Distance From VWAP 1 (VWAP) or the Fibonacci scanner.
5 Minute Green Bar Reversal (GBR5) fires on a green bar after a string of red bars; 5 Minute Red Bar Reversal (RBR5) on a red bar after green bars. With 5 Minute Bottoming Tail (BT5) and 5 Minute Hammer (HMR5), these are the alerts traders use for intraday reversal signals.
A screener runs your candle rule on a list when you ask, often on daily bars. The alerts here fire as each intraday bar closes, on every US stock.
The capture in the proof section is real. At 10:00:00 a.m. ET, the 5 Minute Doji (DOJ5) alert fired on four stocks as the 5 minute bar closed. ADMA was at $4.43, down 2.3%, with Relative Volume of 1.15. WTI and DADA both printed a "5 minute Gravestone Doji," a doji with a long upper wick and the close near the low. ALTO printed a plain doji at $2.67.
Notice that all four fired at the same second. Candle alerts fire when the bar closes, so on the 5 minute chart they land at :00, :05, :10 and so on. If you want to see a candle form before it closes, the bar-close alerts are not for you; momentum alerts like Running Up Now fire mid-bar.
The description line tells you which doji it was. A gravestone after a run up reads differently from a plain doji in a range, and you see that in the window without opening the chart.
| Alert or filter | What it does |
|---|---|
| 2 Minute Hammer (HMR2) | 2 minute hammer. Very fast; for scalpers. |
| 5 Minute Hammer (HMR5) | 5 minute hammer. A common choice for day traders. |
| 15 Minute Hammer (HMR15) | 15 minute hammer. Fewer, cleaner signals. |
| 60 Minute Hammer (HMR60) | 60 minute hammer. Useful for swing entries. |
| 15 Minute Bullish Engulfing (NGU15) | 15 minute bullish engulfing. |
| 15 Minute Dark Cloud Cover (DCC15) | 15 minute dark cloud cover, a bearish two-candle pattern. |
| 15 Minute Piercing Pattern (PP15) | 15 minute piercing pattern, a bullish two-candle pattern. |
| 15 Minute Topping Tail (TT15) | 15 minute topping tail. |
| 15 Minute Bottoming Tail (BT15) | 15 minute bottoming tail. |
The longer the bar, the fewer alerts and the more each one means. Many traders pick one or two bar lengths and stick with them.
Bullish reversal at the low
| Alert or filter | Setting |
|---|---|
| 15 Minute Hammer (HMR15) | On. |
| 15 Minute Bullish Engulfing (NGU15) | On. |
| 15 Minute Piercing Pattern (PP15) | On. |
| Change From The Close (%) (FCP) | Max -2, so the stock is red on the day. |
| Relative Volume (RV) | Min 1.2. |
Bearish reversal at the high
| Alert or filter | Setting |
|---|---|
| 15 Minute Hanging Man (HGM15) | On. Hanging man. |
| 15 Minute Bearish Engulfing (NGD15) | On. |
| 15 Minute Dark Cloud Cover (DCC15) | On. |
| Change From The Close (%) (FCP) | Min 2. |
| Below High (BelowHigh) | Max 1%, so it is near the day’s high. |
Indecision
| Alert or filter | Setting |
|---|---|
| 15 Minute Doji (DOJ15) | On. |
| NR7 (15 Minute) (NR7) | On. Narrowest 15 minute range of the last 7 bars. |
| Consolidation (ConDays) | Optional, for dojis in a daily range. |
A hammer in the middle of nowhere means little. A hammer on the 200 day average, at yesterday’s low, or on a Fibonacci level is a sign buyers stepped in where they were expected. Add Position in Previous Day's Range (RPD) with a max of 10 to see only candles near yesterday’s low, or Change From 200 Day SMA (%) (MA200P) between -1 and 1 to see candles at the 200 day.
| Alert family | Bias | Bar lengths |
|---|---|---|
| 15 Minute Doji | Indecision | 5, 10, 15, 30, 60 min |
| 15 Minute Hammer | Bullish | 2, 5, 10, 15, 30, 60 min |
| 15 Minute Hanging Man | Bearish | 2, 5, 10, 15, 30, 60 min |
| 15 Minute Bullish Engulfing | Bullish | 5, 10, 15, 30 min |
| 15 Minute Bearish Engulfing | Bearish | 5, 10, 15, 30 min |
| 15 Minute Piercing Pattern | Bullish | 5, 10, 15, 30 min |
| 15 Minute Dark Cloud Cover | Bearish | 5, 10, 15, 30 min |
| 15 Minute Bottoming Tail | Bullish | 2, 5, 10, 15, 30, 60 min |
| 15 Minute Topping Tail | Bearish | 2, 5, 10, 15, 30, 60 min |
| 15 Minute Green Bar Reversal | Bullish | 2, 5, 15, 60 min |
| 15 Minute Red Bar Reversal | Bearish | 2, 5, 15, 60 min |
| NR7 (15 Minute) | Neutral | 1, 2, 5, 10, 15, 30 min |
| 15 Minute Narrow Range Buy Bar | Bullish | 5, 10, 15, 30 min |
| 15 Minute Narrow Range Sell Bar | Bearish | 5, 10, 15, 30 min |
| 15 Minute Wide Range Bar | Either | 2, 5, 15 min |
| 15 Minute 1-2-3 Continuation Buy Signal | Bullish | 2, 5, 15, 60 min |
| 15 Minute 1-2-3 Continuation Sell Signal | Bearish | 2, 5, 15, 60 min |
Each link goes to the 15 minute version’s help page; the other bar lengths are listed there.
Hammer at support window
| Alert or filter | Setting |
|---|---|
| 15 Minute Hammer (HMR15) | On. |
| 15 Minute Bottoming Tail (BT15) | On, for the bottoming tail version. |
| Position in Previous Day's Range (RPD) | Max 15, near the bottom of yesterday’s range. |
| Relative Volume (RV) | Min 1.5. |
| Dollar Volume (DV) | Min $5 million. |
Add the Crossed Below Support alert in a second window to see the stocks that did not hold.
Candle alerts need regular bars, so most traders run them from the open on. Premarket bars can be thin, with long gaps between trades, and a single trade can make a misleading candle.
Doji (15 Minute Doji). Open and close at about the same price. Buyers and sellers are even for that bar. Confirmation: A doji means more after a run. Wait for the next bar to break the doji’s high or low; that break shows which side won.
Hammer (15 Minute Hammer). A long lower tail and a close near the high, after a drop. Sellers pushed it down; buyers took it back. Confirmation: Best at a known level. Many traders want the next bar to trade above the hammer’s high before buying, with the stop under the tail.
Hanging man (15 Minute Hanging Man). The same shape as a hammer, but after a rise. It warns that sellers showed up near the high. Confirmation: Weak on its own. Traders look for a close below the hanging man’s body on the next bar.
Engulfing (15 Minute Bullish Engulfing). A bar whose body covers the whole body of the bar before it, in the other color. Confirmation: Stronger on above-normal volume and after a clear move the other way. The bearish version is the Bearish Engulfing alert.
Piercing pattern and dark cloud cover (15 Minute Piercing Pattern). Two-bar turns. A piercing pattern opens low and closes past the middle of the prior red bar; dark cloud cover is the bearish mirror. Confirmation: Look for them at the end of a move, not in a range. The deeper the second bar closes into the first, the stronger the read.
Bottoming and topping tails (15 Minute Bottoming Tail). A long tail on one end of the bar, showing a level was tested and rejected. Confirmation: A tail that tests yesterday’s low, VWAP or a round number tells you more than one in open space.
Green and red bar reversals (15 Minute Green Bar Reversal). A green bar after a run of red bars, or the reverse. Confirmation: The simplest turn signal. Traders use it as the trigger once another reason, such as a Fib level, already put the stock on watch.
Narrow range and NR7 (NR7 (15 Minute)). A bar with a smaller range than the bars before it. The market is pausing. Confirmation: Not a direction signal. It sets up a break, so many traders pair it with consolidation breakout alerts.
Wide range bar (15 Minute Wide Range Bar). A bar much bigger than normal for the stock. Confirmation: Shows urgency. A wide range bar that closes near its high, on volume, is a strong push; one with a long tail may be exhaustion.
1-2-3 continuation (15 Minute 1-2-3 Continuation Buy Signal). A strong bar, a short pause, then a move past the first bar. The trend resumes. Confirmation: The setup alert fires first and the signal alert when the pattern completes. Many traders wait for the signal.
Volume shows whether a candle had real participation. Volume (15 min) (Vol15), the volume of the last 15 minutes, lets you set a floor so 15 minute candles on a few hundred shares do not show up. Relative volume does the same job across stocks of different sizes.
One candle is one bar. It is a hint, not a forecast.
Short bar lengths fire a lot. Start with 15 minutes or more.
Test your rules in a simulated account first.
Free account, just an email. No card. Live access for a limited time.
Plain answers to what traders search for.
A scanner that checks every stock's bars for Japanese candlestick patterns and alerts when one forms. Trade Ideas fires each pattern as the bar closes.
You can try it with a free account, just an email, no card. Live access is for a limited time, then it is part of a paid plan.
Doji, hammer, hanging man, engulfing, piercing, dark cloud cover, tails, wide range bars, bar reversals, NR7 and the 1-2-3 continuation.
There is one doji alert per bar length, not separate dragonfly or gravestone alerts. The alert description can name a gravestone doji, as in the real capture on this page.
The alerts are rule based, with written rules on each help page. Holly AI Signals are a separate feature and part of TI Premium.
The candle alerts run on intraday bars, from 2 to 60 minutes.
Yes, 5 Minute Hammer (HMR5) and the other hammer alerts.
Yes, 5 Minute Bullish Engulfing (NGU5) and its 10, 15 and 30 minute versions.
Past results, including backtests, don't guarantee future results.
Free account, just an email. No card. Live access for a limited time. Ready to buy? See plans & pricing

