


Distance From VWAP 1
Table of Contents
- Understanding the Distance from VWAP 1 Filter
- Distance from VWAP 1 Filter Settings
- Using the Distance from VWAP Filter
- FAQs
Understanding the Distance from VWAP 1 Filter
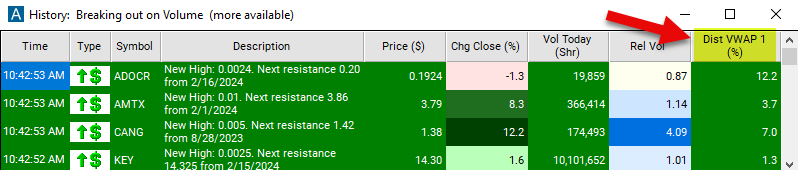
The Distance from VWAP 1 filter in stock trading refers to a technical analysis tool used by traders to assess how far a stock's current price is from the Volume Weighted Average Price (VWAP) over a specific period. VWAP is a trading benchmark that gives the average price a stock has traded at throughout the day, weighted by volume. This filter compares the last price to the stock's VWAP for the day (VWAP1). This filter uses percentage.
Here's how the distance from VWAP 1 filter works:
Calculation of VWAP: VWAP is calculated by multiplying the price of each trade by the volume of that trade, summing up these values, and dividing the total by the cumulative volume traded over the period.
Identification of Distance from VWAP 1: The distance from VWAP 1 is calculated as the absolute difference between the current stock price and the VWAP for the current trading day.
Application in Trading Strategies: Traders use the distance from VWAP 1 filter to make trading decisions. For example:
- If the current price is significantly above VWAP 1, it may suggest bullish sentiment, and traders may look for buying opportunities or expect the price to continue rising.
- Conversely, if the current price is significantly below VWAP 1, it may indicate bearish sentiment, and traders may consider short-selling or exiting long positions.
Distance from VWAP 1 Filter Settings
The settings of each Trade Ideas filter are defined in the Window Specific Filters Tab located in the Configuration Window of your Alert/Top List Window.
Here is how to setup the filter in your configuration window:
-
Set the min value to 0.001 to see stocks currently trading above their VWAP.
-
Set the max value to -0.001 to see stocks currently trading below their VWAP.
Using the Distance from VWAP Filter
Several trading strategies can be employed with the Distance from VWAP 1 filter. Here are a few examples:
Mean Reversion Strategy: Traders anticipate that the price will revert to the mean, which is represented by VWAP. They look for opportunities when the price deviates significantly from VWAP. If the price is trading significantly below VWAP 1, indicating oversold conditions, traders may anticipate a bounce back towards VWAP. They can buy the stock with the expectation that the price will revert to the mean. Similarly, if the price is trading significantly above VWAP 1, indicating overbought conditions, traders may anticipate a pullback towards VWAP and consider short-selling.
Breakout Strategy: Traders look for breakout opportunities when the price moves significantly above or below VWAP 1. If the price breaks out above VWAP 1 with significant volume, it may indicate a bullish breakout. Traders can buy the stock with the expectation of further upward movement. Conversely, if the price breaks out below VWAP 1 with significant volume, it may indicate a bearish breakout. Traders may consider short-selling the stock.
Pullback Strategy: Traders look for pullback opportunities to enter trades in the direction of the overall trend. In an uptrend, traders wait for the price to pull back to VWAP 1. If the pullback is accompanied by low volume and the distance from VWAP 1 remains relatively small, it may present a buying opportunity. Similarly, in a downtrend, traders wait for the price to pull back to VWAP 1 and consider short-selling opportunities if the pullback is weak.
FAQs
What is VWAP, and why is it important?
- VWAP stands for Volume Weighted Average Price, which is a benchmark used by traders to assess the average price a stock has traded at throughout the trading day, weighted by volume. It is important because it provides insight into the average price levels at which significant trading activity has occurred.
Are there specific timeframes or periods over which VWAP is calculated?
- VWAP can be calculated for different timeframes, such as the entire trading day, morning session, afternoon session, or any other specified period. Traders can adjust the timeframe based on their trading preferences and strategies.
Can the distance from VWAP 1 filter be used in conjunction with other technical indicators?
- Yes, traders often combine the distance from VWAP 1 filter with other technical indicators, such as moving averages, oscillators, or volume indicators, to confirm trading signals and enhance their analysis.
Filter Info for Distance From VWAP 1 [VWAP]
- description = Distance from VWAP 1
- keywords = Single Print
- units = %
- format = 1
- toplistable = 1
- parent_code =