
Light Mode

Every stock pulling back to a key Fib level, flagged the moment it happens.
Trade Ideas measures each stock's move today and alerts when price retraces to 38%, 50%, 62% or 79% of it.
Free account, just an email. No card. Live access for a limited time.

Named to the Inc. 5000 list of America’s fastest-growing private companies six years in a row (2017–2022).

Investopedia: Best Short Term Stock Screener, 2024
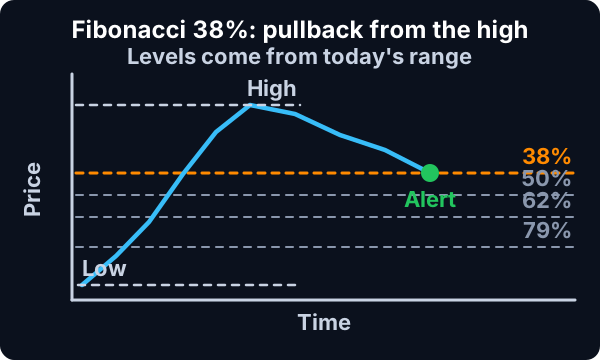
You do not draw the levels. Trade Ideas takes today's range for each stock, works out the retracement levels, and streams an alert when price reaches one.
Streaming Alerts (Scanner) run in TI Pro, our desktop app for Windows (on a Mac, through Parallels). See the Fibonacci alerts in the help library.
Stocks pulling back part of today's move. If a stock ran from $20 to $22, a 38% retracement is about $21.24 and a 62% retracement is about $20.76. Many traders watch those levels for the pullback to stop.
Drawing Fib levels by hand works on one chart. The scanner does it on every US stock and tells you when price gets there.
| Alert or filter | What it does |
|---|---|
| Fibonacci 38% Buy Signal (FU38) | Price pulls back 38% of today's move up. Shown as a buy. |
| Fibonacci 50% Buy Signal (FU50) | Pullback to the 50% level. |
| Fibonacci 62% Buy Signal (FU62) | Pullback to the 62% level, a level many traders call the golden ratio. |
| Fibonacci 79% Buy Signal (FU79) | Deep pullback to 79%. |
| Fibonacci 38% Sell Signal (FD38) | Price bounces 38% of today's move down. Shown as a sell. |
| Fibonacci 50% Sell Signal (FD50) | Bounce to 50%. |
| Fibonacci 62% Sell Signal (FD62) | Bounce to 62%. |
| Fibonacci 79% Sell Signal (FD79) | Bounce to 79%. |
| 25% Pullback From Highs (PFH25) | Price gives back 25% of the move from the open or prior close to today's high. |
| 75% Pullback From Lows (PFL75) | Price gets back 75% of the drop to today's low. |
The levels here round 38.2% to 38%, 61.8% to 62% and 78.6% to 79%.
Take the low and the high of the move. The range is the high minus the low. A 38% retracement is the high minus 38% of the range; 50% is the halfway point; 62% and 79% sit lower.
Trade Ideas uses today's range for each stock, so the levels move as the day's high and low change. A stock that makes a new high resets the math.
For a move down, it runs the other way: the alerts fire as price bounces up into the levels.
Some traders mean pivot points when they say Fibonacci pivots. Trade Ideas has distance-from-pivot filters built from the prior day's high, low and close: Distance From Pivot (Pivot), Distance From Pivot R1 (PivotR1), Distance From Pivot R2 (PivotR2), Distance From Pivot S1 (PivotS1) and Distance From Pivot S2 (PivotS2).
They show how far price sits from each classic pivot level, in percent. They are classic pivots, not Fibonacci-spaced pivots, so treat them as nearby levels to watch alongside the Fib alerts.
Trend pullbacks. Buy signals on a stock up strongly on the day, entering near the level with a stop under the next one.
Fades. Sell signals on a stock down hard, looking for the bounce to stall.
Context. A Fib level that lines up with VWAP or yesterday's high gets more attention than one sitting alone.
See the pullback scanner for more ways to find dips in strong stocks.
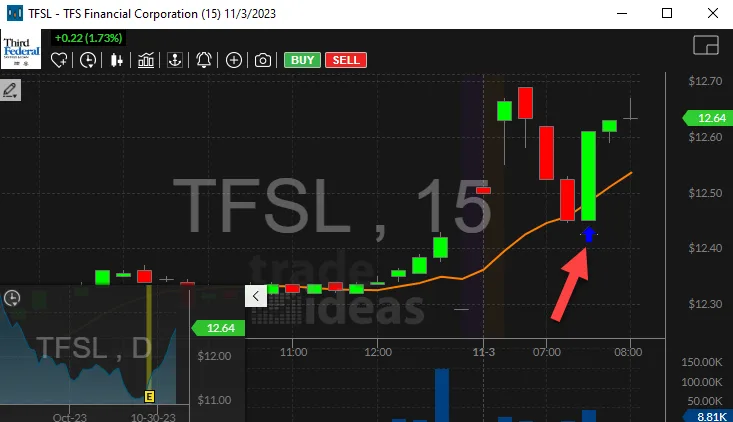
The arrow marks where the stock had won back 75% of its drop to the day's low. The Fib alerts work the same way: the level comes from today's move, and the alert fires on the print that reaches it.
There is no accuracy number that holds for every stock and every day. A level is a place many traders watch, which can make it matter, but price goes through levels all the time.
If you want numbers for your own rules, test them. OddsMaker can backtest an alert setup over past days and show how it did. OddsMaker, the backtester, is part of TI Premium. Results from the past don't guarantee future results.
A screener checks a list against a rule when you run it. A scanner watches all the time. The Fib alerts are a scanner: they fire on the print that reaches the level, during the session.
If you want a screener-style list, build a Top List (Screener) with Change From The Close and Position in Range filters, then watch the Fib alerts for the moment price gets to the level.
38% is a shallow pullback; strong trends often hold it. 50% is not a Fibonacci ratio but it is the halfway point and many traders watch it anyway. 62% is the level most associated with Fibonacci. 79% is a deep pullback; a stock that falls through it has given back most of its move.
Many traders run 50 and 62 together and treat the zone between them as the area to watch.
The alert names say buy and sell, but they describe direction, not advice. A buy signal means price fell back into a level during a move up, the spot where a dip buyer would look. A sell signal means price bounced up into a level during a move down, where a short seller would look.
What you do there is up to you.
A pullback on light volume into a Fib level, in a stock up on heavy volume earlier, is a common setup. Add Relative Volume (RV) at a min of 1.5 for the day, and Change From 50 Day SMA (%) (MA50P) above 0 for the daily trend.
On a gap up, the move used for the levels runs from the prior close or the open, whichever makes the bigger pattern, up to today's high. That ties the Fib scan to the gap: a 50% retracement of a gap is a level many gap traders watch. See the gap scanner.
Example numbers, not a real trade
| Alert or filter | What it does |
|---|---|
| Fibonacci 38% Buy Signal (FU38) | Buy signal: price pulls back 38% of an up move and holds. |
| Fibonacci 50% Buy Signal (FU50) | Buy signal at 50%. |
| Fibonacci 62% Buy Signal (FU62) | Buy signal at 62%. |
| Fibonacci 79% Buy Signal (FU79) | Buy signal at 79%, the last level before the full move is gone. |
| Fibonacci 38% Sell Signal (FD38) | Sell signal: price bounces 38% of a down move and stalls. |
| Fibonacci 50% Sell Signal (FD50) | Sell signal at 50%. |
| Fibonacci 62% Sell Signal (FD62) | Sell signal at 62%. |
| Fibonacci 79% Sell Signal (FD79) | Sell signal at 79%. |
Strong uptrends tend to hold the 38% level. Normal ones pull back to 50 or 62%. A move to 79% is close to giving the whole move back. Add Change From 20 Day SMA (%) (MA20P) with a min of 0 so you only see buy signals in stocks above their 20 day.
A Fib level tells you where; a candle tells you when. Pair Fibonacci 62% Buy Signal (FU62) with 5 Minute Green Bar Reversal (GBR5), the 5 minute green bar reversal, or 5 Minute Hammer (HMR5), the hammer, on the same window. When both fire within a few minutes on the same stock, buyers showed up right at the level.
A common plan: enter at a buy signal, stop just past the next deeper level, and target the high of the move. A 50% entry has its stop under 62%. A 62% entry has its stop under 79%.
Example numbers, not a real trade
The Fib alerts measure the move that just happened, not a long-term swing you pick by hand. That makes them a day trading tool: they fire on the pullbacks inside today’s moves, as each level is reached.
A level is not a floor. Deep pullbacks often keep going.
Levels from a small move mean little. Filter for stocks with a real move today.
Test your rules in a simulated account first.
Free account, just an email. No card. Live access for a limited time.
Plain answers to what traders search for.
A scanner that finds stocks pulling back to Fibonacci levels of a move. Trade Ideas alerts at 38%, 50%, 62% and 79% of today's range.
Take the move's high and low. A 38% retracement is the high minus 38% of that range. Trade Ideas uses today's range for each stock.
No level works every time. Test your own rules; OddsMaker backtests alert setups and is part of TI Premium.
It depends on the stock, the move and your exits. There is no single rate. Backtest your setup rather than trusting a number from someone else.
Trade Ideas has classic pivot distance filters like Distance From Pivot (Pivot) and Distance From Pivot R1 (PivotR1). They are not Fibonacci-spaced pivots.
You can try it with a free account, just an email, no card. Live access is for a limited time, then it is part of a paid plan.
The common retracement levels are 38.2%, 50%, 61.8% and 78.6%. Trade Ideas rounds them to 38, 50, 62 and 79.
Streaming Alerts run in TI Pro on Windows, or on a Mac through Parallels.
Past results, including backtests, don't guarantee future results.
Free account, just an email. No card. Live access for a limited time. Ready to buy? See plans & pricing

