
Light Mode

Strong stocks dipping into buy zones, flagged live.
Pullbacks from the high of day, Fibonacci retracements and trailing-stop style moves, streaming live.
Free account, just an email. No card. Live access for a limited time.

Named to the Inc. 5000 list of America’s fastest-growing private companies six years in a row (2017–2022).

Investopedia: Best Short Term Stock Screener, 2024
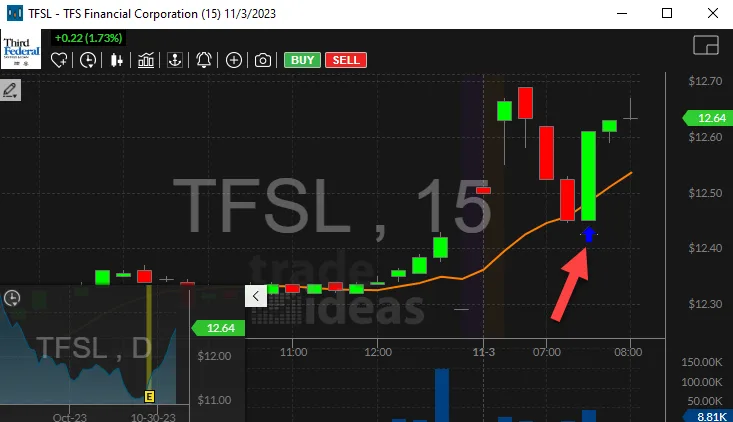
A pullback is a strong stock giving back part of its move. Trade Ideas measures the move for each stock and alerts when the pullback reaches a set level.
Streaming Alerts (Scanner) run in TI Pro, our desktop app for Windows (on a Mac, through Parallels).
Stocks that ran, then came back part of the way. Traders who like to buy strength on a dip watch for these, because the entry is closer to a level they can lean on.
| Alert | What it does |
|---|---|
| 25% Pullback From Highs (PFH25) | Gives back 25% of the move from the open or prior close to today's high. |
| 75% Pullback From Highs (PFH75) | Gives back 75% of that move. |
| 25% Pullback From Lows (PFL25) | Gets back 25% of the drop to today's low. |
| 75% Pullback From Lows (PFL75) | Gets back 75% of the drop. |
| Fibonacci 38% Buy Signal (FU38) | Pullback to the 38% Fibonacci level. |
| Fibonacci 50% Buy Signal (FU50) | Pullback to 50%. |
| Fibonacci 62% Buy Signal (FU62) | Pullback to 62%. |
| Trailing Stop, % Down (TSPD) | Moves down 0.5% off a local high, then every 0.25%. |
| Check Mark (CMU) | Check mark: a push, a pullback, then new highs. |
25% Pullback From Highs (PFH25) is a shallow dip, 75% Pullback From Highs (PFH75) a deep one. Pair them with Change From The Close (%) (FCP) at a min like 3 so only stocks with a real move today come through.
Check Mark (CMU) fires on a push up, a pullback, then a move to new highs. The inverted version, Inverted Check Mark (CMD), is the reverse.
The hero chart shows a 75% Pullback From Lows alert: the stock dropped to its low of the day, then won back 75% of the drop, and the alert marks the print. The pullback-from-highs alerts work the same way in the other direction.
A 25% pullback means the stock held most of its gain. A 75% pullback means it gave most of it back. Strong trends often hold shallow pullbacks; deep ones can be a sign the move is done.
Some traders look for a pullback followed by a surge back up. Run 25% Pullback From Highs (PFH25) to find the dip and Running Up Now (RUN) or New High (NHP) for the push back to highs.
Trailing Stop, % Down (TSPD) starts at a 0.5% move down off a local high and repeats every 0.25%. It does not manage your position; it tells you how far a stock has slipped.
For swing trades, use Change From 20 Day SMA (%) (MA20P) near 0 in a stock with Change From 50 Day SMA (%) (MA50P) above 0: a pullback to the 20-day average in an uptrend. See the swing trading scanner.
| Alert or filter | What it does |
|---|---|
| Fibonacci 38% Buy Signal (FU38) | Buy signal at the 38% retracement of the move up. |
| Fibonacci 50% Buy Signal (FU50) | Buy signal at the 50% retracement. |
| Fibonacci 62% Buy Signal (FU62) | Buy signal at the 62% retracement. |
| Fibonacci 38% Sell Signal (FD38) | Sell signal at the 38% retracement of a move down. |
| Fibonacci 50% Sell Signal (FD50) | Sell signal at 50%. |
| Fibonacci 62% Sell Signal (FD62) | Sell signal at 62%. |
Shallow trends pull back 38%. Deeper pullbacks to 62% are still normal for many stocks. Past that, many traders stop calling it a pullback.
| Alert or filter | What it does |
|---|---|
| 25% Pullback From Highs (PFH25) | 25% pullback from today’s high toward the open or prior close. |
| 25% Pullback From Highs (Close) (PFH25C) | The same 25% pullback, measured toward yesterday’s close. |
| 75% Pullback From Highs (PFH75) | 75% pullback from the high. |
| 25% Pullback From Lows (PFL25) | 25% bounce from today’s low. |
| 75% Pullback From Lows (PFL75) | 75% bounce from the low. |
Uptrend qualifier
| Alert or filter | Setting |
|---|---|
| Change From 20 Day SMA (%) (MA20P) | Min 0, above the 20 day. |
| Change From 50 Day SMA (%) (MA50P) | Min 0, above the 50 day. |
| Change From The Close (%) (FCP) | Min 2, still green on the day. |
| 25% Pullback From Highs (PFH25) | On. |
| Fibonacci 50% Buy Signal (FU50) | On. |
Without the trend filters, the same alerts also fire on stocks that are just falling.
An intraday pullback lasts minutes to an hour and is measured against today’s move. The alerts above fire on those.
A swing pullback lasts days. Use a Top List (Screener) with Change (5 day, %) (U5DP) at a max of -3 and Change From 50 Day SMA (%) (MA50P) at a min of 0 to find stocks pulling back inside a longer uptrend, then use the intraday alerts to time the entry.
Check Mark (CMU) finds a push up, a pullback, then new highs. It is a pullback that already worked: the alert fires when price goes back over the high, so it suits traders who would rather pay up for proof than buy into the dip.
Trailing Stop, % Up (TSPU) fires when a stock moves up off a local low: first at 0.5%, then every 0.25% after that. Paired with a pullback filter, it shows the first bounce off a dip as it starts.
Wiggle (Stop Room) (Wiggle) is 15 minute volatility in dollars times relative volume. It tells you how much room the stock needs right now. A pullback stop tighter than the wiggle will likely get hit by normal noise.
A pullback can turn into a reversal. Set a stop under the next level.
Test your rules in a simulated account first.
Free account, just an email. No card. Live access for a limited time.
Plain answers to what traders search for.
A scanner that finds strong stocks giving back part of their move. Trade Ideas alerts at set pullback levels live.
Use the Fibonacci buy alerts or the pullback-from-highs alerts, with a change-from-close filter so the stock had a move.
A pullback scan limited to stocks in an uptrend, for example with Change From 50 Day SMA (%) above 0.
Not as one alert. A recipe of Consecutive Days and Change From The Close gets close.
You can try it with a free account, just an email, no card. Live access is for a limited time, then it is part of a paid plan.
A strong stock giving back part of its move before, possibly, moving on.
Past results, including backtests, don't guarantee future results.
Free account, just an email. No card. Live access for a limited time. Ready to buy? See plans & pricing

