


Wiggle
Table of Contents
- Understanding the Wiggle Filter
- Wiggle Filter Settings
- Using the Wiggle in Trading
- FAQs about Wiggle
Understanding the Wiggle Filter
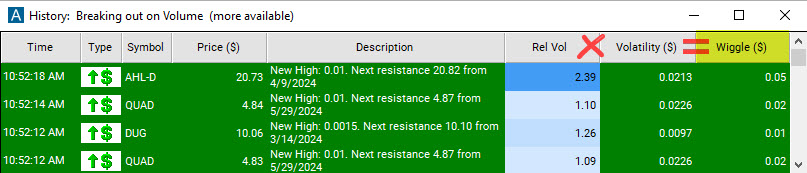
A stock’s wiggle is its 15 minute Volatility ($) [VWV] times its Relative Volume [RV].
In the context of the Wiggle Filter, the Volatility considered is over a 15-minute period, and it's based on two weeks of historical data. This short-term volatility helps traders gauge the stock's short-term price swings, giving them insights into the possible risk and reward.
Relative Volume is another critical aspect of the Wiggle Filter. It compares the current trading volume of a stock to its average volume for the same time of day, resulting in a ratio. By considering Relative Volume, traders can get a sense of how significant a current trend or price move is. If a stock's price is rising or falling with higher than usual volume, it may suggest a stronger, more significant move.
By integrating these two factors, the Wiggle Filter can provide valuable insights for setting a stop loss. A stop loss is an order to sell a security when it reaches a certain price and is designed to limit an investor's loss on a security position.
Because the Wiggle Filter considers a stock's recent price and volume history, it can potentially offer a more dynamic and responsive stop loss level. For instance, if a stock is showing higher volatility and volume (hence, a higher wiggle), the stop loss could be set wider to account for these larger price swings.
However, as the Wiggle Filter is uncapped, it's important for traders to note that it can potentially increase risk beyond a level they might be comfortable with. This is due to the potential for large price swings in highly volatile stocks or periods of high trading volume.
As with any trading tool, it should be used with caution and in conjunction with other indicators and risk management strategies.
Wiggle Filter Settings
Activating the Wiggle Filter is straightforward. You'll find its settings under the Window Specific Filters Tab in your Alert/Top List Window's Configuration Window.
You can set a minimum and/or maximum value, and stocks that don't fit within your parameters are automatically excluded from your scan results.
-
To find stocks that would require a higher Wiggle, for example a Wiggle of $10 or more, add the Wiggle Filter to your scan and enter 10 in the minimum field in the Windows Specific Filters Tab.
-
To find stocks that would require a low Wiggle, for example a Wiggle of $1, and enter 1 in the maximum field in the Windows Specific Filters Tab.
Traders might not filter stocks based on their Wiggle, but rather display the Wiggle in their scans without defining minimum and/or maximum values to use the returned Wiggle value of a stock for risk management and stop loss considerations.
Using the Wiggle in Trading
This 'wiggle' essentially provides a snapshot of a stock's potential price movement intensity over the next 15 minutes, considering both the volatility and trading volume.
For instance, let's assume Stock A has a volatility of $2 and a Relative Volume of 2.5, and Stock B has a volatility of $1 and a Relative Volume of 1. Here, the wiggle for Stock A would be $5, and for Stock B, it would be $1.
This suggests that Stock A might see more intense price swings over the next 15 minutes than Stock B, given its higher volatility and higher than average volume. Hence, if a trader is looking for quick, short-term trades with higher potential returns (and higher risk), they might choose to trade Stock A. If they're looking for less risk, they might prefer Stock B with its lower wiggle.
The wiggle can guide traders in placing their stop loss orders. In the case of Stock A with a wiggle of $5, the stop loss might be set wider than for Stock B with a wiggle of $1, to accommodate the larger potential price swings.
The Wiggle Filter can be adjusted to show only stocks that fall within a certain wiggle range. For example, a trader could set the filter to show only stocks with a wiggle of $2 to $5 if they're looking for moderate volatility and volume.
FAQs about Wiggle
How frequently does the Wiggle Filter update?
The Wiggle Filter updates in real-time.
Which other indicators or filters could aid in determining an effective stop loss?
Determining an effective stop loss involves a variety of factors, including the trader's risk tolerance, trading strategy, and the specific characteristics of the stock being traded. Several other indicators and filters can provide useful insights for setting stop losses:
- Average True Range (ATR): The ATR is a technical analysis indicator that measures market volatility by decomposing the entire range of a stock's price for that period. It can be used to set a stop loss that adjusts to the market's volatility.
- Support and Resistance Levels: These are price levels at which a stock repeatedly rises or falls before changing direction. They act as a psychological barrier for market participants and are often used in setting stop-loss orders.
- Moving Averages: Moving averages can help identify trends and potential reversal points, which can be useful for setting stop losses. For example, some traders might set their stop loss just below a significant moving average.
- Bollinger Bands: Bollinger Bands provide a range in which the price typically moves (based on statistical analysis). A stop loss could be placed outside this range.
- Percentage of Price or Fixed Dollar Amount: Some traders use a simple, predetermined percentage of the entry price or a fixed dollar amount to set their stop loss. While not as dynamic as other methods, this approach is straightforward and easy to implement.
- Smart Stop: Trade-Ideas has developed a proprietary risk management filter, known as the Smart Stop. It helps traders identify a custom stop loss exit point for trades made at the time the alert was triggered. This distinct exit point is specifically tailored to each stock symbol, taking into consideration elements such as the stock's volatility, relative volume, and daily trading range.
What steps can be taken to manage risk if the Wiggle Filter suggests a larger potential price swing?
If the Wiggle Filter indicates a large potential price swing, traders can manage risk by setting wider stop losses, reducing their position size, or using other risk management tools and strategies.
How can traders interpret a sudden increase or decrease in the wiggle value?
A sudden increase in wiggle value might indicate a surge in short-term volatility and trading volume, which could suggest a strong price movement in the near term. On the other hand, a sudden decrease might imply reduced volatility and volume, potentially indicating a less active trading environment or a slowdown in price movement. However, these interpretations should always be corroborated with other market indicators and news.
How does the Wiggle Filter respond to earnings announcements or other major news releases?
Major news releases or earnings announcements can significantly impact a stock's short-term volatility and trading volume. Therefore, the Wiggle Filter might show higher values during these events. Traders can use this information to gauge potential price swings but should also account for the increased uncertainty during these periods.
Can the Wiggle Filter be used to predict the direction of a stock's price movement?
The Wiggle Filter primarily provides information about the potential magnitude of a stock's price movement, based on recent volatility and volume. It does not directly indicate the direction of the price movement. Traders should use other analysis methods or indicators to determine the likely direction of the price movement.
Filter Info for Wiggle [Wiggle]
- description = Wiggle
- keywords =
- units = $
- format = p
- toplistable = 1
- parent_code =