


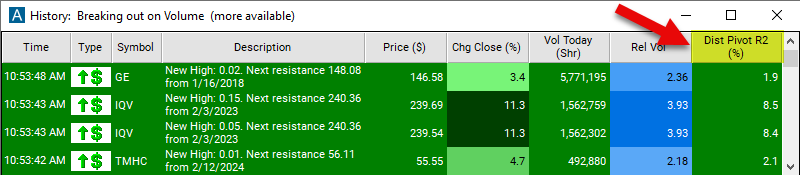
Distance From Pivot R2
Table of Contents
- Understanding the Distance from Pivot R2 Filter
- Distance from Pivot R2 Filter Settings
- Using the Distance from Pivot R2 Filter
- FAQs
Understanding the Distance from Pivot R2 Filter
This distance from pivot filter specifically refers to a strategy where traders look at how far a stock's current price is from a pivot point level, particularly the R2 level. R2 represents the second resistance level calculated from the pivot points formula.
Here's how it works:
Calculate Pivot Points: The first step is to calculate pivot points. This involves determining a pivot point (P) as well as support (S1, S2, etc.) and resistance (R1, R2, etc.) levels based on the previous day's price action. Here are the formulas to caculate those specific points:
- Resistance 2 = Pivot + (R1 - S1)
- Resistance 1 = 2 * Pivot - Low
- Pivot Point = (High + Close + Low) / 3
- Support 1 = 2 * Pivot - High
- Support 2 = Pivot - (R1 - S1)
These are all based on the previous day's high, low, and close:
Identify R2: R2 is the second resistance level calculated in the pivot points formula. It's considered a significant resistance level beyond which the stock may encounter further selling pressure.
Calculate Distance from R2: Once R2 is identified, traders measure how far the current price of the stock is from this level. This distance is calculated in terms of percentage.
Distance from Pivot R2 Filter Settings
The settings of each Trade Ideas filter are defined in the Window Specific Filters Tab located in the Configuration Window of your Alert/Top List Window.
Here is how to setup the filter in your configuration window:
- To find stocks above their second resistance line, set the min above pivot R2 to 0. These are stocks which are doing extremely well compared to yesterday.
Using the Distance from Pivot R2 Filter
Several trading strategies can be employed with the Distance from Pivot R2 filter. Here are a few examples:
Breakout Trading Strategy: Traders can use the distance from R2 to anticipate potential breakout opportunities. If the stock price is nearing or above R2, it could signal a breakout to higher levels. In this case, traders may initiate long positions with appropriate risk management techniques, aiming to capitalize on the upward momentum.
Reversal Trading Strategy: Conversely, if the stock price is significantly below R2, it may indicate overbought conditions or strong resistance. Traders could use this as a signal for a potential reversal. They might initiate short positions or wait for confirmation signals such as bearish candlestick patterns or divergence in other indicators.
Trend Confirmation Strategy: Traders may use the distance from R2 as a confirmation signal for the prevailing trend. If the stock price is consistently staying above R2 during an uptrend or below R2 during a downtrend, it could reinforce the strength of the trend. Traders may enter positions in the direction of the trend, aiming to ride the trend until signs of exhaustion appear.
Range-Bound Trading Strategy: In sideways or range-bound markets, traders can use the distance from R2 to identify potential reversal points. If the stock price approaches R2 but fails to break above it convincingly, it could signal a reversal back towards lower levels of the range. Traders may initiate short positions with a target towards the lower end of the range and a stop-loss above R2.
FAQs
What is the significance of R2 in pivot points?
- R2 represents the second resistance level calculated from pivot points. It's significant because it often acts as a strong barrier to further price appreciation. Traders pay close attention to R2 as it indicates a potential area where selling pressure may intensify.
How is the distance from R2 calculated?
- The distance from R2 can be calculated as the absolute difference between the current stock price and the R2 level. Alternatively, it can be expressed as a percentage of the distance between the pivot point (P) and R2.
What does it mean if a stock's price is close to R2?
- When a stock's price is close to R2, it suggests that the stock has rallied significantly and may encounter resistance at this level. Traders interpret this proximity as a potential signal of overbought conditions or a forthcoming reversal unless the stock can convincingly break above R2.
Is the distance from R2 filter effective in all market conditions?
- The effectiveness of the distance from R2 filter may vary depending on market conditions. It's more reliable in stable markets where pivot points hold significance. However, during highly volatile or trending markets, traders may need to adjust their interpretation of the filter's signals.
Filter Info for Distance From Pivot R2 [PivotR2]
- description = Distance from Pivot R2
- keywords = Single Print Support and Resistance
- units = %
- format = 1
- toplistable = 1
- parent_code =
 Distance from Pivot R1 [PivotR1]
 Distance from Pivot [Pivot]
 Distance from Pivot S1 [PivotS1]
 Distance from Pivot S2 [PivotS2]