


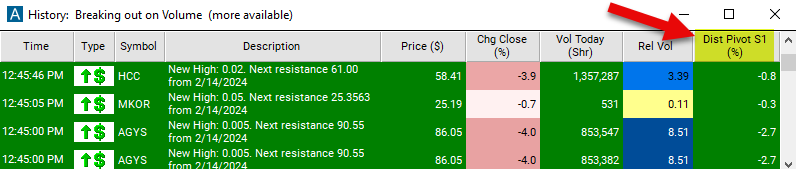
Distance From Pivot S1
Table of Contents
- Understanding the Distance from Pivot S1 Filter
- Distance from Pivot S1 Filter Settings
- Using the Distance from Pivot S1 Filter
- FAQs
Understanding the Distance from Pivot S1 Filter
The Distance from Pivot S1 filter in stock trading is a technical analysis tool used by traders to gauge how far a stock's current price is from the first support level (S1) calculated from pivot points. Pivot points are significant price levels derived from the previous day's high, low, and close prices, and they help traders identify potential areas of support and resistance.
Here's how the distance from pivot S1 filter works:
Calculation of Pivot Points: Pivot points are calculated based on the previous day's high, low, and close prices. The pivot point itself is the average of these three prices. Support and resistance levels are then calculated around the pivot point. Here are the formulas to caculate those specific points:
- Resistance 2 = Pivot + (R1 - S1)
- Resistance 1 = 2 * Pivot - Low
- Pivot Point = (High + Close + Low) / 3
- Support 1 = 2 * Pivot - High
- Support 2 = Pivot - (R1 - S1)
Identification of Support Level S1: S1 (the first support level) is one of the support levels calculated from pivot points. It is derived using the following formula: 2 * Pivot - High
Measurement of Distance: Once S1 is calculated, traders measure how far the current price of the stock is from this level. The distance can be calculated as the absolute difference between the current price and S1 or as a percentage of the range between the pivot point and S1.
Application in Trading Strategies: Traders use the distance from pivot S1 filter to make trading decisions. For example:
- If the price is significantly above S1, it may indicate bullish sentiment, and traders may look for buying opportunities.
- Conversely, if the price is below S1, it may suggest bearish sentiment, and traders may consider short-selling or exiting long positions.
Distance from Pivot S1 Filter Settings
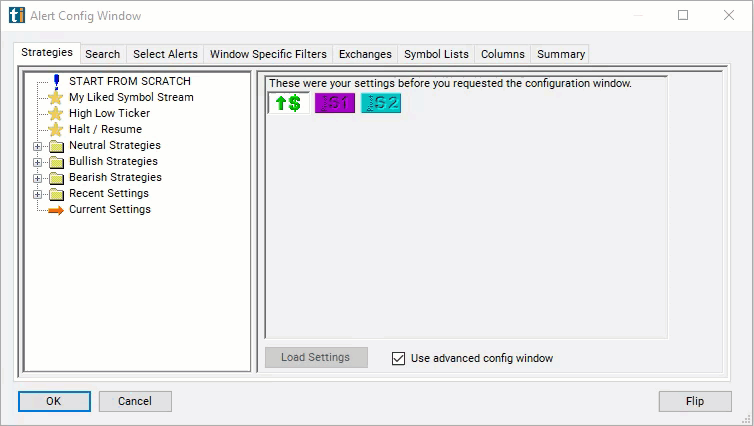
The settings of each Trade Ideas filter are defined in the Window Specific Filters Tab located in the Configuration Window of your Alert/Top List Window.
Here is how to setup the filter in your configuration window:
To find stocks between their first and second support lines, set the max above pivot S1 to 0 and the min above pivot S2 to 0. This will show stocks which have dropped some since yesterday, but not too much.
Using the Distance from Pivot S1 Filter
Several trading strategies can be employed with the Distance from Pivot S1 filter. Here are a few examples:
Support Reversal Strategy: Traders look for reversal signals near the S1 support level combined with confirmation from the distance from pivot S1 filter. When the price approaches the S1 support level and the distance from pivot S1 indicates oversold conditions, traders may anticipate a potential reversal. They may look for bullish reversal patterns, such as bullish engulfing or hammer candles, near S1 to confirm the reversal signal. Traders can then enter long positions, expecting the price to bounce off the support level and move higher.
Breakout Confirmation Strategy: Traders use the distance from pivot S1 filter to confirm breakout trades above the S1 support level. When the price breaks above the S1 support level, traders may wait for confirmation from the distance from pivot S1 filter indicating bullish sentiment. If the distance from pivot S1 suggests significant bullish momentum, traders may consider entering long positions, expecting the breakout to continue. They can set their stop-loss orders below the breakout level to manage risk.
Trend Continuation Strategy: Traders use the distance from pivot S1 filter to confirm the continuation of an existing uptrend. In an uptrend, when the price pulls back to test the S1 support level, traders may assess the distance from pivot S1 to confirm bullish sentiment. If the distance from pivot S1 suggests that the pullback is within normal range and there are no signs of a trend reversal, traders may consider adding to their long positions or entering new long positions near the S1 level, expecting the uptrend to continue.
FAQs
What is the significance of the S1 pivot point level?
- S1 represents the first support level calculated from pivot points. It is significant because it often acts as a level where buying interest may emerge, potentially halting downward price movements.
What does it indicate if a stock's price is close to the S1 level?
- If the stock's price approaches the S1 support level, it may indicate potential buying interest or a bounce in price. Traders may interpret this proximity as a signal of potential support or a reversal in price direction.
Can the distance from pivot S1 filter be applied to different timeframes?
- Yes, the distance from pivot S1 filter can be applied across various timeframes, including intraday, daily, weekly, or monthly charts. Traders should adjust their analysis and interpretation based on the timeframe they're trading.
Can the distance from pivot S1 filter be combined with other technical indicators?
- Yes, traders often combine the distance from pivot S1 filter with other technical indicators, such as moving averages, oscillators, or trendlines, to enhance their trading strategies and confirm signals.
Filter Info for Distance From Pivot S1 [PivotS1]
- description = Distance from Pivot S1
- keywords = Single Print Support and Resistance
- units = %
- format = 1
- toplistable = 1
- parent_code = PivotR2