


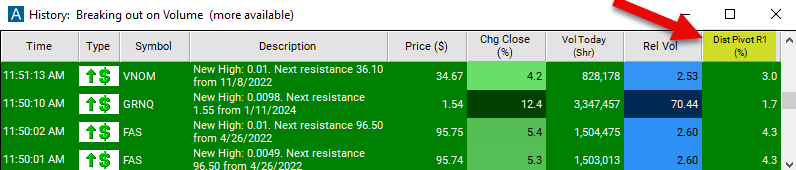
Distance From Pivot R1
Table of Contents
- Understanding the Distance from Pivot R1 Filter
- Distance from Pivot R1 Filter Settings
- Using the Distance from Pivot R1 Filter
- FAQs
Understanding the Distance from Pivot R1 Filter
This distance from pivot filter specifically refers to a strategy where traders look at how far a stock's current price is from a pivot point level, particularly the R1 level. R1 represents the first resistance level calculated from the pivot points formula.
Here's how it works:
Calculate Pivot Points: The first step is to calculate pivot points. This involves determining a pivot point (P) as well as support (S1, S2, etc.) and resistance (R1, R2, etc.) levels based on the previous day's price action. Here are the formulas to caculate those specific points:
- Resistance 2 = Pivot + (R1 - S1)
- Resistance 1 = 2 * Pivot - Low
- Pivot Point = (High + Close + Low) / 3
- Support 1 = 2 * Pivot - High
- Support 2 = Pivot - (R1 - S1)
These are all based on the previous day's high, low, and close:
Identify R1: R1 is the first resistance level calculated in the pivot points formula. It represents a level above which the price may face selling pressure.
Calculate Distance from R1: Once R1 is identified, traders measure how far the current price of the stock is from this level. This distance is calculated in terms of percentage.
Distance from Pivot R1 Filter Settings
The settings of each Trade Ideas filter are defined in the Window Specific Filters Tab located in the Configuration Window of your Alert/Top List Window.
Here is how to setup the filter in your configuration window:
- To find stocks above their first resistance line, set the min above pivot R1 to 0. These are stocks which are doing well compared to yesterday.
Using the Distance from Pivot R1 Filter
Several trading strategies can be employed with the Distance from Pivot R1 filter. Here are a few examples:
Breakout Trading: Buying when the price breaks above R1, anticipating further upward movement.
Reversal Trading: Selling short or exiting long positions when the price approaches R1, expecting a reversal.
Trend Confirmation: Confirming the strength of an uptrend if the price remains above R1 or the weakness of a downtrend if it struggles to break through R1.
FAQs
What is the significance of R1 in pivot points?
- R1 represents the first resistance level calculated from pivot points. It is significant because it often acts as a barrier to further upward price movement. Traders pay attention to R1 as it can indicate potential areas of selling pressure.
How is the distance from R1 calculated?
- The distance from R1 is calculated as the absolute difference between the current stock price and the R1 level. This difference can also be expressed as a percentage of the range between the pivot point (P) and R1.
What does it mean if a stock's price is close to R1?
- When a stock's price approaches R1, it suggests that the stock may encounter resistance at this level. Traders interpret this proximity as a potential signal of overbought conditions or a possible reversal in price.
Filter Info for Distance From Pivot R1 [PivotR1]
- description = Distance from Pivot R1
- keywords = Single Print Support and Resistance
- units = %
- format = 1
- toplistable = 1
- parent_code = PivotR2