


Position in Bollinger Bands (Daily)
Table of Contents
- Understanding the Position in Bollinger Bands Daily Filter
- Position in Bollinger Bands Daily Filter Settings
- Using the Position in Bollinger Bands Daily Filter
- FAQs
Understanding the Position in Bollinger Bands Daily Filter
The "Position in Bollinger Bands (Daily) Filter" in stock trading is a technical analysis tool that assesses where the current price of a stock lies relative to its Bollinger Bands over a 24-hour timeframe. Bollinger Bands consist of three lines: the middle band, which is a simple moving average, and the upper and lower bands, which are typically set two standard deviations away from the middle band.
Here's an explanation of how this filter works:
Calculation: The position of the current price relative to the Bollinger Bands is calculated by comparing the current price to the upper and lower bands.
Interpretation: Traders interpret the position of the price within the Bollinger Bands to assess potential buying or selling opportunities. If the price is near the upper band, it may signal an overbought condition and a potential opportunity to sell or short the stock. If the price is near the lower band, it may indicate an oversold condition and a potential opportunity to buy or go long on the stock.
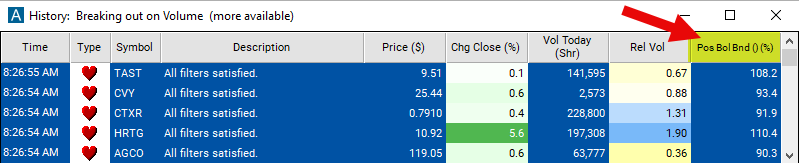
This filter compares the price of the last print to the 20 period Bollinger Bands. This corresponds to the "%b" formula found at http://www.bollingerbands.com/. 0 means that the last print touches the lower Bollinger Band, 100 means the last print touches the upper Bollinger Band. Values can be can be higher, lower, or in between 0 and 100.
This filter is similar to the three pairs of position in range filters above. The difference is that this filter uses statistical analysis to determine the top and bottom of the ranges. The previous filters use an absolute high and low, possibly only two prints, to set the range.
Position in Bollinger Bands Daily Filter Settings
The settings of each Trade Ideas filter are defined in the Window Specific Filters Tab located in the Configuration Window of your Alert/Top List Window.
Here is how to setup the filter in your configuration window:
- Set the min value to 90 to see stocks which are overbought on the 24-hour time frame.
Using the Position in Bollinger Bands Daily Filter
Several trading strategies can be employed with the Position in Bollinger Bands Daily filter. Here are a few examples:
Mean Reversion: Trade reversions to the mean when the price moves beyond the Bollinger Bands. Enter short positions when the price touches or crosses above the upper Bollinger Band, anticipating a pullback towards the middle band. Enter long positions when the price touches or crosses below the lower Bollinger Band, anticipating a bounce back towards the middle band.
Trend Following: Trade in the direction of the trend when the price remains within the Bollinger Bands. In an uptrend, buy when the price bounces off the lower Bollinger Band and continues upward. In a downtrend, sell short when the price bounces off the upper Bollinger Band and continues downward.
Breakout Trading: Trade breakouts when the price moves outside the Bollinger Bands. Buy when the price breaks above the upper Bollinger Band, anticipating a continuation of the uptrend. Sell short when the price breaks below the lower Bollinger Band, anticipating a continuation of the downtrend.
FAQs
What does the "Position in Bollinger Bands Daily Filter" indicate?
- The "Position in Bollinger Bands Daily Filter" reflects the current position of the price relative to the Bollinger Bands over a daily timeframe. It helps traders gauge whether the price is trading near the upper band (potentially overbought) or the lower band (potentially oversold) within a daily trading session.
How does the Position in Bollinger Bands Daily Filter differ from other timeframes?
- Unlike shorter timeframes, such as the 5-minute or 15-minute intervals, the daily filter provides insights into price movements over a longer period, capturing the overall sentiment and trend for the trading day.
What trading strategies are suitable for the Position in Bollinger Bands Daily Filter?
- Traders can employ various strategies, including trend following, mean reversion, breakout trading, or volatility trading, based on signals generated by this filter, aligning with their trading objectives and time horizon.
Filter Info for Position in Bollinger Bands (Daily) [Boll]
- description = Position in Bollinger Bands (Daily)
- keywords =
- units = %
- format = 1
- toplistable = 1
- parent_code = Boll5