
Light Mode

Overbought and oversold stocks on every timeframe, refreshed as prices move.
Filter and sort any scan by live RSI on 1, 2, 5, 15 and 60-minute charts, or daily.
Free account, just an email. No card. Live access for a limited time.

Named to the Inc. 5000 list of America’s fastest-growing private companies six years in a row (2017–2022).

Investopedia: Best Short Term Stock Screener, 2024
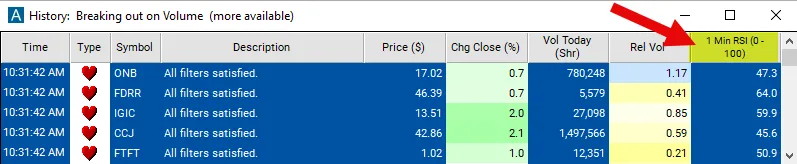
RSI runs from 0 to 100. Under 30 is usually called oversold, over 70 overbought. In Trade Ideas, RSI is a filter you add to any Top List (Screener) or alert window, so you see it live on every stock.
Top Lists also run in the Web Dashboard, right in your browser. Streaming Alerts (Scanner) run in TI Pro, our desktop app for Windows (on a Mac, through Parallels).
Stocks that have moved far in one direction, fast. RSI compares recent up moves to recent down moves. A high reading means mostly up lately; a low reading means mostly down.
An RSI scanner sorts the market by that number so you can see the most stretched names on the timeframe you trade.
One thing to know: Trade Ideas has RSI as filters, not alerts. There is no "RSI crossed 30" alert. You filter and sort any scan by live RSI, and use the Stochastic alerts below when you want an event.
| Filter | What it shows |
|---|---|
| RSI (1 min) (RSI1) | 1 minute RSI. Max 30 = oversold, min 70 = overbought. |
| RSI (2 min) (RSI2) | 2 minute RSI. |
| RSI (5 min) (RSI5) | 5 minute RSI, a common day-trade setting. |
| RSI (15 min) (RSI15) | 15 minute RSI. |
| RSI (60 min) (RSI60) | 60 minute RSI. |
| Daily RSI (DRSI) | Daily RSI. Max 30 finds oversold, min 70 overbought. |
Set Daily RSI (DRSI) to a max of 30 for stocks oversold on the daily chart. For intraday, use RSI (5 min) (RSI5) or RSI (15 min) (RSI15) at a max of 30.
Oversold alone is not a reason to buy. Add Relative Volume (RV) so the stock is active, and look for a turn: a green bar reversal, a Stochastic cross up, or a reclaim of VWAP.
Set the RSI filter to a min of 70. On the daily chart, strong stocks can stay above 70 for a long time, so overbought is better read as "strong and stretched" than "about to drop."
Many traders use overbought lists to find leaders, and only short when price also breaks down.
Stochastic is another 0 to 100 reading of where price sits in its recent range. Trade Ideas has it as alerts, so you hear about the turn when it happens.
| Alert | What it does |
|---|---|
| 5 Minute Stochastic Crossed Above 20 (SC20_5) | Stochastic crosses above 20 on 5 minute bars, leaving oversold. |
| 15 Minute Stochastic Crossed Above 20 (SC20_15) | The same on 15 minute bars. |
| 60 Minute Stochastic Crossed Above 20 (SC20_60) | The same on 60 minute bars. |
| 5 Minute Stochastic Crossed Below 80 (SC80_5) | Stochastic crosses below 80 on 5 minute bars, leaving overbought. |
| 15 Minute Stochastic Crossed Below 80 (SC80_15) | The same on 15 minute bars. |
| 60 Minute Stochastic Crossed Below 80 (SC80_60) | The same on 60 minute bars. |
A common setup: an RSI filter at a max of 30 on the alert window, with SC20_15 turned on. You hear only about oversold stocks that are starting to turn.
Pullbacks in trends. Daily RSI dipping toward 40 in a stock above its 50-day average.
Fades. Intraday RSI above 80 on a stock with no news.
Confirmation. RSI turning up alongside a MACD cross. See the MACD scanner.
Those screeners run an RSI rule on demand. Trade Ideas keeps RSI live on every stock as a filter, and Top Lists update every 15 seconds.
RSI compares the size of recent up moves to recent down moves over a set number of bars, most often 14. The result is scaled from 0 to 100.
If a stock closed higher on most recent bars, RSI is high. If it closed lower, RSI is low. It says nothing about why, and nothing about what comes next.
1 and 2 minute RSI swing between extremes many times a day; they help time an entry on a stock you already like.
5 and 15 minute RSI suit most day traders. 60 minute RSI shows the trend across the day. Daily RSI is for swing traders and investors.
A stock can be overbought on 5 minutes and oversold on the daily chart at the same time. Pick the one that matches how long you hold.
Divergence means price makes a new high but RSI does not, or the reverse at lows. Trade Ideas does not have a divergence alert. Traders approximate it by watching new high alerts on stocks whose RSI filter is under 60, a stock making new highs with weakening momentum.
RSI measures the size of up moves against down moves. Stochastic measures where today's price sits in the recent high-low range. They often agree, but Stochastic turns faster.
In Trade Ideas, RSI is a filter and Stochastic is an alert, so they fit together: RSI to choose the stocks, Stochastic to time the turn.
In a strong uptrend, RSI can stay above 70 for days and dips to 40 or 50 are the buying spots. In a downtrend, RSI can stay under 30 and bounces to 60 are where sellers return. Many traders shift their RSI levels to match the trend instead of using 30 and 70 every time.
Small, fast stocks hit extreme RSI readings often. Add Dollar Volume (DV) and Spread (Spread) so the list is tradable, and see the penny stock scanner.
Oversold on 15 minute bars
| Alert or filter | Setting |
|---|---|
| RSI (15 min) (RSI15) | Max 25. |
| 15 Minute Stochastic Crossed Above 20 (SC20_15) | On. Stochastic turns up through 20. |
| Change From 200 Day SMA (%) (MA200P) | Min 0, so the bigger trend is up. |
| Dollar Volume (DV) | Min $5 million. |
Overbought for shorts
| Alert or filter | Setting |
|---|---|
| RSI (15 min) (RSI15) | Min 75. |
| 5 Minute Stochastic Crossed Below 80 (SC80_5) | On. The 5 minute Stochastic turning down through 80, for an earlier exit signal. |
| Change From The Close (%) (FCP) | Min 4. |
Daily RSI pullback for swing trades
| Alert or filter | Setting |
|---|---|
| Daily RSI (DRSI) | Between 30 and 40. |
| Change From 50 Day SMA (%) (MA50P) | Min 0. |
| Change (5 day, %) (U5DP) | Max -5, down 5% or more over 5 days. |
| Alert or filter | What it does |
|---|---|
| RSI (1 min) (RSI1) | 1 minute RSI. Very jumpy. |
| RSI (2 min) (RSI2) | 2 minute RSI. |
| RSI (5 min) (RSI5) | 5 minute RSI. Common for day trades. |
| RSI (15 min) (RSI15) | 15 minute RSI. |
| RSI (60 min) (RSI60) | 60 minute RSI. For multi-day trades. |
| Daily RSI (DRSI) | Daily RSI. For swing trades. |
RSI tells you a state: this stock is oversold right now. A state can last hours. The Stochastic cross alerts tell you an event: it was oversold and just turned. Traders use the RSI filter to pick which stocks to watch and the Stochastic alert to know when one of them moves.
Example numbers, not a real trade
70 and 30 are the textbook levels. On fast small caps, RSI can stay above 80 for an hour. Many traders use 80 and 20 there. On slow large caps, 65 and 35 may be the most it reaches all day.
| Filter | Overbought | Oversold | Notes |
|---|---|---|---|
| RSI (1 min) (RSI1) | Min 85 | Max 15 | Extreme levels only; 1 minute RSI swings hard. |
| RSI (5 min) (RSI5) | Min 80 | Max 20 | Common for scalps after the open. |
| RSI (15 min) (RSI15) | Min 75 | Max 25 | A balance of speed and noise. |
| RSI (60 min) (RSI60) | Min 70 | Max 30 | Textbook levels work here. |
| Daily RSI (DRSI) | Min 70 | Max 30 | Swing trades over days. |
These are starting points, not rules. Raise the bar on fast stocks and lower it on slow ones.
Divergence is when price makes a new low but RSI makes a higher low, or the reverse at a high. Trade Ideas has no divergence alert or filter, so you check this on the chart. A practical way: run the oversold window, open the chart when an alert fires, and look at the last two lows on price and on RSI. If RSI held a higher low, you have divergence.
Oversold bounce
| Alert or filter | Setting |
|---|---|
| RSI (15 min) (RSI15) | Max 30. |
| Change From 50 Day SMA (%) (MA50P) | Min 0, above the 50 day. |
| 60 Minute Stochastic Crossed Above 20 (SC20_60) | On. The 60 minute Stochastic cross is the slower trigger here. |
| 15 Minute Green Bar Reversal (GBR15) | On, for a green bar reversal on the same bars. |
| Smart Stop (%) (SmartStopP) | Use the value as your stop distance. |
An oversold reading on normal volume is a stock drifting lower. The same reading on Relative Volume (RV) above 2 means heavy selling, which can end in a sharp snap back or keep going. Many traders look for the volume to fade before the Stochastic trigger fires.
The RSI filter picks the stocks; the Stochastic alert on the same bar length tells you when one turns. Matching the two timeframes keeps the signal consistent.
| Timeframe | Pick with | Trigger with | Who uses it |
|---|---|---|---|
| 5 minute | RSI (5 min) max 20 | 5 Minute Stochastic Crossed Above 20 | Scalpers in the first two hours. |
| 15 minute | RSI (15 min) max 25 | 15 Minute Stochastic Crossed Above 20 | Day traders holding for an hour or two. |
| 60 minute | RSI (60 min) max 30 | 60 Minute Stochastic Crossed Above 20 | Traders holding into the next day. |
| Daily | Daily RSI max 30 | Crossed Daily Highs Resistance on a cross of the prior day’s high | Swing traders. |
For shorts, flip it: RSI above 70 to 80 and the Stochastic crossed below 80 alerts on the same bar length.
Example numbers, not a real trade
In a strong uptrend, RSI can stay above 70 for days. Shorting just because of the number is one of the most common RSI mistakes. Many traders use overbought readings to tighten stops on longs instead, or wait for the Stochastic cross below 80 and a break of a level such as VWAP before thinking about a short.
A stock that gaps down 8% opens with RSI already deep in oversold territory on short bars. The reading is real but tells you little, because the gap did the damage before the session began. Many traders ignore intraday RSI for the first 30 minutes on gap days, using Time Of Day (Time) with a min of 30.
An oversold reading at a level carries more weight. Pair the oversold window with Position in Previous Day's Range (RPD) at a max of 10 to see oversold stocks sitting near yesterday’s low, or with Change From 200 Day SMA (%) (MA200P) between -1 and 1 for stocks testing the 200 day.
Oversold can get more oversold. In a strong downtrend, RSI can sit under 30 for days.
1 minute RSI swings constantly. Use it for timing, not for picking.
Test your rules in a simulated account first.
Free account, just an email. No card. Live access for a limited time.
Plain answers to what traders search for.
A scanner that shows stocks by their RSI reading so you can find overbought and oversold names. In Trade Ideas, RSI is a live filter on 1, 2, 5, 15, 60 minute and daily charts.
No. RSI is a filter. For event alerts, use the Stochastic Crossed Above 20 and Below 80 alerts.
Set Daily RSI (DRSI) or an intraday RSI filter to a max of 30 and sort low to high.
Top Lists (Screeners) run in the Web Dashboard in a browser. Streaming Alerts run in TI Pro on Windows, or on a Mac through Parallels.
Many traders use 30 and 70. Some use 20 and 80 for stronger readings.
You can try it with a free account, just an email, no card. Live access is for a limited time, then it is part of a paid plan.
RSI compares up moves to down moves. Stochastic shows where price sits in its recent range. In Trade Ideas, RSI is a filter and Stochastic is an alert.
Past results, including backtests, don't guarantee future results.
Free account, just an email. No card. Live access for a limited time. Ready to buy? See plans & pricing

