


1 Minute RSI
Table of Contents
- Understanding the 1 Minute RSI Filter
- 1 Minute RSI Filter Settings
- Using the 1 Minute RSI Filter
- FAQs
Understanding the 1 Minute RSI Filter
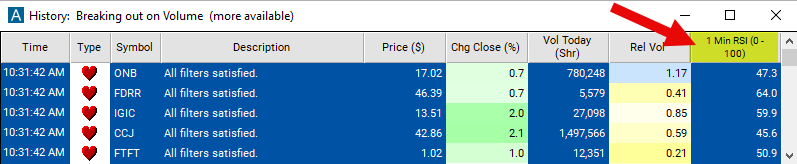
The 1-minute Relative Strength Index (RSI) filter is a technical analysis tool used to assess the current momentum of a stock over a short timeframe, in this case a 1-minute chart. RSI is a momentum oscillator that measures the speed and change of price movements. It oscillates between 0 and 100 and is calculated using the average gain and average loss over 14 periods.
Here's how the 1-minute RSI filter works:
Calculation: The 1-minute RSI is calculated based on the price movements of the stock over the last 1-minute period. It compares the magnitude of recent gains and losses to determine whether the stock is overbought or oversold.
Interpretation: An RSI value above 70 typically indicates that the stock is overbought, suggesting that it may be due for a pullback or reversal. Conversely, an RSI value below 30 indicates that the stock is oversold, suggesting that it may be poised for a bounce or recovery.
This filter does not use pre- or post-market data.
1 Minute RSI Filter Settings
The settings of each Trade Ideas filter are defined in the Window Specific Filters Tab located in the Configuration Window of your Alert/Top List Window.
Here is how to setup the filter in your configuration window:
- Set the min 1 minute RSI to 30 and the max to 70 to find stocks which are neither overbought nor oversold on a 1 minute time frame.
Using the 1 Minute RSI Filter
Several trading strategies can be employed with the 1 Minute RSI filter. Here are a few examples:
Overbought/Oversold Signals: Traders look for extreme RSI readings, such as RSI above 70 indicating overbought conditions or RSI below 30 indicating oversold conditions. When RSI crosses above 70, traders may consider shorting or selling the stock, anticipating a pullback. Conversely, when RSI crosses below 30, traders may consider buying or going long on the stock, anticipating a rebound.
RSI Divergence: Traders look for divergences between price action and RSI readings. If the price is making new highs while the RSI is failing to confirm these highs (making lower highs), it could signal potential weakness in the trend, and traders may consider taking a contrarian position.
RSI Centerline Crosses: Traders monitor RSI crosses of the centerline (50). When RSI crosses above 50, it suggests increasing buying pressure, and traders may consider going long. Conversely, when RSI crosses below 50, it indicates increasing selling pressure, and traders may consider shorting or selling the stock.
FAQs
What is the 1-minute RSI and how is it calculated?
- The 1-minute RSI is a technical indicator that measures the speed and change of price movements over a 1-minute timeframe. It's calculated using the average gain and average loss over the last 1-minute period. The formula involves dividing the average gain by the average loss and converting it to an index that oscillates between 0 and 100.
How do I interpret overbought and oversold conditions on the 1-minute RSI?
- RSI levels above 70 are considered overbought, indicating that the stock may be due for a pullback or reversal. Conversely, RSI levels below 30 are considered oversold, suggesting that the stock may be poised for a bounce or recovery.
Can the 1-minute RSI be used for day trading or scalping?
- Yes, the 1-minute RSI can be used for day trading or scalping strategies, as it provides insights into short-term momentum and price fluctuations. Traders often use it to identify intraday trading opportunities and make quick decisions based on rapid price movements.
How should I incorporate the 1-minute RSI into my trading strategy?
- Traders can incorporate the 1-minute RSI into their trading strategy by using it to identify overbought or oversold conditions, divergence patterns, trend reversals, and potential entry or exit points. It's crucial to combine the 1-minute RSI with other technical indicators and analysis techniques for a comprehensive trading approach.
Filter Info for 1 Minute RSI [RSI1]
- description = 1 Minute RSI
- keywords = Fixed Time Frame
- units = 0 - 100
- format = 1
- toplistable = 1
- parent_code =
 2 Minute RSI [RSI2]
 5 Minute RSI [RSI5]
 15 Minute RSI [RSI15]
 60 Minute RSI [RSI60]