


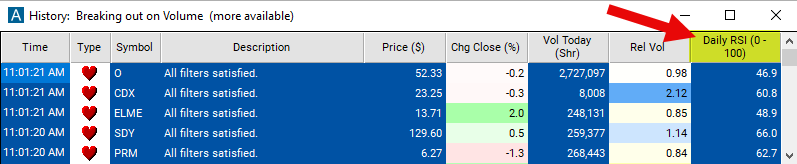
Daily RSI
Table of Contents
Understanding the Daily RSI Filter
The daily Relative Strength Index (RSI) filter is a technical indicator used to assess the momentum of a stock's price movements over a daily timeframe. RSI is a momentum oscillator that measures the magnitude and velocity of price changes. It oscillates between 0 and 100 and is typically calculated using the average gain and average loss over 14 periods.
Here's how the daily RSI filter works:
Calculation: The daily RSI is calculated based on the price movements of the stock over the last trading day (daily timeframe). It compares the magnitude of recent gains and losses to determine whether the stock is overbought or oversold.
Interpretation: An RSI value above 70 typically indicates that the stock is overbought, suggesting that it may be due for a pullback or reversal. Conversely, an RSI value below 30 indicates that the stock is oversold, suggesting that it may be poised for a bounce or recovery.
These filters are only available for stocks with sufficient history; if we do not have at least 14 days of history, the server will not report an RSI for that stock.
Daily RSI Filter Settings
The settings of each Trade Ideas filter are defined in the Window Specific Filters Tab located in the Configuration Window of your Alert/Top List Window.
Here is how to setup the filter in your configuration window:
-
Set the min daily RSI to 70 and the max RSI to 30 to see stocks which are either overbought or oversold.
-
Set the min daily RSI to 30 and the max RSI to 70 to see stocks which are neither overbought nor oversold.
Using the Daily RSI Filter
Several trading strategies can be employed with the Daily RSI filter. Here are a few examples:
Overbought/Oversold Conditions: Identify overbought and oversold conditions using RSI levels above 70 (overbought) and below 30 (oversold). Sell or short the stock when RSI crosses above 70, indicating overbought conditions, and buy or go long when RSI crosses below 30, indicating oversold conditions. Traders aim to capitalize on potential reversals in price direction.
RSI Divergence: Look for divergence between price action and RSI readings. If the price is making new highs while the RSI is failing to confirm these highs (making lower highs), it could signal potential weakness in the trend. Traders may consider selling or shorting the stock in anticipation of a reversal.
RSI Centerline Crosses: Monitor RSI crosses of the centerline (50). When RSI crosses above 50, it suggests increasing buying pressure, and traders may consider going long. Conversely, when RSI crosses below 50, it indicates increasing selling pressure, and traders may consider shorting or selling the stock.
Trend Confirmation: Use RSI to confirm the direction of the prevailing trend. In an uptrend, RSI tends to remain above 50, and in a downtrend, it tends to stay below 50. Traders may look for opportunities to buy on pullbacks when RSI remains above 50 in an uptrend and sell on rallies when RSI stays below 50 in a downtrend.
FAQs
What is the daily RSI, and how is it calculated?
- The daily RSI is a technical indicator that measures the magnitude and velocity of price changes in a stock over a daily timeframe. It's calculated using the average gain and average loss over a lookback period of 14 days.
How do I interpret RSI readings?
- RSI readings above 70 are considered overbought, suggesting that the stock may be due for a pullback. Readings below 30 are considered oversold, indicating that the stock may be poised for a rebound. Traders interpret RSI levels in conjunction with other technical indicators and price action.
Can the daily RSI be used for all types of stocks?
- Yes, the daily RSI can be applied to various types of stocks, including large-cap, mid-cap, and small-cap stocks. However, traders should consider the liquidity and volatility of the stock when interpreting RSI signals.
How should I incorporate the daily RSI into my trading strategy?
- Traders can use the daily RSI to identify potential entry and exit points, confirm trends, and manage risk. It's crucial to combine RSI signals with other technical indicators, price patterns, and fundamental analysis to make well-informed trading decisions.
Filter Info for Daily RSI [DRSI]
- description = Daily RSI
- keywords = Changes Daily
- units = 0 - 100
- format = 1
- toplistable = 1
- parent_code =