
Light Mode

Coiled stocks found before the move, and the breakout flagged the second it fires.
Find stocks whose range keeps shrinking, then get the alert when price leaves the box.
Free account, just an email. No card. Live access for a limited time.

Named to the Inc. 5000 list of America’s fastest-growing private companies six years in a row (2017–2022).

Investopedia: Best Short Term Stock Screener, 2024
A squeeze is a stock gone quiet: the range shrinks, the bands pull in, and volume dries up. Trade Ideas finds those stocks with filters, then streams the breakout.
Streaming Alerts (Scanner) run in TI Pro, our desktop app for Windows (on a Mac, through Parallels). Looking for short squeezes instead? See high short float stocks.
Stocks that have stopped moving much. Day after day the range gets smaller, the Bollinger Bands pinch in, and the chart turns into a tight box.
Traders watch these because a long quiet stretch often ends with a bigger move. The scan does not know which way it will go. It tells you which stocks are coiled, and then tells you when one starts to move.
This page is about volatility squeezes. If you came for short squeezes, where heavy short interest meets a rising price, see high short float stocks.
| Alert or filter | What it does |
|---|---|
| Range Contraction (RC) | Days in a row the daily range has shrunk. A min of 3 finds three or more tighter days. |
| Consolidation (ConDays) | Days in a tight consolidation on the daily chart. Min 7 is a strong one. |
| Position in Consolidation (RCon) | Where price sits inside the consolidation. Above 100 means it broke out the top. |
| Position in Bollinger Bands (Daily) (Boll) | Daily Bollinger band position, 0 to 100. |
| Position in Bollinger Bands (5 min) (Boll5) | 5 minute band position, for intraday coils. |
| Position in Bollinger Bands (15 min) (Boll15) | 15 minute band position. |
| Standard Deviation (BB) | Today's move in standard deviations. |
| Average True Range (ATR) | Average True Range in dollars. Low ATR on a stock that used to move is a quiet stock. |
| NR7 (15 Minute) (NR7) | Narrowest bar of the last seven, 15 minute. |
| NR7 (5 Minute) (NR7_5) | The same on a 5 minute chart. Also counts back-to-back NR7 bars. |
| 5 Minute Consolidation Breakout (CBO5) | Price breaks out of a 5 minute consolidation. |
| 15 Minute Consolidation Breakout (CBO15) | Breakout from a 15 minute consolidation. |
| Channel Breakout (CHBO) | Price breaks out of its channel. |
| Standard Deviation Breakout (BBU) | Move of one standard deviation or more above the prior close. |
| Standard Deviation Breakdown (BBD) | The same to the downside. |
Some traders use a squeeze rule where the Bollinger Bands slip inside a Keltner-style channel. Trade Ideas has no built-in indicator for that, and it does not claim one. What you can do is build a daily version yourself in the Formula Editor, using values the editor already exposes.
Here is one way to write it. It compares two standard deviations of price to one and a half times the Average True Range:
2*std_20 < 1.5*[ATR]When the formula is true, the bands are tighter than the ATR-based channel, so the stock is coiled. Add it as a custom filter, then sort or filter on it like any other column.
This is a daily, approximate version built on simple averages and ATR. It is not the exact TTM-style indicator some charting apps show, and it has no momentum histogram. The Formula Editor is included in every TI Pro plan.
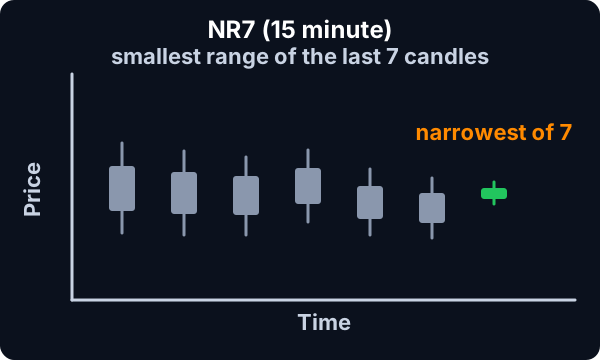
NR7 means the narrowest range of the last seven bars. It is one of the simplest squeeze signals, and Trade Ideas fires it live: NR7 (15 Minute) (NR7) on 15 minute bars, NR7 (5 Minute) (NR7_5) on 5 minute, NR7 (1 Minute) (NR7_1) on 1 minute, and more.
Back-to-back NR7 bars are counted too, so a stock printing its second or third narrow bar in a row stands out.
An NR7 is not a direction. It is a quiet bar. Many traders set a buy stop above it and a sell stop below it and let price choose.
Once you have a list of coiled stocks, the breakout alerts do the watching. 5 Minute Consolidation Breakout (CBO5) and 15 Minute Consolidation Breakout (CBO15) fire when price leaves a consolidation. Channel Breakout (CHBO) fires on a channel break. Standard Deviation Breakout (BBU) fires when the day's move reaches one standard deviation.
Put Relative Volume (RV) at 1.5 or more on the same window so a breakout on no volume stays quiet.
The Bollinger Band scanner page is about the indicator itself: where price sits in the bands, band breaks and stretched stocks. This page is about the setup: a stock going quiet, then breaking out. They share filters, and many traders run both.
Price does not move in a straight line, and it does not sit still for long. Stretches of small ranges tend to give way to bigger ones, and big ones tend to settle down again. A squeeze scan is a way to be early to the switch from quiet to busy.
It is a probability idea, not a promise. Some quiet stocks stay quiet, and some break the wrong way.
Intraday squeezes are the same idea on smaller bars. Position in Bollinger Bands (5 min) (Boll5) near 50 with NR7 (5 Minute) (NR7_5) firing is a stock coiling on the 5 minute chart. Consolidation (C) fires as a tight range forms intraday, and the consolidation breakout alerts fire as it ends.
Intraday squeezes resolve faster and smaller. They suit day trades more than swing trades.
Average True Range (ATR) is the average daily range in dollars over 14 days. It helps in two ways. A low ATR compared to the stock's usual helps confirm a quiet stretch. And ATR sizes your stop: a stock with a $1.20 ATR needs more room than one with $0.30.
The formula has two sides. 2*std_20 is two standard deviations of the last 20 days, the same width Bollinger Bands use on each side. 1.5*[ATR] is one and a half times the Average True Range, a stand-in for a Keltner-style channel width.
When the left side is smaller, the bands are inside the channel: the squeeze is "on." When the stock starts moving, the standard deviation grows and the formula turns false. Sorting by the gap between the two sides shows the tightest coils first.
Range Contraction (RC), Range Contraction, counts how many days in a row the daily range has shrunk. A value of 3 means three straight days, each narrower than the last. A max of -3 flips it to range expansion. Range (5 day, %) (Range5DP) gives the width of the last 5 days as a percent of price, without today; under 3% on a stock that normally moves more is a tight box.
Consolidation (C), the Consolidation alert, fires when a stock settles into a tight range as it forms. It uses volume-weighted statistics to pick the best time frame on its own, so you do not choose a bar length. It is a good first look at intraday squeezes before the breakout alerts take over.
Nothing in a squeeze tells you the direction. Traders look at clues outside it: the trend before the squeeze, where price sits inside the box, and what the market is doing. Many set alerts on both sides and let price decide.
Both-sides window
| Alert or filter | Setting |
|---|---|
| 15 Minute Consolidation Breakout (CBO15) | On. Breakout from a 15 minute consolidation. |
| 15 Minute Consolidation Breakdown (CBD15) | On. Breakdown. |
| Range Contraction (RC) | Min 3. |
| Relative Volume (RV) | Min 1.5. |
Example numbers, not a real trade
Squeezes often form before scheduled news, as traders wait. Earnings Date (EarningD) shows how many days until a stock reports. A squeeze that ends on earnings day can break hard in either direction.
Squeezes break both ways. The first move out of the box can fail and reverse.
Quiet stocks can stay quiet for weeks. A coil is a watchlist, not a trade.
Earnings dates often sit right after a long quiet stretch. Check the calendar.
Test your rules in a simulated account first.
Free account, just an email. No card. Live access for a limited time.
Plain answers to what traders search for.
A scanner that finds stocks whose range and volatility have contracted, then shows when price breaks out. Trade Ideas does it with Range Contraction, Consolidation and band filters, plus NR7 and breakout alerts.
No built-in one. You can build a daily, approximate squeeze rule in the Formula Editor, included in every TI Pro plan. The formula on this page is one way to write it.
Filter on Range Contraction (RC) or Consolidation (ConDays), and check the band position filters. The tighter the range, the tighter the bands.
A scan for the narrowest range of the last seven bars. NR7 (15 Minute) (NR7) and NR7 (5 Minute) (NR7_5) fire it live.
No. A short squeeze is about short interest. See high short float stocks for that.
You can try it with a free account, just an email, no card. Live access is for a limited time, then it is part of a paid plan.
The scan does not say. It shows the coil and the break. Many traders set orders on both sides and let price choose.
The formula on this page uses daily values. For intraday coils, use the NR7, Consolidation and band position alerts and filters.
Past results, including backtests, don't guarantee future results.
Free account, just an email. No card. Live access for a limited time. Ready to buy? See plans & pricing

