


Standard Deviation
Table of Contents
- Understanding the Standard Deviation Filter
- Standard Deviation Filter Settings
- Using the Standard Deviation Filter
- FAQs
Understanding the Standard Deviation Filter
The standard deviation filter is a tool used to measure the volatility or dispersion of a stock's price movement from its average price. Standard deviation is a statistical measure that quantifies the amount of variation or dispersion in a set of data points. When applied to stock prices, standard deviation helps traders assess the volatility of a stock's price over a certain period. A higher standard deviation indicates greater volatility, meaning the stock's price has experienced larger fluctuations over the chosen period. Conversely, a lower standard deviation suggests lower volatility, indicating relatively stable price movements.
This filter is similar to the Min / Max Up from the Close (Bars) filters. Both sets of filters compare the current stock price to the previous closing price. Both sets of filters use each stock’s volatility to normalize the data. The previous pair of filters uses our standard formula for intra-day volatility. This filter uses Bright Trading’s formula for daily volatility.
Standard Deviation Filter Settings
The settings of each Trade Ideas filter are defined in the Window Specific Filters Tab located in the Configuration Window of your Alert/Top List Window.
Here is how to setup the filter in your configuration window:
- Set the min value to -1 and the max value to 1 to see only stocks which have moved less since the previous close than the stock usually moves in a day. Or set the max to -3 and leave the min blank to see stocks which have moved down a significant amount since the close.
Using the Standard Deviation Filter
Several trading strategies can be employed with the Standard Deviation filter. Here are a few examples:
Bollinger Bands Strategy: Bollinger Bands incorporate standard deviation to create bands around a stock's moving average. Traders may enter long positions when the price touches the lower band (indicating oversold conditions) and short positions when the price touches the upper band (indicating overbought conditions).
Volatility Breakout Strategy: Traders may look for stocks with high standard deviations to identify periods of increased volatility. They may enter trades when the stock breaks out of its recent price range, expecting continued volatility in the same direction.
Range Trading: Traders may use standard deviation to identify overbought or oversold conditions within a range-bound market. When the price reaches extreme levels beyond the standard deviation bands, traders may anticipate a mean reversion and enter trades accordingly.
FAQs
What does the standard deviation filter measure?
- The standard deviation filter measures the volatility or dispersion of a stock's price movement from its average price over a specific period. It quantifies the amount of variation or fluctuation in the stock's price.
What does a high standard deviation indicate?
- A high standard deviation indicates greater volatility, meaning the stock's price has experienced larger fluctuations from its average price over the chosen period. It suggests that the stock's price movements are more erratic and unpredictable.
What does a low standard deviation indicate?
- A low standard deviation suggests lower volatility, indicating relatively stable price movements around the average price. It implies that the stock's price tends to remain close to its average price over the chosen period.
What time frame should be used for calculating standard deviation?
- The time frame for calculating standard deviation depends on the trader's trading style and strategy. Shorter time frames may capture short-term volatility, while longer time frames may reflect broader market trends. Traders should choose the time frame that best suits their trading objectives.
Filter Info for Standard Deviation [BB]
- description = Standard Deviation
- keywords =
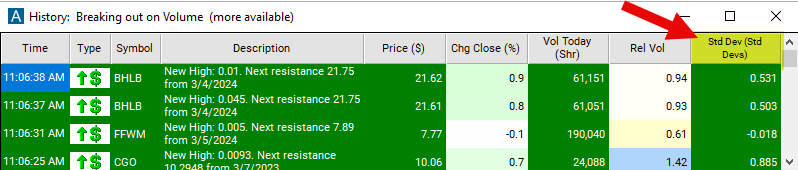
- units = Standard Deviations
- format = 3
- toplistable = 1
- parent_code =