


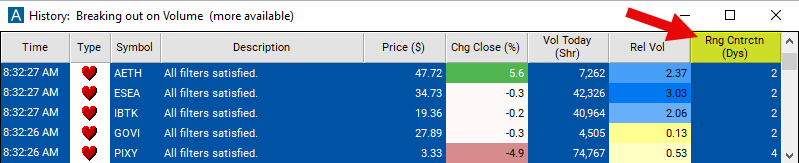
Range Contraction
Table of Contents
- Understanding the Range Contraction Filter
- Range Contraction Filter Settings
- Using the Range Contraction Filter
- FAQs
Understanding the Range Contraction Filter
Range contraction refers to a stock pattern where a stock’s trading range gets smaller every day. A stock’s trading range is the difference between the high for the day and the low for the same day. If a stock’s trading range yesterday was smaller than its range the day before yesterday, we said the stock had a range contraction. If the day before yesterday’s range was smaller than the range of the day before that, then the stock had a range contraction for two consecutive days.
Range explosion refers to the opposite pattern. These are stocks with a range that has grown larger each consecutive day. Use negative numbers to find these patterns.
These filters always start with yesterday’s trading and work backwards. Use other filters and alerts to see what the stock is doing today. For example use the Daily highs resistance and Daily lows support alerts, with these filters, to find stock which were in a range contraction pattern but are breaking out.
Range Contraction Filter Settings
The settings of each Trade Ideas filter are defined in the Window Specific Filters Tab located in the Configuration Window of your Alert/Top List Window.
Here is how to setup the filter in your configuration window:
-
Set the min range contraction to 2 to see stocks which have had range contractions for at least 2 consecutive days.
-
Set the max range contraction to -3 to find stocks which have had a range explosion for at least three consecutive days.
Using the Range Contraction Filter
Several trading strategies can be employed with the Range Contraction filter. Here are a few examples:
Breakout Trading: Enter trades when the price breaks out of the contraction phase, signaling a potential continuation of the current trend or the start of a new trend. Wait for the price to break above the upper boundary of the contraction phase (bullish breakout) or below the lower boundary (bearish breakout) before entering a long or short position, respectively. Use volume confirmation to validate the breakout.
Volatility Expansion Trading: Anticipate an increase in volatility following a period of range contraction. Enter trades when volatility starts to expand, indicated by an increase in trading volume and price movements. Traders can use volatility indicators such as the Average True Range (ATR) or Bollinger Bands to identify potential trading opportunities.
Range Reversion Trading: Trade the reversion to the mean when the price remains within the contracted range. Enter trades when the price approaches the boundaries of the contraction phase (upper or lower range). Take a long position near the lower boundary and a short position near the upper boundary, anticipating a pullback towards the middle of the range.
Trend Continuation Trading: Use range contraction as a confirmation signal for trend continuation. If the price contracts within a trend, look for opportunities to enter trades in the direction of the prevailing trend once the contraction phase ends. This could involve entering long positions during bullish trends or short positions during bearish trends.
FAQs
What time frame should I use to analyze range contraction?
- The time frame for analyzing range contraction depends on the trader's trading style and objectives. Short-term traders may focus on intraday charts (e.g., 5-minute or 15-minute), while swing traders or investors may analyze daily or weekly charts to identify longer-term range contraction patterns.
How long does range contraction typically last before a breakout or breakdown occurs?
- The duration of range contraction periods can vary widely depending on market conditions and the specific security being traded. While there's no fixed duration, traders often observe range contraction lasting several days to weeks before a significant breakout or breakdown occurs.
What indicators can I use to confirm a breakout or breakdown after range contraction?
- Traders can use various indicators to confirm breakouts or breakdowns after range contraction, such as volume indicators, momentum oscillators (e.g., MACD or RSI), or price action patterns like bullish or bearish candlestick formations. Confirmation from multiple indicators can increase the reliability of signals.
Can range contraction be used in conjunction with other trading strategies?
- Yes, range contraction can complement other trading strategies such as trend following, mean reversion, or breakout trading. Combining range contraction analysis with other technical indicators or chart patterns can provide additional confirmation and enhance the overall trading strategy.
Filter Info for Range Contraction [RC]
- description = Range Contraction
- keywords = Changes Daily
- units = Days
- format = 0
- toplistable = 1
- parent_code =