
Light Mode

A 3% overnight gap is nothing for some stocks and a big deal for others. Trade Ideas can measure each gap against how far that stock usually moves.
Free account, just an email. No card. Live access for a limited time.

Named to the Inc. 5000 list of America’s fastest-growing private companies six years in a row (2017–2022).

Investopedia: Best Short Term Stock Screener, 2024
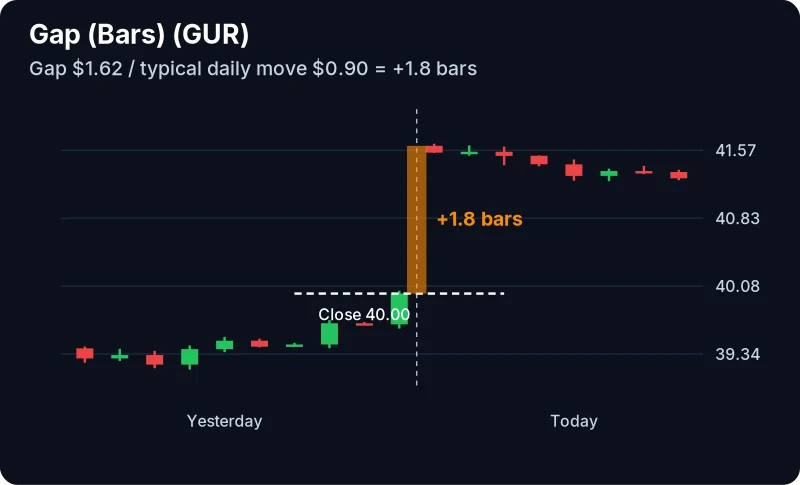
The overnight gap runs from the 4:00 p.m. close to the next open. Two filters measure it differently:
Example numbers, not a real trade
Swing traders often scan this way after the close and again before the open. Pair it with Relative Volume once the session starts.
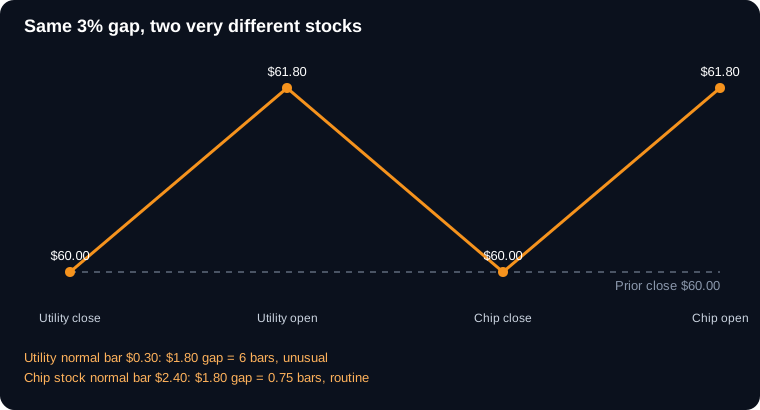
Percent gaps are easy to read, but they treat every stock the same. A slow utility and a jumpy chip stock don’t move the same on a normal day, so the same 3% means very different things.
The gap in bars filter fixes that. It divides the gap by how much that stock usually moves in a bar, so the number tells you how unusual the gap is for that stock. A reading of 5 means the gap is five normal bars wide. A reading of 0.8 means it is less than one, which is just another morning for that name.
A recipe some swing traders use: gap in bars of 3 or more, price over $10, average daily volume over 500,000 shares. That skips the routine jumps and keeps the gaps that are big for the stock, even if the percent looks small.
Example, made-up numbers. A $40 insurance stock gaps 2.5% to $41 after a court ruling. A typical bar for it is 20 cents, so the $1 gap is 5 bars. A $40 software stock gaps 4% to $41.60 on nothing special. Its normal bar is $1.10, so the gap is under 1.5 bars. The percent list puts the software stock first. The bars list puts the insurance stock first, and that is usually the one with a real story.
Overnight gaps also matter for holding positions. If you carry a swing trade overnight, a scan like this tells you each morning which of your names opened with an unusual gap, before you even pull up a chart. Pair it with your own watchlist so you only see the stocks you own or follow.
Weekends count too. A Monday gap covers news from Friday 4:00 p.m. ET to Monday morning, so Monday lists often run longer than the rest of the week. Plan a few extra minutes for them.
If you’re new to this, try both lists for a week, the percent list and the bars list, side by side. Write down which gaps actually moved after the open. Most folks find the bars list surfaces fewer names, but more of them are worth a look. That’s the whole reason to size the gap to the stock instead of using one number for every ticker in the market.
Free account, just an email. No card. Live access for a limited time.
About gaps from close to open.
The difference between yesterday’s 4:00 p.m. ET close and today’s open. News after the close and premarket trading cause most of it.
Yes, people use both names for the close-to-open gap on a daily chart.
So you compare each stock to itself. A slow stock gapping 3% is often more unusual than a fast one gapping 6%.
It measures the overnight gap against the stock’s own normal bar size, so you can tell a big gap for that stock from a routine one.
Past results, including backtests, don't guarantee future results.
Free account, just an email. No card. Live access for a limited time. Ready to buy? See plans & pricing

