
Light Mode

Plenty of gaps fade in the first hour. Gap and go traders want the ones that hold their ground and push on.
Free account, just an email. No card. Live access for a limited time.

Named to the Inc. 5000 list of America’s fastest-growing private companies six years in a row (2017–2022).

Investopedia: Best Short Term Stock Screener, 2024
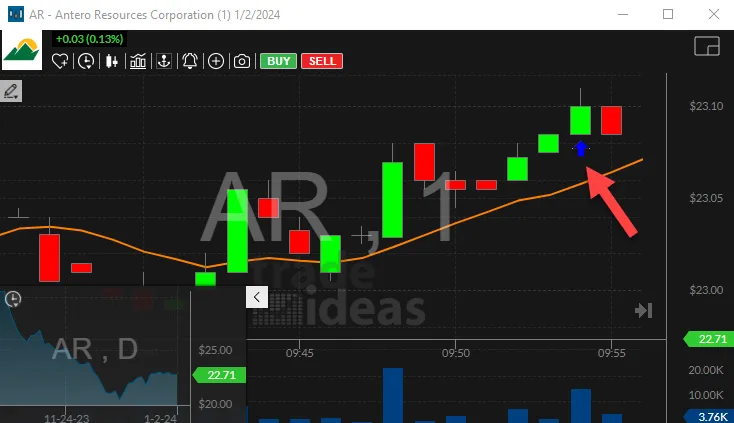
Start with gap ups from Gap (%), then let the alerts tell you when one goes:
Example numbers, not a real trade
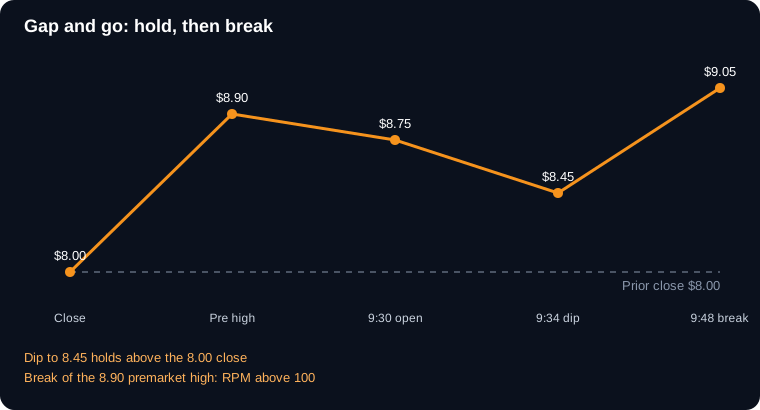
Size the stop before the break, not after. More opening-range setups are on the opening range breakout scanner.
Gap and go looks simple on a chart after the fact. In real time it is mostly about waiting for the stock to prove itself. Here are the rules many traders tape to the monitor.
Example, made-up numbers. A $6 stock closes at $6.00 and gaps to $6.90 premarket on a partnership headline. Premarket high is $7.05. It opens at $6.95, dips to $6.62 by 9:34 (holding well above $6.00), and volume is running five times normal. At 9:47 it trades $7.06, the premarket range position goes over 100, and you get the alert. Stop under $6.62 means about 44 cents of risk per share. If you risk $100 on the idea, that is roughly 225 shares.
The failure looks just as clear. Same stock dips to $6.20 and then $5.95. It just lost the close. The setup is done, and the gap fill alerts take over from there.
Timing matters too. Most of these work in the first hour when the opening volume is heaviest. After 10:30 the same pattern shows up less and follows through less, so many traders shut the scan off and move on to other setups.
One last practical tip. Write your gap and go rules on paper and check them off before each entry: reason, volume, held the close, broke the high, stop set. If one box is empty, pass. It feels slow at first, but it keeps you out of the trades that look like a gap and go for thirty seconds and then turn into a gap fill while you’re still deciding what to do.
Free account, just an email. No card. Live access for a limited time.
About trading gaps that hold.
A setup where a stock gaps up, holds above the prior close, and keeps going higher instead of filling the gap.
No. Many fail at the premarket high. The alerts show when the pattern forms; the trade plan is yours.
Most traders look at the first 30 to 60 minutes after the open, when opening volume is heaviest.
A common spot is just under the low of the first pullback after the open. If that breaks, the stock did not hold the gap.
Past results, including backtests, don't guarantee future results.
Free account, just an email. No card. Live access for a limited time. Ready to buy? See plans & pricing

