


Gap
Table of Contents
- Understanding the Gap in Bars Filter
- Gap in Bars Filter Settings
- Using Gap in Bars in Trading
- FAQs about Gap in Bars
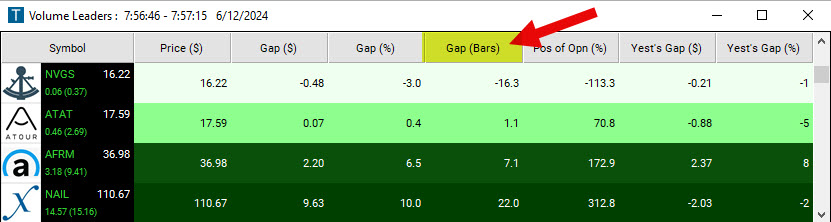
Understanding the Gap in Bars Filter
Most traders are familiar with measuring gaps in dollars and percentages. A $2 gap might sound significant, but in the world of trading, context is everything. That's why we have a third type of gap measure called bars. The Gap in Bars Filter doesn't just look at the dollars and percentages; it considers each stock's volatility. Volatility is like the heartbeat of a stock — it tells you how much it likes to jump around.
A $0.90 gap is a big deal for some stocks, but for others, it's just background noise, so something you ignore. That's where the Gap in Bars Filter shines. It scales the gap based on each individual stock's volatility. So that $0.90 gap becomes either a blip on the radar or a flashing beacon, depending on the stock. It filters out the mundane, the stocks that are just doing what they always do, and leaves you with the interesting ones, the ones deviating from the norm, the ones that could spell opportunity.
The formula of this filter is (expected_open-last_price)/(volatility+0.00001)
expected_openrefers to today’s official open price, or the most recent print if the stock has not opened yet.last_priceis the official closing price from the previous day.volatilityis the volatility of a stock in dollars. Here, it refers to the average amount that a stock’s price moves between one 15 minute bar and the next. For a quick idea of what this means, just look at a stock chart with 15 minute bars, and see how much the price changes from the close of one bar to the close of the next. For more details, head here.0.00001this addition is used to prevent division by zero, ensuring that the formula doesn't break when dealing with stocks with extremely low volatility.
The result of this calculation provides a scaled value that accounts for both the size of the gap and the stock's typical price movement behavior. This scaled value helps traders assess the significance of the gap relative to the stock's usual behavior.
If the result is a large value, it suggests that the gap is substantial compared to the stock's typical price fluctuations, indicating potential trading significance. Conversely, if the result is close to zero, it suggests that the gap is relatively small compared to the stock's usual price movements, indicating it might not be as significant.
Gap in Bars Filter Settings
Activating the Gap in Bars Filter is straightforward. You'll find its settings under the Window Specific Filters Tab in your Alert/Top List Window's Configuration Window.
Here, you can specify a "noise filtering value". This value acts as a discerning gatekeeper, sifting out stocks adhering to their typical behavior and presenting only those exhibiting intriguing deviations.
A value of 1 represents the average amount a stock moves between the close of one 15 minute bar and the next.
-
Setting a minimum of 0.25 and a maximum of -0.25 in the Windows Specific Filters Tab, narrows your focus to approximately half the stocks compared to an unfiltered view.
-
Increasing the filter range to a minimum of 0.5 and a maximum of -0.5 in the Windows Specific Filters Tab, refines your selection to about one-third of the stocks.
-
If you are seeking an even more selective approach, a minimum of 1 and a maximum of -1 reduces the results to approximately one-fifth.
These values will vary from day to day.
Using Gap in Bars in Trading
The filter's ability to highlight deviations from typical behavior can be a valuable addition to your trading toolkit, leading to improved trading outcomes.
Prioritize stocks with higher Gap in Bars Filter values, as they may offer more significant trading opportunities. You can consider potential long or short positions based on the direction of the gap.
Avoid trading stocks with gaps that have Gap in Bars Filter values suggesting they are not significant relative to their volatility. This helps you steer clear of potentially unprofitable or overly risky trades.
FAQs about Gap in Bars
How does the Gap in Bars Filter handle stocks with extremely low volatility?
The Gap in Bars Filter includes a small addition of 0.00001 in its formula to prevent division by zero when dealing with stocks with extremely low volatility. This ensures that the filter can still assess the significance of the gap for such stocks.
How do I interpret a negative result from the Gap in Bars Filter calculation?
A negative result indicates that the expected open price is lower than the previous day's closing price, suggesting a downward gap. The magnitude of the negative number reflects the significance of the gap relative to the stock's typical price movements.
What should I do if I see stocks with a Gap in Bars Filter value close to zero?
A value close to zero implies that the gap is relatively insignificant in comparison to the stock's usual price movements. Such stocks might not present significant trading opportunities based on the gap alone, so it might be best to avoid or further analyze these stocks.
How does the Gap in Bars Filter handle stocks with high liquidity versus those with low liquidity?
While the filter primarily focuses on price gaps and volatility, liquidity can indirectly affect the results. Stocks with low liquidity might exhibit more sporadic price jumps due to lower trading volumes, which could influence the filter's output. It's essential to consider liquidity when evaluating the filter's results.
Does the Gap in Bars Filter offer any insights into the reasons behind a gap?
The filter is designed to identify and scale gaps based on volatility, not to explain them. To understand the reasons behind a gap, traders should complement the filter's insights with news, events, earnings reports, or other relevant market analyses.
Are there any limitations or considerations to be aware of when using the Gap in Bars Filter?
Like any filter or trading tool, the Gap in Bars Filter should be used in conjunction with other indicators, analyses, and market insights. While it provides a useful measure to scale gaps based on volatility, it doesn't offer insights into other market factors or potential influences on stock price movements.
Can I use the Gap in Bars Filter alongside other filters or scans?
Yes, the Gap in Bars Filter can and should be combined with other filters and alerts. By integrating it into your trading setup, you can create more customized and refined scans to identify unique trading opportunities.
Filter Info for Gap [GUR]
- description = Gap
- keywords =
- units = Bars
- format = 1
- toplistable = 1
- parent_code = GUD