
Light Mode

New highs and lows the moment they print, not after the close.
Set the New High alert to 365 days and it only fires on 52-week highs, print by print.
Free account, just an email. No card. Live access for a limited time.

Named to the Inc. 5000 list of America’s fastest-growing private companies six years in a row (2017–2022).

Investopedia: Best Short Term Stock Screener, 2024
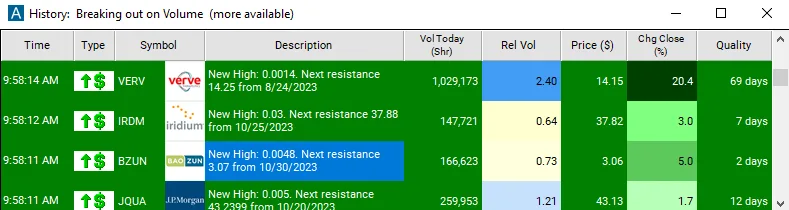
New High (NHP) has a minimum-days box. Set it to 365 and it fires only when a stock trades above every price of the past 52 weeks. New Low (NLP) does the same for lows.
Streaming Alerts (Scanner) run in TI Pro, our desktop app for Windows (on a Mac, through Parallels). Top Lists (Screeners) also run in the Web Dashboard, right in your browser.
Stocks trading above every price of the past year, or below every price. New 52-week highs are where leaders show up; new lows are where trouble shows up.
End-of-day lists tell you after the close. The alert fires on the print that sets the high.
| Alert or filter | What it does |
|---|---|
| New High (NHP) | New high. Set minimum days to 365 for 52-week highs, 7 for weekly, 1 for above yesterday. |
| New High (filtered) (NHPF) | New high, filtered to about one alert per stock per minute. |
| New Low (NLP) | New low. Set 365 for 52-week lows. |
| New Low (filtered) (NLPF) | New low, filtered. |
| Position in Range (1 year) (RY) | Position in 1-year range. 100 = at the 52-week high; above 100 = new high. |
| Below High (BelowHigh) | Distance from today's high, in dollars. |
| Relative Volume (RV) | Relative volume, so you see highs with volume behind them. |
Not every trader wants the break itself. Position in Range (1 year) (RY) at a min of 90 shows stocks in the top 10% of their yearly range, a watchlist of names close to breaking out.
The New High alert accepts up to 366 days. For all-time highs, look at stocks making 52-week highs and check the long-term chart; there is no separate all-time-high alert.
Set New Low (NLP) to 365 days. Add Relative Volume (RV) so you see the lows with heavy selling.
A stock at a 52-week high has no sellers above it from the past year who bought higher and want out. Many momentum traders look there first.
New lows are the reverse: everyone who bought in the past year is under water.
Pair the New High alert set to 365 days with Relative Volume (RV) at 2 or more. A 52-week high on heavy volume is the setup most breakout traders want.
The same alert takes any value from 0 to 366 days. Set 7 for weekly highs or about 21 for monthly highs, in trading days.
After the close, sort a Top List by Position in Range (1 year) (RY) to see stocks closest to the top of their yearly range. That is tomorrow's watchlist.
The New High alert runs in regular hours. For premarket highs, use the Pre-market Highs alert on the premarket scanner.
Short sellers use the same alert with New Low at 365 days. Stocks breaking to yearly lows on heavy volume have no buyers below them from the past year.
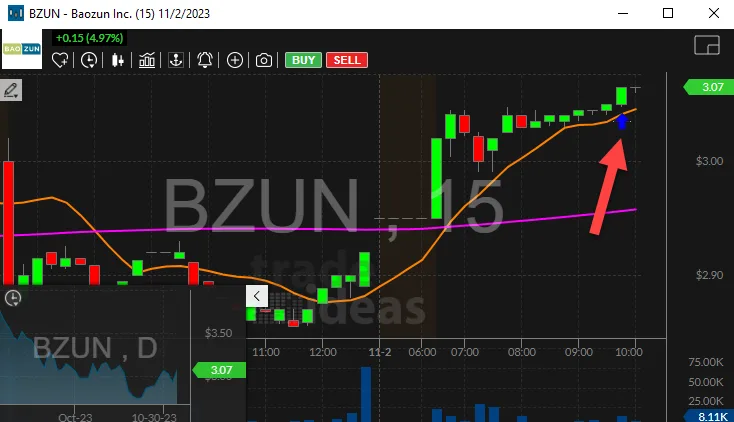
This real capture shows Baozun (BZUN) at 9:58:11 a.m. ET on November 2, 2023. The New High alert fired at $3.06, up 5.0% on the day. The description gave the next resistance as $3.07 from October 30, and the quality column read 2 days.
Two days is not a 52-week high. The same alert, with the lookback set to 365, would have stayed quiet. That is the whole point of the setting: the alert type is the same, and the lookback decides which highs you see.
| Setting | Value |
|---|---|
| Alert | New High (filtered) (NHPF), or New High (NHP) for every print. |
| Quality (lookback) | Min 365 days for 52-week highs. Use 250 if you think in trading days. |
| Relative Volume | Min 1.5, so the move has real interest. |
| Price | A floor of $5 keeps out most thin names. |
| Dollar Volume | Min $5 million a day. |
Many traders want to see stocks before they break. A Top List sorted by Position in Range (1 year) (RY), Position in Range (1 year), shows where each stock sits between its yearly low and high. A value of 95 or more means it is within the top 5% of that range. Pair it with Consolidation (ConDays) to find stocks sitting near the high in a tight base.
Position in Range (2 year) (R2Y) does the same over two years, and Position in Lifetime Range (RL) over the stock’s whole trading history, which is the closest Trade Ideas gets to an all-time-high screen.
Example numbers, not a real trade
There is no all-time-high alert. Position in Lifetime Range (RL), Position in Lifetime Range, reads 100 at the lifetime high and goes above 100 on a new one. A Top List with RL at a min of 100 shows stocks at all-time highs. A min of 90 shows the leaders close to them.
Position in Range (1 year) (RY) goes above 100 once a stock clears its yearly high. A reading of 101 means it is just past it; 110 means it has run well beyond it. Many breakout traders prefer the fresh breaks, under about 103.
Earnings can push a stock to a new yearly high in one day. Earnings Date (EarningD) with a max of 1 shows stocks reporting today or tomorrow. Some traders avoid holding a fresh 52-week high through earnings; others look for it on purpose.
52-week high Top List
| Alert or filter | Setting |
|---|---|
| Position in Range (1 year) (RY) | Min 98. |
| Relative Volume (RV) | Min 1.5. |
| Dollar Volume (DV) | Min $10 million. |
| Price (Price) | $10 and up. |
| Change (20 day, %) (U20DP) | Optional: min 10, for stocks up 10% or more in 20 days. |
Change Since January 1 (%) (UpJan1P) shows change since January 1 in percent. Combined with RY near 100, it lists the stocks leading the year and still sitting at their highs.
Stocks making new yearly highs on a day when S&P Change Today (SpyD) is down are showing strength the market is not. Some traders keep a short list of those days’ highs as the next leaders.
A stock that clears its 52-week high often comes back to test the old high within days. Traders who missed the break wait for that test. The level that was resistance for a year can turn into support.
25% Pullback From Highs (PFH25) on the day of the test shows the pullback as it happens.
Below High (BelowHigh) shows how far a stock is under today’s high. Combined with RY near 100, it finds stocks that touched a 52-week high today and pulled back a little, a setup some traders like for a second try at the level.
New highs can fail and reverse the same day.
Test your rules in a simulated account first.
Free account, just an email. No card. Live access for a limited time.
Plain answers to what traders search for.
Turn on the New High alert with minimum days set to 365.
Yes. Set Position in Range (1 year) (RY) to a min of 90.
Yes. Use the New Low alert with 365 days.
Not as its own alert. The New High alert goes up to 366 days.
You can try it with a free account, just an email, no card. Live access is for a limited time, then it is part of a paid plan.
Yes. Set the minimum days to 7 for weekly, or about 21 for monthly.
Past results, including backtests, don't guarantee future results.
Free account, just an email. No card. Live access for a limited time. Ready to buy? See plans & pricing

