
Light Mode

Stocks breaking to new highs of day with volume behind them, in real time.
New high of day alerts on every print, plus filtered and volume-confirmed versions.
Free account, just an email. No card. Live access for a limited time.

Named to the Inc. 5000 list of America’s fastest-growing private companies six years in a row (2017–2022).

Investopedia: Best Short Term Stock Screener, 2024
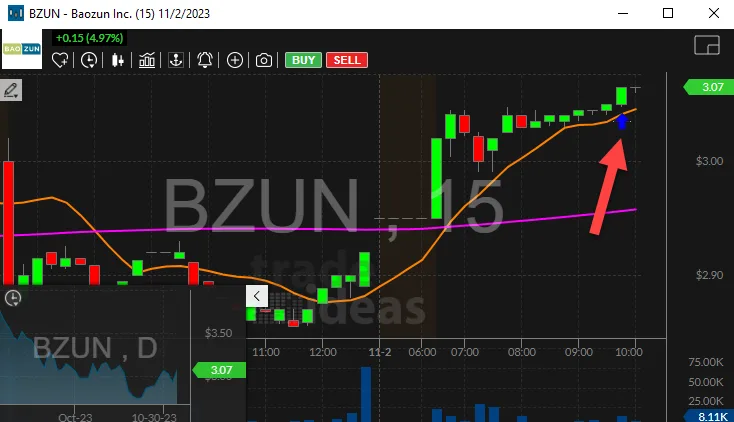
A new high of day is a print above every other price today. Trade Ideas fires on that print.
Streaming Alerts (Scanner) run in TI Pro, our desktop app for Windows (on a Mac, through Parallels).
Stocks pushing to new highs today with volume. Momentum traders watch these because a stock making new highs has no sellers above it from earlier in the day.
For broader momentum, see the momentum stock scanner.
| Alert or filter | What it does |
|---|---|
| New High (NHP) | Every print above the day's high. |
| New High (filtered) (NHPF) | Filtered: about one alert per stock per minute. |
| New High Ask (NHA) | The ask makes a new high. |
| 5 Minute High (IDH5) | Breaks the prior 5 minute bar's high. |
| 15 Minute High (IDH15) | Breaks the prior 15 minute bar's high. |
| Running Up (RU) | Running up. |
| Running Up Now (RUN) | Running up now. |
| Running Up (confirmed) (RUC) | Running up, volume confirmed. |
| Below High (BelowHigh) | Distance from today's high. |
| Relative Volume (RV) | Relative volume. |
A common setup: New High (filtered) (NHPF) with Relative Volume (RV) at 2 or more, Price $2 to $20, and a Float max for small caps.
A new high of day is above every price today. A new 52-week high is above every price this year. The same alert does both; the minimum-days setting decides. See the 52-week high scanner.
New High (NHP) fires on every new high, which can be many times a minute on a fast stock. New High (filtered) (NHPF) shows about one alert per stock per minute unless the move is bigger than expected. Most traders use the filtered one.
New High Ask (NHA) watches the ask price, not trades. The ask rising to new highs can show buyers lifting offers before the next trade prints.
5 Minute High (IDH5) and 15 Minute High (IDH15) fire when the current bar breaks the prior bar's high. They are smaller breakouts than a new high of day and fire more often.
For low float momentum, add Float (Float) at a max of 20 million and Float Turnover (FloatTurn) to see how much of the float has traded.
The chart at the top shows BZUN climbing from the early session, with the New High alert marking the push to a new high. Volume bars underneath show the steady trading behind it.
The momentum stock scanner page covers gap and go and running alerts. This page is about the new high of day itself.
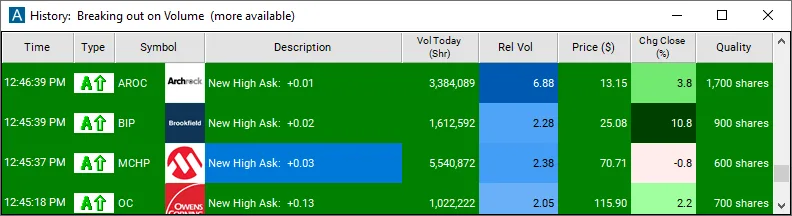
This real window ran New High Ask (filtered) (NHAF), which fires when the ask, not the last trade, makes a new high for the day. At 12:46:39 p.m. ET, Archrock (AROC) showed a new high ask at $13.15, up 3.8%, on Relative Volume of 6.88. A minute earlier, Brookfield (BIP) showed one at $25.08, up 10.8%.
The ask moving up before trades print there means sellers are pulling back their offers. That can come a moment before the last price breaks the high, which is why some momentum traders watch the ask alerts.
Minutes Since New High (NHPAgeM), Minutes Since New High, shows how long ago the stock made its last high of the day. A max of 15 means it made one in the last 15 minutes. That keeps the list to stocks still pushing, not ones that topped at 9:45.
Time to Median High (5 day) (HighTOD5Med) shows the time of day a stock has made its daily high, as a median over the last 5 days. A stock that usually tops within the first half hour may be done by 10:00 a.m. ET. One that tends to make its high late in the day may still have room.
| Filter | Small cap momentum | Large cap momentum |
|---|---|---|
| Price (Price) | $1 to $20 | $20 and up |
| Relative Volume (RV) | Min 3 | Min 1.5 |
| Float (Float) | Max 30 million | Leave off |
| Change From The Close (%) (FCP) | Min 10 | Min 2 |
| Minutes Since New High (NHPAgeM) | Max 10 | Max 30 |
Running Up Now (RUN) fires on moves much faster than normal for the stock. Paired with new high alerts, it shows which highs are coming on a sudden burst, not a slow grind.
Example numbers, not a real trade
Small caps making new highs on heavy volume are the stocks most likely to hit a volatility halt. Keep Halt (HALT) in the same window.
5 Minute High (IDH5) fires the first time the current 5 minute bar breaks the prior bar’s high. It is a smaller high than the day’s, and fires far more. Traders use it to time entries on a stock already on their list.
In the first minutes, almost every active stock makes a new high. Time Of Day (Time) with a min of 5 or 10 skips that rush, so the alerts that fire are highs that came after the open settled.
Each alert row shows the time, the symbol, the price, the change on the day and relative volume. For high of day trading, the two columns that matter most are relative volume and the change. A new high on Relative Volume under 1 is a stock drifting up on normal trading. A new high on 5 or more is a stock in play.
Most new high alerts fire in the first hour. Between about 11:30 a.m. and 2 p.m. ET, highs come less and many fail. The last hour brings a second wave as volume returns. Some momentum traders only trade the first and last hours.
High of day stocks move fast, so position size matters more than entry price. Smart Stop (%) (SmartStopP) gives a stop distance from each stock’s own volatility. Divide the dollars you are willing to lose by that distance and you have a size that fits the stock.
New highs at the end of a long run often stall. Know your exit.
Test your rules in a simulated account first.
Free account, just an email. No card. Live access for a limited time.
Plain answers to what traders search for.
A scanner that alerts when stocks make a new high of the day.
Use New High (filtered) instead of every print, then add Relative Volume (min 2 or 3), a Price range and a Spread limit. Minutes Since New High with a max of 15 keeps only stocks still making highs.
You can try it with a free account, just an email, no card. Live access is for a limited time, then it is part of a paid plan.
For premarket highs, use the Pre-market Highs alert. See the premarket scanner.
Streaming Alerts run in TI Pro, our desktop app for Windows. On a Mac, traders run it through Parallels. Top Lists (Screeners) also run in the Web Dashboard, in a browser.
Short for momentum scanner. It shows stocks moving fast, often making new highs of day.
New High fires on every new high print. The filtered version holds back repeat alerts on the same stock unless the move is meaningful, so a busy stock does not fill the window.
Most fire in the first hour, when volume is highest. The last hour brings a second wave. Midday highs fail more often, so many traders tighten filters between about 11:30 a.m. and 2 p.m. ET.
Past results, including backtests, don't guarantee future results.
Free account, just an email. No card. Live access for a limited time. Ready to buy? See plans & pricing

