Light Mode

Trade Ideas is a real-time trend crawler that hunts trends as they happen. It casts a web of alerts and filters across every US stock, a nearly unlimited number of combinations, so you catch the move as it starts, not after the chart already shows it.
Free account, just an email. No card. Delayed data. Real-time starts with TI Standard.

Named to the Inc. 5000 list of America’s fastest-growing private companies six years in a row (2017–2022).

Investopedia: Best Short Term Stock Screener, 2024
Most trend tools draw trendlines on the chart you already picked, or run a scan when you press a button. Trade Ideas crawls every US stock all day and alerts you the moment a trend begins: a new uptrend on the 15-minute chart, a breakout from a tight range, a channel giving way. Then 249 filters keep only the trends worth your time.
Each runs live on every US stock and fires as it happens. Mix any of them with any filters, each with a min and a max.
| The trend | Alerts | What fires them |
|---|---|---|
| A new trend starts | Linear Regression Up Trend and Down Trend, 5, 15, 30 and 90-minute (8 alerts) | The stock turns into a regression uptrend or downtrend on that timeframe |
| A tight range is about to break | Consolidation (C) | The stock is coiling in a tight range, using volume-weighted statistics to pick the best timeframe |
| The range breaks | Consolidation Breakout and Breakdown, 5, 10, 15 and 30-minute (8 alerts) | Price leaves the range on that timeframe |
| The channel gives way | Channel Breakout and Breakdown, fast and confirmed (4 alerts) | Price breaks out of, or down from, its channel |
| The averages turn | Moving average crosses and the golden cross (38 alerts) | Short averages cross long ones, from the 1-minute chart to the 200-day |
| The trend makes new ground | New highs and lows, intraday to 52-week (28 alerts) | A new high or low; the alert names the next resistance or support ahead |
Keep only the trends you want with filters such as the stock's position against its moving averages, relative volume, price and float. Want your own trend math? Write it in the Formula Editor.
Past results, including backtests, don't guarantee future results.
Auto-trendline tools draw lines on the chart in front of you, and their scanners run when you ask. Trade Ideas' trend alerts run all the time on every US stock and fire the moment a trend starts. You find out when it happens, not when you look.
More: Automated technical analysis · Trade Ideas vs TrendSpider · The platform for active investors
A trend scanner finds stocks that are starting or continuing a trend, so you don't have to check charts one by one. Trade Ideas does it live on every US stock and alerts you as each trend begins.
Use Trade Ideas' Linear Regression Up Trend alerts (5, 15, 30 and 90-minute), consolidation and channel breakouts, and moving average crosses, filtered to stocks above their 50 or 200-day average with strong relative volume.
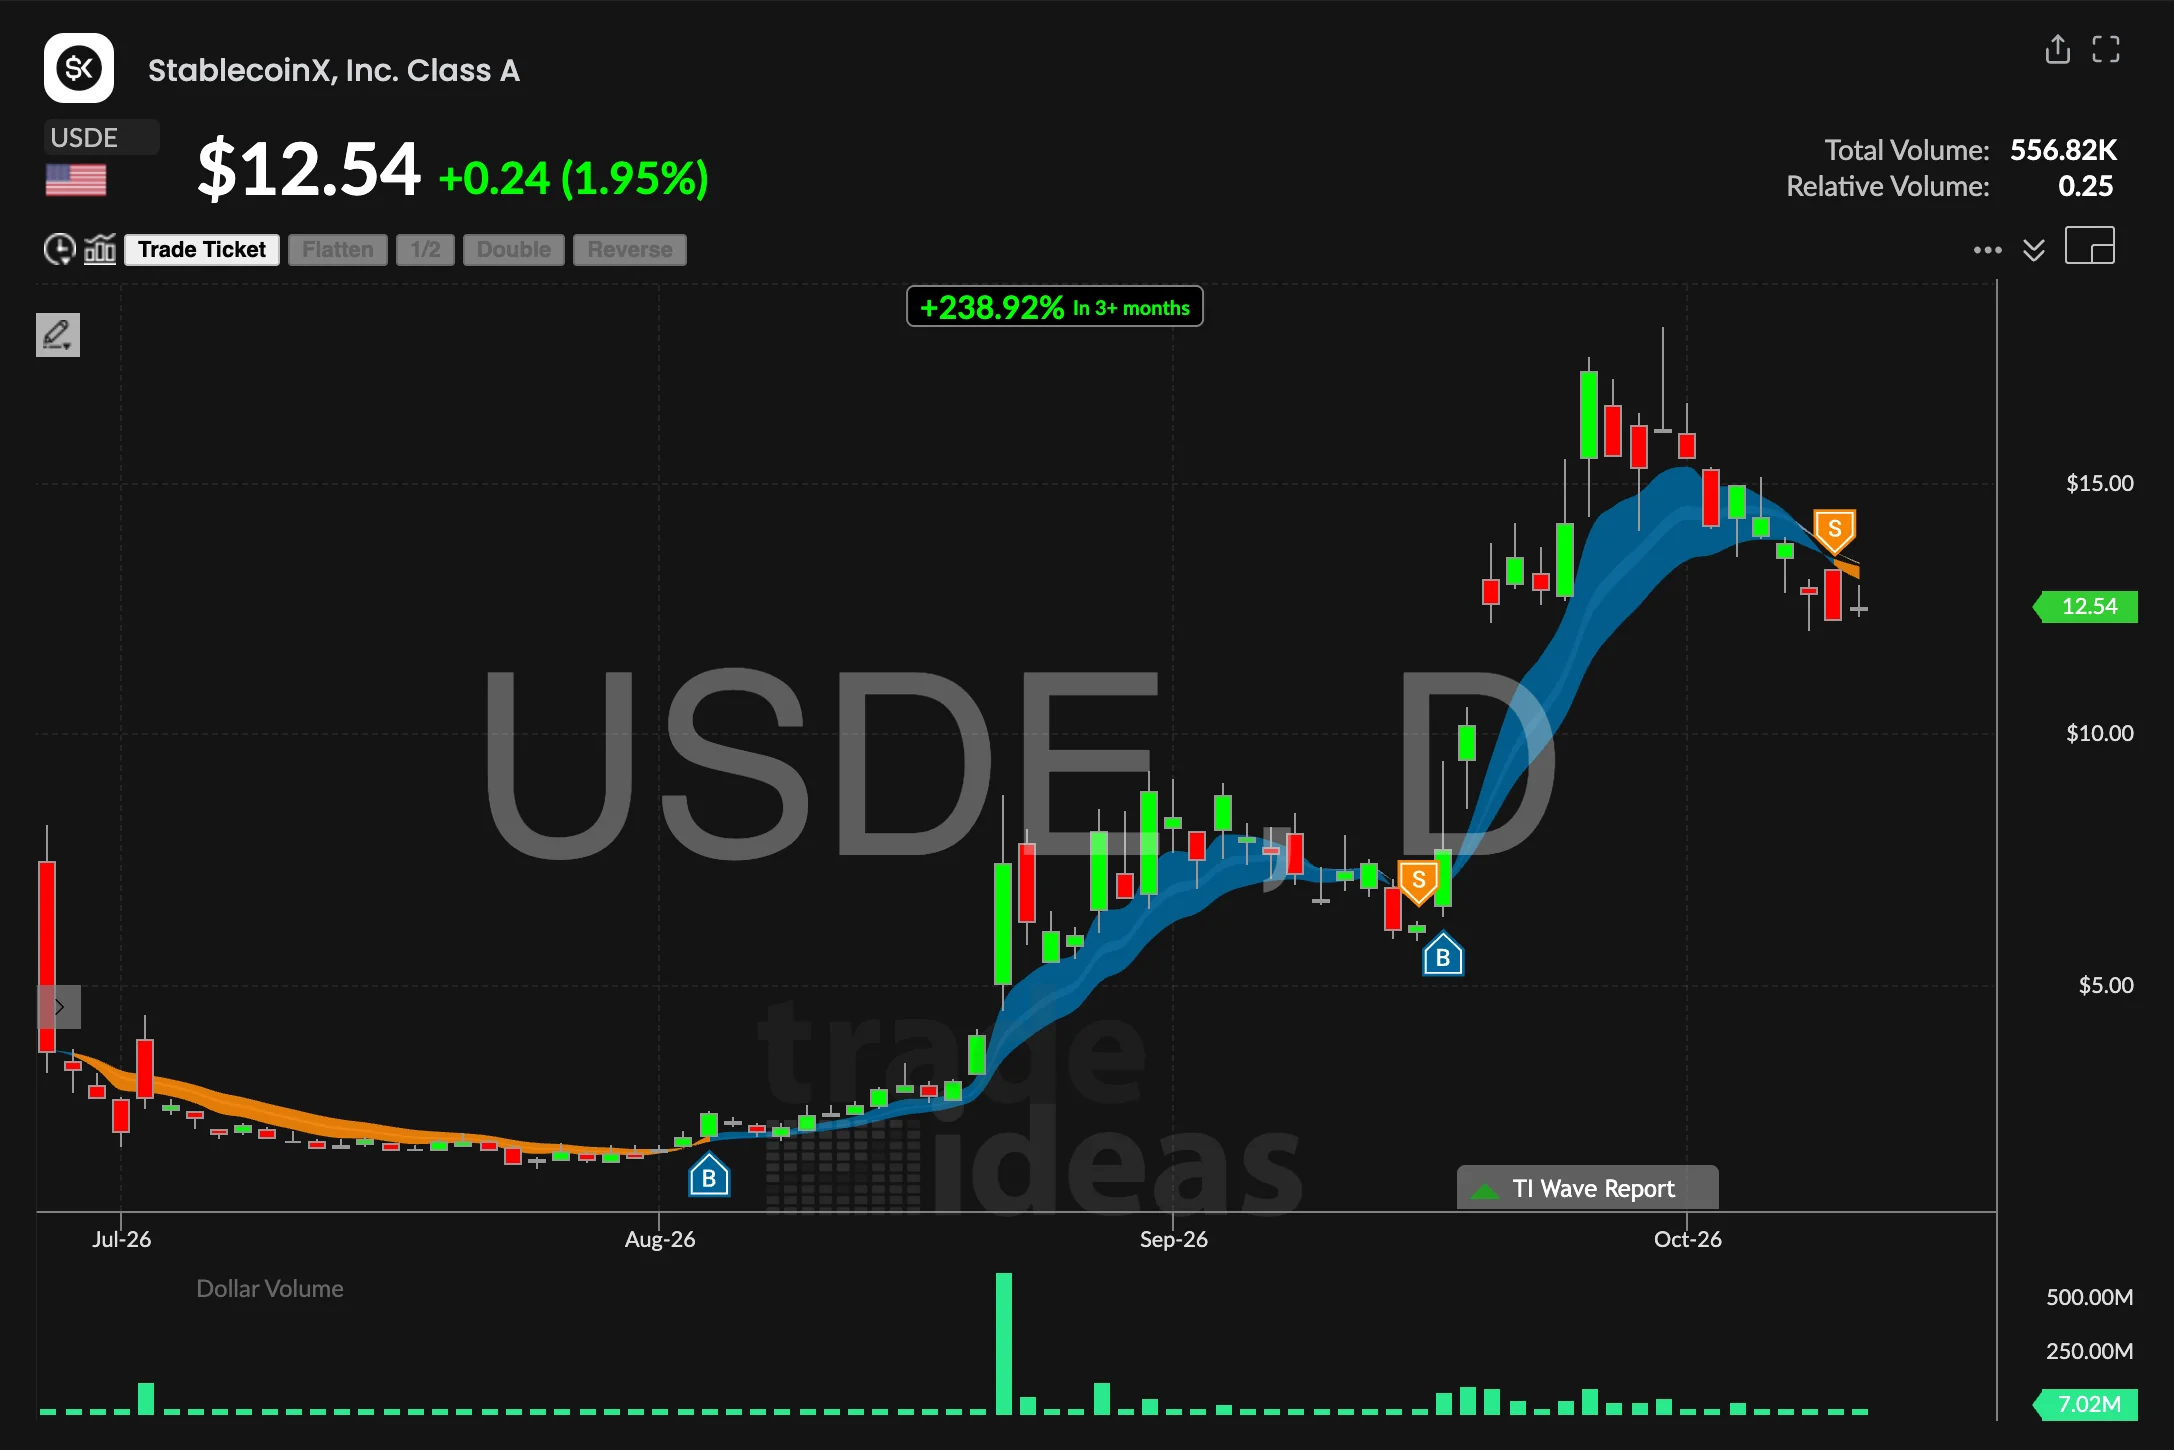
Yes. Trade Ideas charts show trend lines, support and resistance, VWAP and POC, one click each, and TI Wave's bands follow the trend with a B or S when it turns.
Yes. Trend alerts run on 5, 10, 15, 30 and 90-minute charts, moving average crosses run from the 1-minute chart to the 200-day, and highs and lows from intraday to 52-week.
Yes. Trade Ideas Streaming Alerts run all the time and fire as each trend event happens. There is no scan button to press.
Yes. A free account, just an email and no card, opens the Web Dashboard on delayed data. Real-time alerts start with TI Standard at $127 a month.
Free account, just an email. No card. Delayed data. Real-time starts with TI Standard. Ready to buy? See plans & pricing