Light Mode

Most charting tools give you a beautiful chart and wait. Trade Ideas charts come with buy and sell signals, support and resistance drawn for you, the levels where volume traded, two timeframes at once and an AI that explains what you're looking at. And a scanner that puts the right stock on the chart in the first place.
Free account, just an email. No card. Delayed data. Real-time starts with TI Standard.

Named to the Inc. 5000 list of America’s fastest-growing private companies six years in a row (2017–2022).

Investopedia: Best Short Term Stock Screener, 2024
A chart is only as good as the stock on it. Trade Ideas charting is wired to a scanner that watches every US stock live, so the chart you open is the stock that just moved, with the alert that caught it painted right on the chart. Then the tools below tell you where it may go next.
| Tool | What it does for you |
|---|---|
| TI Wave | Buy and sell signals on any stock and timeframe: AI-adapted EMA bands and a clear B or S on the chart |
| Automatic support and resistance | Levels worked out from where each stock really traded, drawn and labeled for you; alerts when price breaks them |
| POC and value area | The price where most of the day traded, and the range that holds 70% of the volume, one click |
| VWAP and trend lines | The day's volume-weighted average price and the trend's direction, one click each |
| PiP: two timeframes in one chart | The daily trend inside your 5 or 15-minute chart, no window flipping |
| Alerts on the chart | Every alert that fired, marked on the bar where it happened: a play-by-play a plain chart can't show |
| Chart AI | Ask what's happening on the chart you have open: key levels, alerts and patterns, in plain English |
| Chart pattern recognition | Double tops, wedges, head and shoulders, flags and channels found as they form, across the market |
| Idea Surfing | The top stocks from your Top Lists rotate onto your charts about every 7 seconds |
| Key stats above the chart | Float, short float, relative volume, options volume, days to cover and position in range, at a glance |
| The standard studies | Moving averages, RSI, MACD, Bollinger Bands and more, on 1-minute to daily charts |
| Trade from the chart | Trade ticket on the chart, plus one-click Flatten, Half, Double and Reverse, with supported brokers or the simulator |
Open any stock, pick any timeframe, and TI Wave draws EMA bands tuned to that stock by real-time AI. When the trend turns, a clear B or S marks the bar. Scalp on the 1-minute or swing on the daily; the bands adapt either way.
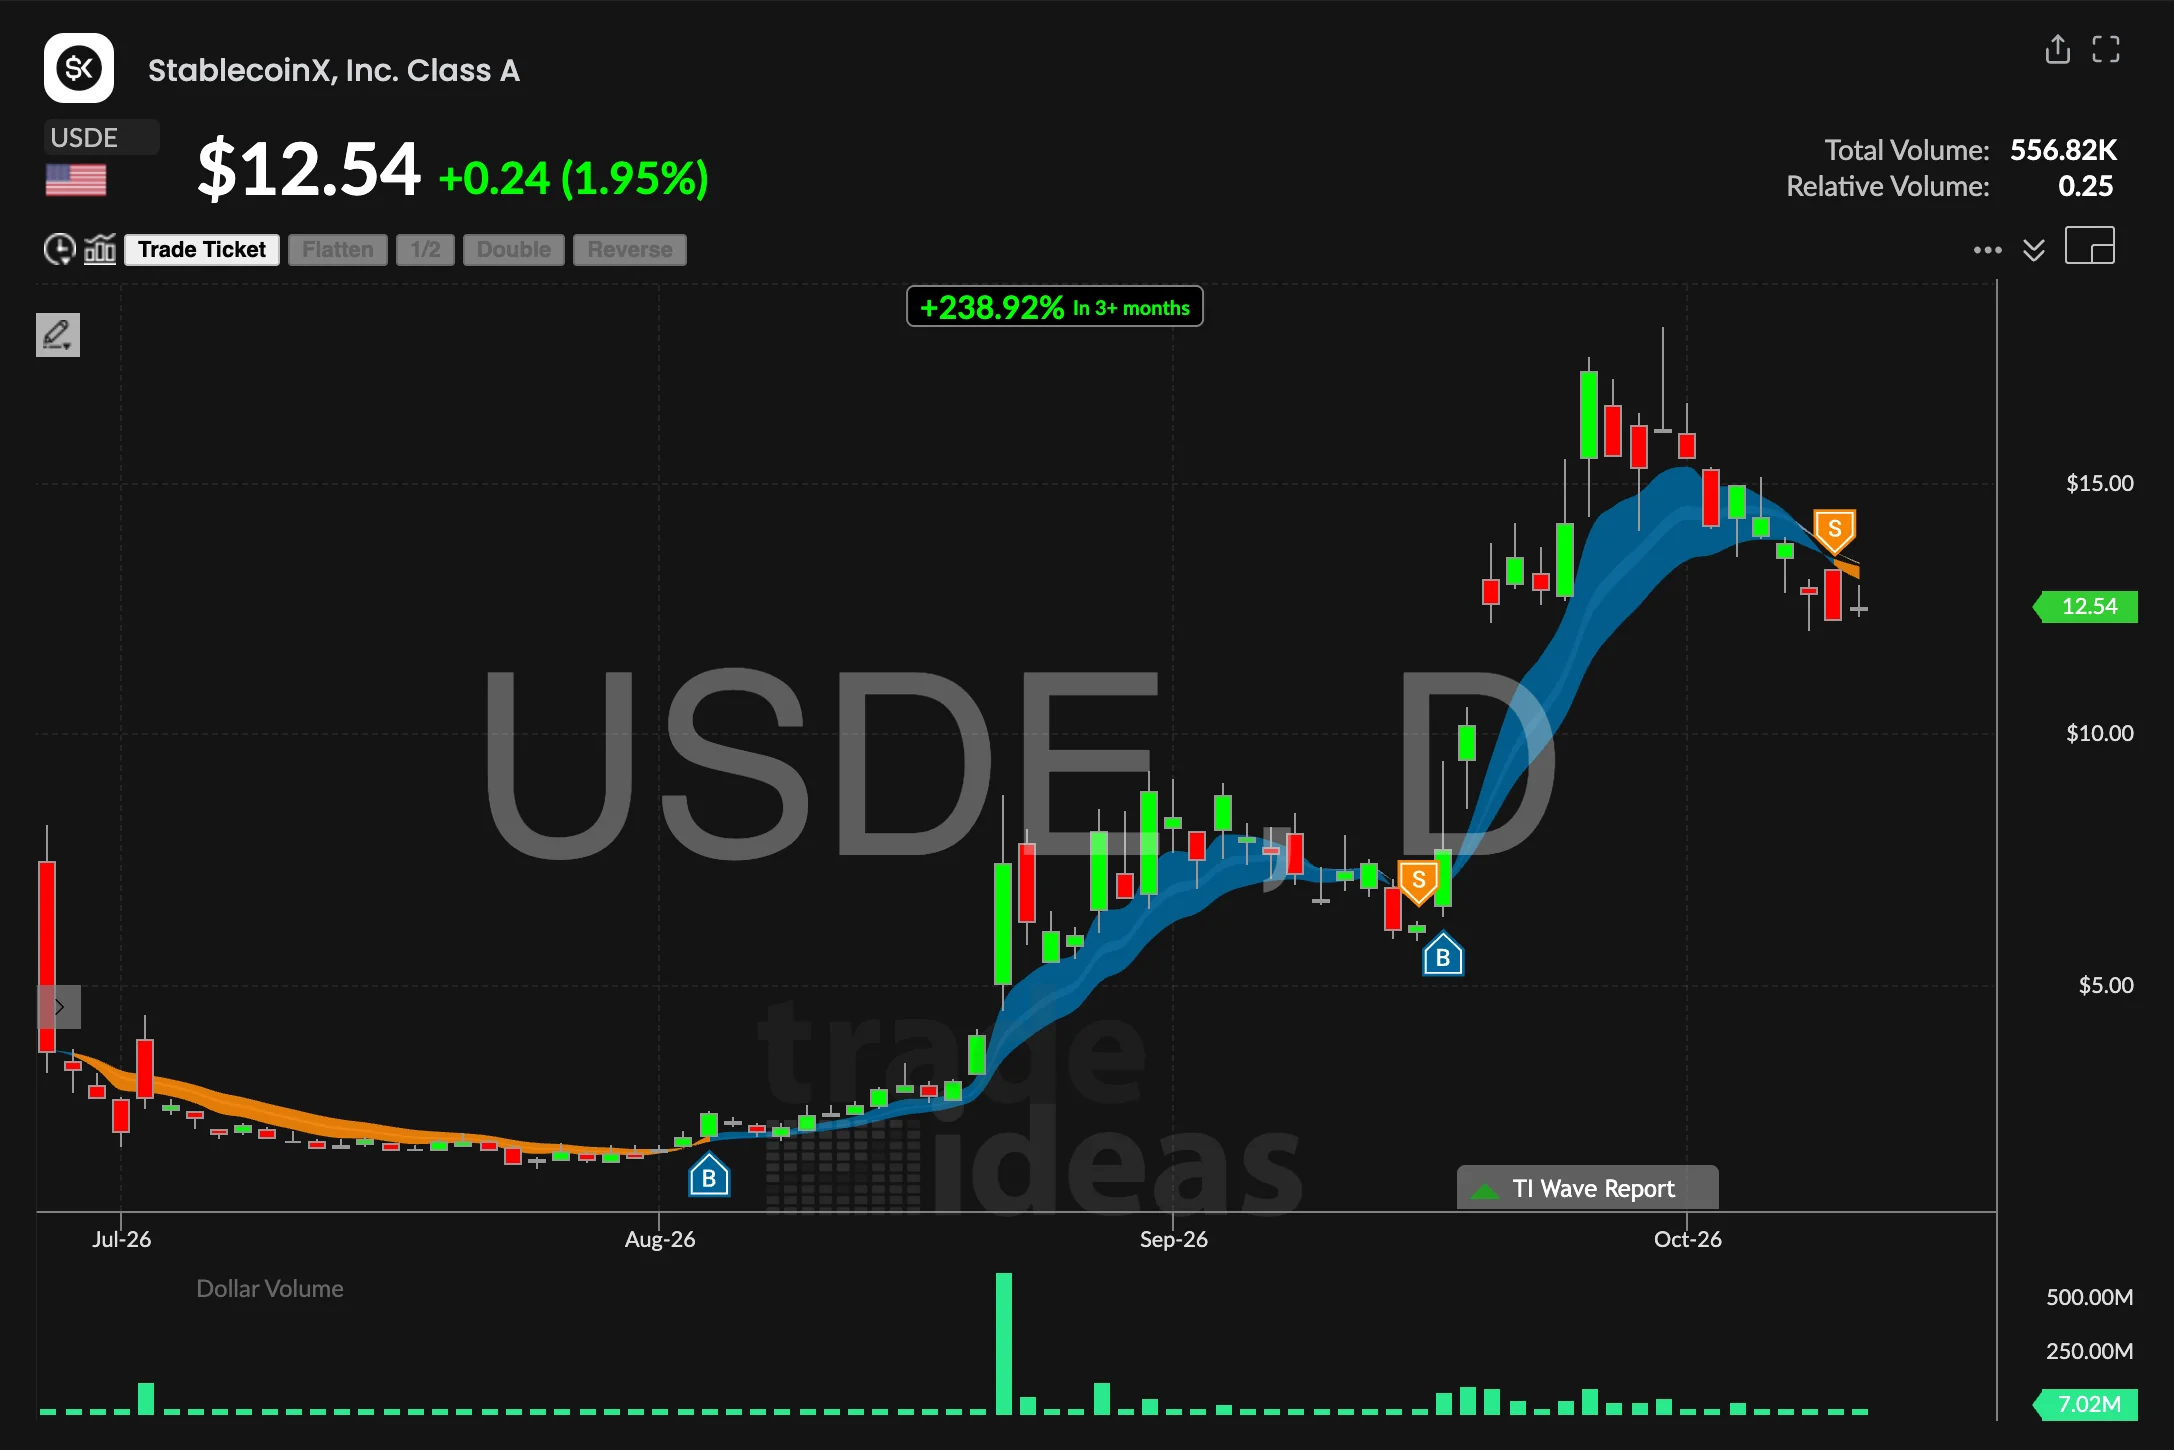
You don't draw lines and hope. Trade Ideas works out support and resistance from where each stock really traded and labels them on the chart. POC and value area show where most of the day's volume changed hands, and VWAP shows the average price buyers and sellers paid. When a stock makes a new high, its alert even names the next resistance level ahead.
With PiP charting, a second timeframe sits inside every chart: see the 15-minute trigger and the daily trend together, so you never trade against the bigger picture by accident.
Click AI on the chart and ask what's going on. The AI Assistant tells you the key levels, the alerts that fired and the patterns forming, in plain English, while you stay on the symbol. It runs on the same live market data as the scanner. It comes with TI Standard and TI Premium in TI Pro.
Every alert is painted on the chart where it fired, so you see the story of the move, not just the bars. Turn on Idea Surfing and the leaders from your Top Lists rotate onto your charts on their own.
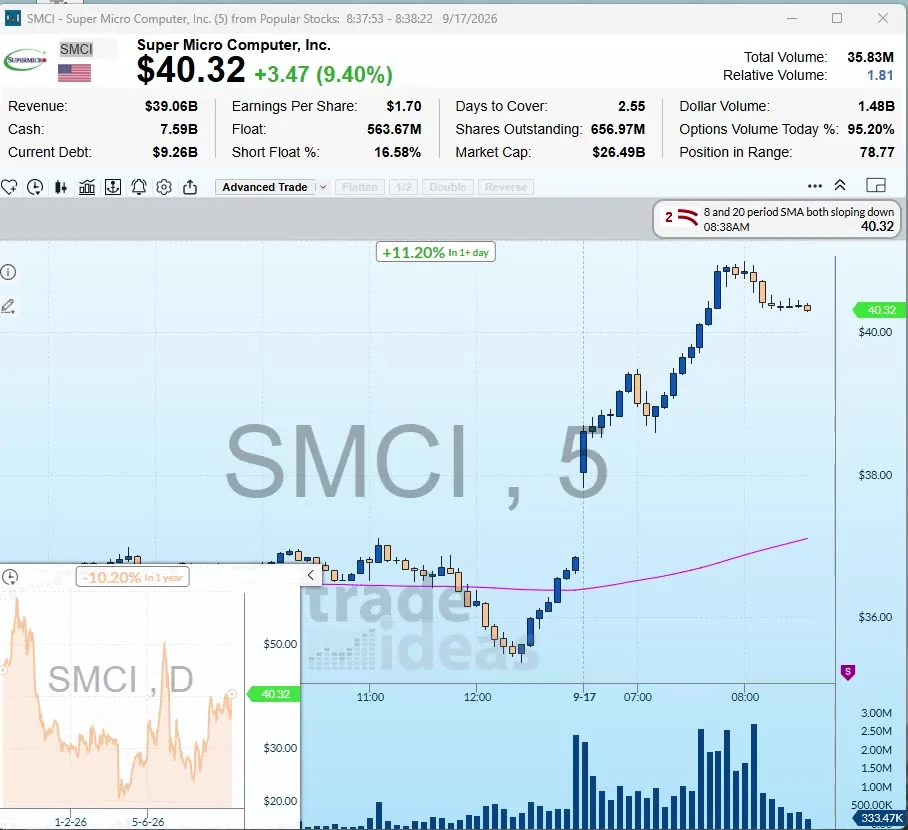
Chart-first apps start with the chart and add a screener. Trade Ideas started in 2002 with a live scanner on every US stock and built the charts around it: signals, levels and AI on the chart, and the scanner deciding which chart deserves your attention.
Head to head: Trade Ideas vs TradingView · Trade Ideas vs ChartingLens · Trade Ideas vs TrendSpider · Best technical analysis software
TI Pro is our desktop app for Windows; on a Mac, use the Web Dashboard or TI Pro through Parallels. See plans & pricing
The best one shows you what to do, not just what happened. Trade Ideas charts add TI Wave buy and sell signals, automatic support and resistance, POC, VWAP, alerts on the chart and Chart AI, and they are connected to a live scanner of every US stock.
Yes. Trade Ideas works out support and resistance from where each stock traded, labels the levels on the chart and alerts you when price breaks one.
Yes. PiP charting puts a second timeframe, such as the daily, inside your intraday chart.
Yes. The AI Assistant explains what is happening on the chart you have open, including key levels, alerts and patterns, in plain English. It comes with TI Standard and TI Premium in TI Pro.
Yes. Trade Ideas has a trade ticket on the chart and one-click Flatten, Half, Double and Reverse, with supported brokers or the built-in simulator.
Yes. A free account, just an email and no card, opens the Web Dashboard on delayed data. Live charts come with TI Standard.
Free account, just an email. No card. Delayed data. Real-time starts with TI Standard. Ready to buy? See plans & pricing