
Light Mode

When a stock trades twice its normal options volume by lunch, somebody is placing a bet. Trade Ideas ranks those stocks live, and it often shows them before the news.
Free account, just an email. No card. Live access for a limited time.

Named to the Inc. 5000 list of America’s fastest-growing private companies six years in a row (2017–2022).

Investopedia: Best Short Term Stock Screener, 2024
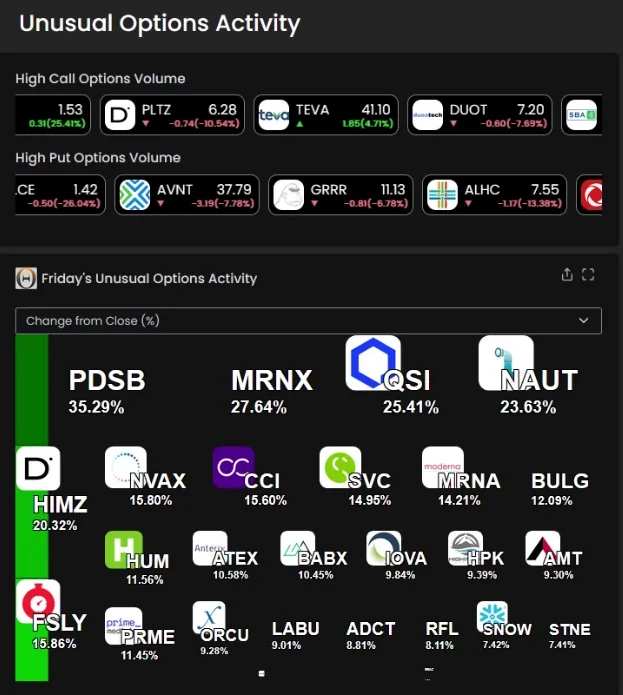
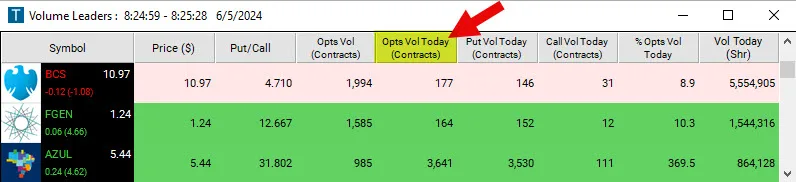
The Unusual Options Activity heat map and Top Lists (Screeners) run in the Web Dashboard. See the unusual options activity heat map, how we compare in the best unusual options activity scanners, and the breaking news stock scanner.
Big options volume can be a hedge, a spread or a roll, not a bet on direction.
Early in the day the percent can look high on a few trades. Check the contract count too.
Pair it with relative volume in shares too.
Free account, just an email. No card. Live access for a limited time.
It is a set of Trade Ideas filters that compare today’s option contracts to a stock’s normal full day. When the bets pile up, the stock shows up, often before the news.
Trading more contracts than usual. Options Volume Today (%) at 200 means twice the normal full day, and the day isn’t over yet.
Options Volume Today (Contracts) counts the total contracts so far today, puts and calls together. A minimum keeps out stocks where a few contracts look big on a percent basis. Since the day isn’t over, a reading of 200 at noon can keep climbing into the close.
Put/Call Ratio compares the two. A high number leans puts, a low one leans calls.
A high reading only says which way the volume leans. Some of those trades are hedges, not bets, so check the stock’s own chart and volume too. A low reading leans the other way, toward calls. Read it alongside the options volume, not on its own.
The Unusual Options Activity heat map and Top Lists (Screeners) run in the Web Dashboard. See the heat map page.
The same filters work in a Top List you build yourself. Add Relative Volume to see whether the stock is trading heavy along with the options. The Unusual Options Activity heat map shows the busiest names at a glance, and Top Lists update every 15 seconds.
You can try Trade Ideas with a free account, just an email, no card. Live access is for a limited time.
Yes. Sort a Top List by Options Volume Today (%) in the Web Dashboard. It updates every 15 seconds.
No. It means traders are active. It often shows up before news, but plenty of times nothing follows.
Past results, including backtests, don't guarantee future results.
Free account, just an email. No card. Live access for a limited time. Ready to buy? See plans & pricing

