


Put/Call Ratio
Table of Contents
- Understanding the Put-Call Ratio Filter
- Put-Call Ratio Filter Settings
- Using the Put-Call Ratio Filter in Trading
- FAQs about the Put-Call Ratio
Understanding the Put-Call Ratio Filter
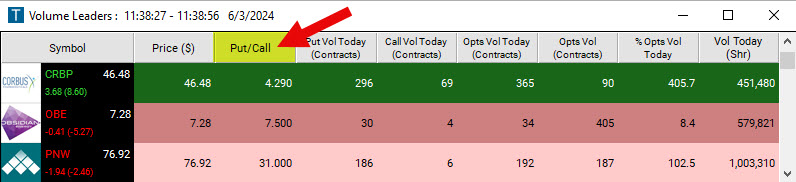
The Put/Call Ratio is a popular sentiment indicator in the stock market. It is calculated by dividing the number of traded put options by the number of traded call options.
A Put Option is a financial contract that gives the holder the right (but not the obligation) to sell an asset at a specified price (strike price) within a predetermined time frame.
A Call Option is a financial contract that gives the holder the right (but not the obligation) to buy an asset at a specified price (strike price) within a predetermined time frame.
To visualize this, imagine the stock market as a big sports game. Traders are like spectators placing bets on which team will win or lose.
-
Put Options, in simple terms, are a bet that the team or asset will lose or go down in value.
-
Call Options, in simple terms, are a bet that the team or asset will win or go up in value.
-
The Put/Call Ratio, in simple terms, is comparing the number of bets on the losing team to the bets on the winning team.
Interpretation of the returned ratio:
-
Ratio Above 1: If there are more bets on the losing team (puts) than the winning team (calls), the ratio is above 1. This could indicate that people expect the team (or stock) to perform poorly, suggesting a bearish sentiment (i.e., traders expect prices to go down).
-
Ratio Below 1: If there are more bets on the winning team (calls) than the losing team (puts), the ratio is below 1. This means people are optimistic about the team (or stock) suggesting a bullish sentiment (i.e., traders expect prices to go up).
-
Ratio around 1: If the bets are equal, the ratio is around 1. It's a tie in expectations.
In simple terms, the Put/Call Ratio helps us understand what the crowd thinks – whether they're feeling good or bad about a stock or the market. But just like sports predictions, it's not always right, so traders should use it as just one of many tools when making decisions.
Some traders believe that extremely high or low put/call ratios can be contrarian indicators. If too many people bet one way, it might be a sign that the opposite will happen (like a surprise upset in sports). For example, if the ratio is extremely high (i.e., a lot of bearish bets), it could indicate that the market is overly pessimistic and might reverse soon.
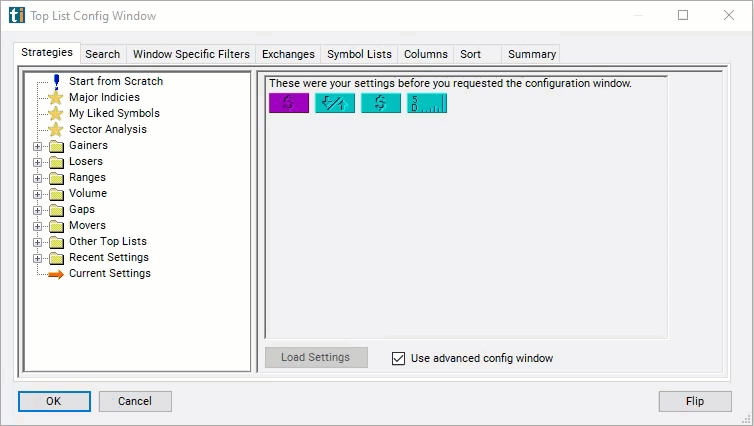
Put-Call Ratio Filter Settings
Activating the Put/Call Ratio Filter is straightforward. You'll find its settings under the Window Specific Filters Tab in your Alert and Top List Configuration Window.
You can set a minimum and/or maximum value, and stocks that don't fit within your parameters are automatically excluded from your scan results.
-
To find stocks with at least three times as many puts as calls, add the Put/Call Ratio Filter to your scan and enter 3 in the minimum field in the Windows Specific Filters Tab.
-
To find stocks with at least twice as many calls as puts, add the Put/Call Ratio Filter to your scan and enter 0.5 in the maximum field in the Windows Specific Filters Tab.
-
To find all option-able stocks, add the Put/Call Ratio Filter to your scan and enter 0 in the minimum field in the Windows Specific Filters Tab. This will show you all stocks which have had options activity today.
Using the Put-Call Ratio Filter in Trading
The Put/Call Ratio is an invaluable sentiment tool for traders looking to gauge market sentiment. Here are some strategies traders can employ:
- Contrarian Strategy: When the Put/Call Ratio reaches extreme levels (either too high or too low), it can be indicative of a market that's overly pessimistic or optimistic. At these levels, a contrarian might:
-
Buy stocks or indices when the ratio is extremely high, signifying the market is overly bearish and could be nearing a bottom. Remember the sports analogy: if too many are betting against a team, there's a chance of a surprise upset.
-
Short stocks or indices when the ratio is extremely low, suggesting the market might be overly bullish and could be nearing a top.
- Trend Confirmation: Some traders use the Put/Call Ratio to confirm existing market trends. For instance:
-
If the market is in an uptrend and the Put/Call Ratio remains below 1 (more calls than puts), it can be seen as confirmation that the uptrend is strong and might continue.
-
If the market is in a downtrend and the ratio remains above 1 (more puts than calls), it can confirm the strength of the downtrend.
- Filtering Trade Opportunities: Using the Put/Call Ratio Filter settings as mentioned above can help traders filter out potential trade opportunities:
-
If a trader is bullish, they can set their scanner to show stocks with a Put/Call Ratio below 1, indicating more bullish bets.
-
If bearish, they can set their scanner to display stocks with a ratio above 1, suggesting more bearish sentiment.
By filtering in this manner, traders can focus on stocks that align with their market outlook and thus improve the odds of a successful trade.
While the Put/Call Ratio provides a glimpse into market sentiment, it's crucial to combine it with other technical and fundamental analysis tools. No single indicator can provide a complete picture, and traders should always be wary of relying too heavily on one piece of data.
Moreover, it's essential to understand that sentiment can change rapidly. Therefore, staying updated and regularly checking the Put/Call Ratio and its interpretations, especially during volatile market periods, can offer traders an edge in making informed decisions.
FAQs about the Put-Call Ratio
What is the Trade Ideas Formula for the Put/Call Ratio Filter?
Our formula for the Put/Call Ratio Filter is as follows:
[PCR] = [PTV]/[CTV]
Here is a breakdown of the components:
-
[PCR]is the Trade Ideas code for the Put/Call Ratio -
[PTV]is the Trade Ideas code for Put Volume Today -
[CTV]is the Trade Ideas code for Call Volume Today
Is there a way to only find stocks with no options activity by using the Put/Call Ratio Filter?
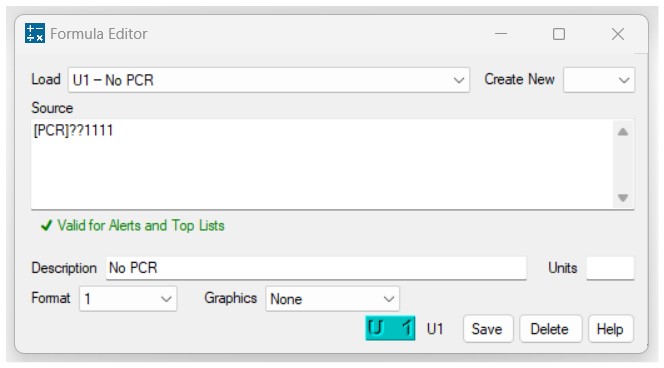
To find stocks with no options or illiquid options, you will need to create a custom filter with our Formula Editor.
Entering 0 in either the minimum or maximum field won't work for the following reason. In data applications, Null (or Blank) represents the absence of a value. It's not the same as zero; it's a lack of data or an unknown. Null indicates that a particular piece of data doesn't exist or hasn't been recorded. 0, on the other hand, represents an actual numerical value. It signifies the absence of quantity but is a valid data point by itself. Setting a filter for "0" won't capture these blanks. Instead, it'll show records where the Put/Call Ratio is genuinely zero, meaning the number of puts and calls is equal, which is an entirely different scenario from there being no data at all.
The formula you could use to find stocks with a blank Put/Call Ratio column is as follows:
[PCR]??1111
The formula essentially says, "Give me the Put/Call Ratio of a stock, but if it's unknown (null), then use the default value 1111."
It is a workaround to highlight or filter stocks where the Put/Call Ratio data is missing. This method replaces the blank or null value with a unique number ("1111" in this case) to make it searchable and identifiable.
Here is a breakdown of the components:
-
[PCR]is our code for the Put/Call Ratio of a stock. -
??If the Put/Call Ratio can't be calculated due to no options activity, then it would result in a null or blank value, because there's no specific number or value to show. The ?? operator is a way to give a default value in cases where the result would be null. It's like saying, "If the result is unknown, then use this default value instead. -
1111is a signifier number, that will be assigned to the blank column. It could be any other number as well. Ideally, it is a distinct number that stands out and makes it easy for a trader to distinguish it from a "real" number.
So, in simple terms:
-
If a stock has a Put/Call Ratio, this formula will display that ratio.
-
If the stock doesn't have a Put/Call Ratio or it can't be calculated, this formula will display the number 1111 instead of leaving it blank.
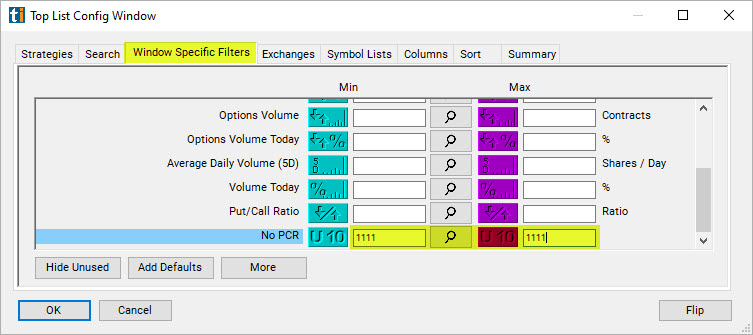
To visualize this, here is a scan that contains the above custom filter, here called No PCR, as well as the Put/Call Ratio Filter.
You will see that the No PCR custom filter will display 1111 whenever the Put/Call Ratio Filter column is blank (see red x in the screenshot):
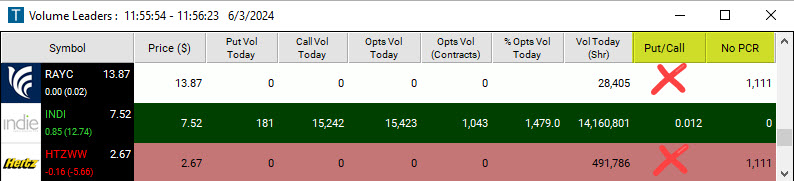
To only find stocks without options or with illiquid options, add the No PCR custom filter to your scan and enter 1111 in the minimum field and 1111 in the maximum field in the Windows Specific Filters Tab. This way, you will only see stocks with no options data.
Are there external factors, such as news or events, that can heavily influence the Put/Call Ratio?
Yes, external factors like earnings reports, economic news, geopolitical events, and more can lead to increased options activity and can sway the ratio significantly. Moreover, large institutional trades or hedging activities can also temporarily skew the ratio. It's always good practice to be aware of any significant news or events that could influence trading activity.
How accurate is the Put/Call Ratio as a contrarian indicator?
While many traders use the Put/Call Ratio as a contrarian indicator, it's not infallible. Extremely high or low ratios can indicate potential market reversals, but they don't guarantee them. It's essential to use the Put/Call Ratio in conjunction with other analysis tools and not solely rely on it.
What is considered an "extreme" value for the Put/Call Ratio?
The definition of "extreme" can vary among traders and analysts. Historically, readings well above 1 may be considered bearishly extreme, suggesting potential reversals to the upside, while readings significantly below 1 might be seen as bullishly extreme, hinting at potential downturns. The exact thresholds might depend on historical norms for the specific stock or market being observed.
General Guidelines for "Extreme" Values in the Put/Call Ratio:
- Broad Market Indices:
-
Bearishly Extreme: Ratios of 1.2 and above have been historically considered bearishly extreme for broad market indices. This suggests that there's a significant amount of bearish sentiment in the market. As a contrarian indicator, it might hint at potential bullish reversals. Example: In 2008, the put/call ratio for the S&P 500 index reached a high of 2.67. This was an extremely bearish signal, and it preceded the market's sharp decline in the following months.
-
Bullishly Extreme: Ratios below 0.6 for broad market indices might be deemed as bullishly extreme, suggesting a lot of optimism in the market. Contrarians might view such levels as potential precursors for bearish reversals. Example: In 2013, the put/call ratio for the VIX index (a measure of implied volatility) reached a low of 0.14. This was an extremely bullish signal, and it preceded the market's strong rally in the following months.
- Individual Stocks:
-
Bearishly Extreme: For individual stocks, a Put/Call Ratio above 1.5 might be seen as very bearish, especially if the stock typically has a ratio closer to 1.0. However, remember that individual stocks can have more volatility, and sudden news or events can drastically affect their ratios.
-
Bullishly Extreme: For individual stocks, a ratio below 0.5 could suggest significant bullish sentiment. However, as always, context is crucial. If a stock recently had good news or positive earnings, this ratio might be expected.
- Sector-specific nuances:
Some sectors might have inherent biases due to their nature. For example, more speculative sectors might naturally have higher call activity, skewing their typical Put/Call Ratios. It's vital to know the norms for each sector you're analyzing.
How do I factor in the volatility of options when using the Put/Call Ratio?
Options volatility, often measured by indicators like the VIX, can impact the Put/Call Ratio. During high volatility periods, there might be increased options activity as traders hedge or speculate more. It can be beneficial to track volatility indicators alongside the Put/Call Ratio to get a clearer picture of the market sentiment.
Why might a stock have a blank or missing Put/Call Ratio?
A blank Put/Call Ratio usually indicates that there was no options activity for that stock on a particular day, or the options are illiquid. It could also be due to a lack of available data from our data provider.
How often is the Put/Call Ratio updated?
The Put/Call Ratio is updated in real-time.
Is there an optimal time during the trading day to analyze the Put/Call Ratio?
While the ratio can be monitored throughout the trading day, many traders pay special attention during the opening and closing hours, as these periods can exhibit increased trading activity and might offer insights into institutional sentiment. However, to reduce the noise from intraday fluctuations, some traders prefer to analyze the end-of-day ratio.
Filter Info for Put/Call Ratio [PCR]
- description = Put/Call Ratio
- keywords =
- units = Ratio
- format = 3
- toplistable = 1
- parent_code =