Each live page helps investors and traders gather key details on any stock
before placing a trade.
Stock price & ranges
See the latest price, the day’s change and the session’s high–low range. Then compare
that move with the 52-week range, year-to-date performance and distance from prior highs.
Use the range view to judge whether today’s print sits inside a familiar band or is stretching
into new territory.
Momentum & volume
Trader tip
Volume and momentum sit beside the
price, so you can see whether trading looks light or heavy. That helps explain why the stock is moving
now, not just where it closed.
Financial strength
Key point
Company financials on the same page:
market capitalization, revenue and income, cash and debt, P/E, short
float, and beta.
Key point
Size and solvency stay next to price
and peers, so you are not bouncing between quote and fundamentals tabs.
Peer comparison
Peers put the ticker next to sector and industry neighbors. Compare relative strength, spot names that
lag or lead, and decide whether the move is about one stock or the
whole sector. Then look up another symbol if you need to.
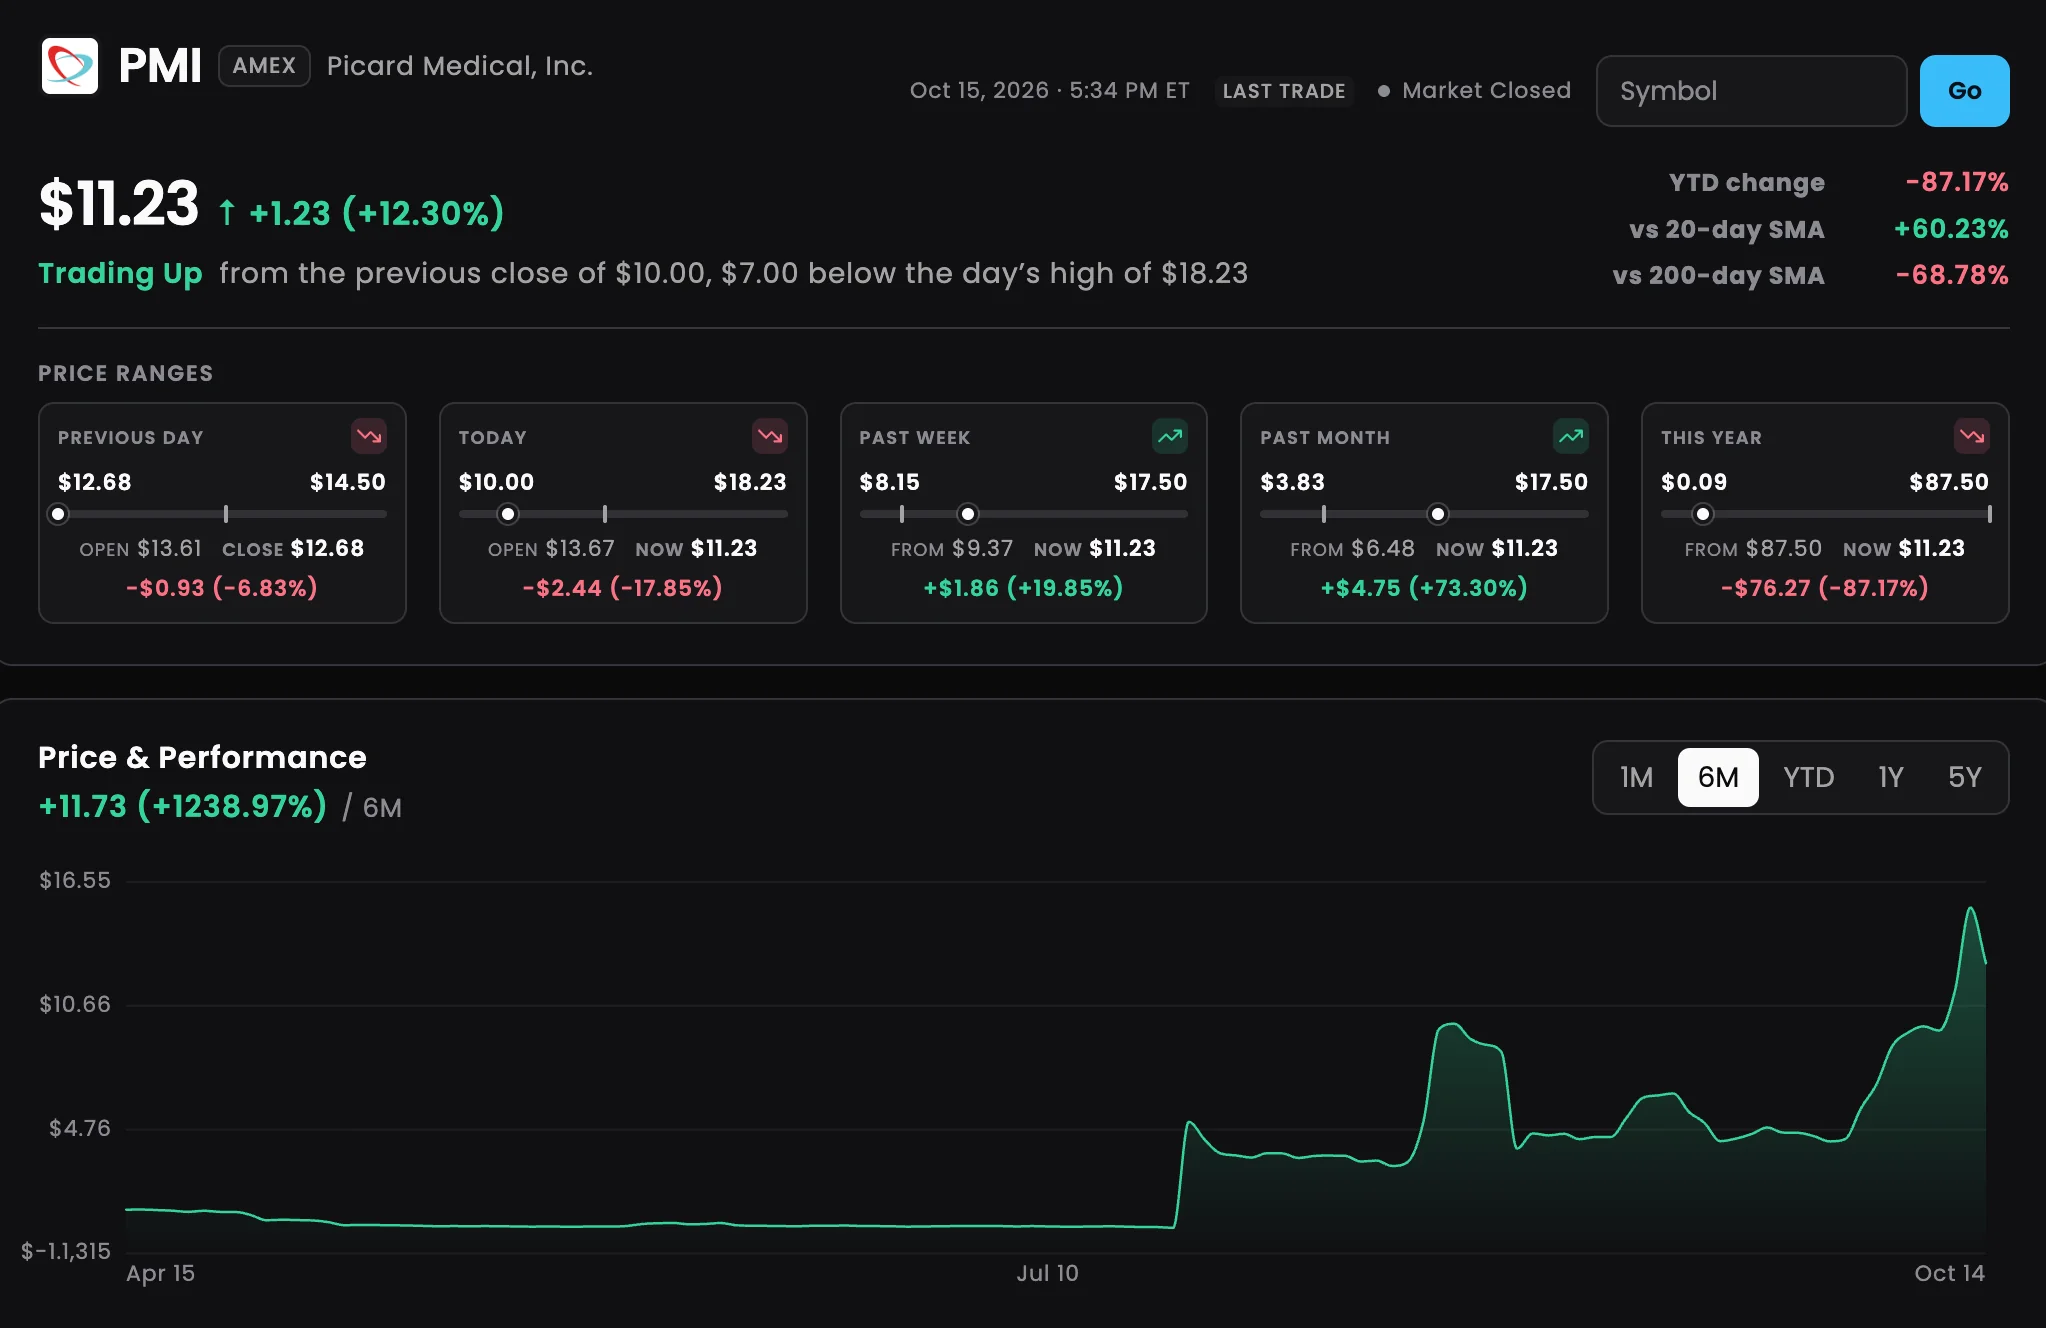
An example Stock Info page: the latest price and how today’s move compares with recent
ranges, plus a price chart you can view from one month to five years.
Why Trade Ideas data
Key point
Real-time data from every US exchange,
plus all off-exchange trades and the NBBO, not a delayed or Nasdaq-Basic-only feed. It powers these
research pages and Trade Ideas Pro. Company financials and peer fields are Trade Ideas research data on
the same ticker page. More: Data Difference. Example:
trade-ideas.com/stock-info/AAPL/.
Stock Information — FAQ
What is Trade Ideas Stock Information?
Trade Ideas Stock Information is a web research page for a single U.S. stock symbol. Three lookups a day are free; after that, create a free account to keep opening more tickers. Each page shows price and ranges, volume and momentum context, company financials, and peers.
Where do Stock Info numbers come from?
Price and volume come from the same Trade Ideas real-time feed that runs Trade Ideas Pro. Company financials and peer fields are Trade Ideas research data on the same ticker page. Live versus delayed display depends on your access level: Pro desk users see live session data; some public web views are delayed.
Can I research any stock symbol?
Yes for listed U.S. equities covered by Trade Ideas. Type a symbol such as AAPL into the lookup above, or open a ticker URL directly — for example AAPL Stock Information. Coverage focuses on U.S. listed stocks; symbols outside that universe will not return a full page.
Is Stock Information free, or do I need Trade Ideas Pro?
Three Stock Information lookups a day are free on the Trade Ideas website. After that, create a free Trade Ideas account to unlock more ticker pages. You don’t need a Trade Ideas subscription for the research pages. Trade Ideas Pro is the optional desktop software with live alerts, AI signals and charts. The Trade Ideas Web Dashboard is a separate, lighter web overview; open a free account if you want to try it next.
Ready for the full Trade Ideas desk?
Start Trade Ideas for live alerts, AI signals and the Pro desk. Or try the Web
Dashboard first with a free account.