Who is Holly?
Our Virtual Trade Assistant Holly is designed to provide real-time stock suggestions to our premium clients.
Holly learns from the past and approaches every new day with non-emotional precision. With over 60 carefully curated algorithms in her portfolio, she is a skilled and versatile trader to follow.
Holly's trading signals include entry prices, stops, and targets. You can see her trades as she enters and exits them as well as her success rate.
There are usually between 5 to 25 trades in total per day. Holly is an intraday trader and does not hold positions overnight.
Holly only trades her own algorithms and they are not customizable.
To see Holly Trading in Action, browse through our 📢 Trade Ideas AI Performance Updates 🆕.
What Holly Does
Holly backtests all her over 60 strategies every night. Thereafter, she goes through each strategy one by one and optimizes it. If she, for example, finds that stocks over $20 perform inadequately in a particular strategy, she will remove this price range and run another test to check if the performance has improved.
Holly will repeat the same process with all other parameters until the strategy performs optimally in the backtest. A process that would take a human many days, is performed by Holly over the course of a few hours at night.
After this extensive backtest and optimization process, Holly will analyze what the overall markets are doing.
At the end of the night, she will select only the strategies with the highest statistical chance to deliver profitable trades for the upcoming trading day. These are the strategies that you will find in the AI/Holly Strategy Window in the mornings. On average, Holly enters between 5 and 25 trades per day based on various strategies.

Holly's Strategies
The over 60 strategies our AI employs are described below. The parameters are proprietary and cannot be customized.
The 5 Day Bounce
The trigger for this alert has to cross above resistance while also making a 60 minute high on stocks that are trying to bounce from the lows of their 5-day range. The max price of stocks will be $20. The strategy looks to go long on an oversold reversal strategy. Consult the main AI window for this strategies’ target, hold time and stop type.
Alpha Predators
This strategy looks for momentum stocks under 20 dollars to buy on a pullback trigger as the event to go long. These stocks will be green on many time frames from 5-day to 5 minutes. There are numerous filters looking at moving averages and changes in price over the last hour. We need at least 1 consecutive green candle coming in on the current day. Consult the main AI window for this strategies’ target, hold time and stop type.
Bon Shorty (Short)
A short-selling strategy that looks to jump on momentum. The trigger is a breakdown of resistance as defined by Trade Ideas data for stocks between 15 and 85 dollars. The stock must be down from the previous day. The S&P 500 cannot be up very much in the last 5 minutes. Consult the main AI window for this strategies’ target, hold time and stop type.
Breakout
This long strategy uses the crossing above resistance as the entry event. On higher than normal relative volume, the stock must be between $10 and $150 with at least 125k shares being already traded today. Additionally, the stock will be above the midpoint of the previous day’s range. This strategy ensures that the leading market indicator used has not moved more than 0.5% in either direction over the past 30 minutes. Consult the main AI window for this strategies’ target, hold time and stop type.
Bullish Pullback
Looks for strong stocks pulling back 25% to create the entry trigger. These stocks will include a max price of 100 in the scan and a minimum of 20 dollars (where “Strong Stocks Pulling Back” left off). Consult the main AI window for this strategies’ target, hold time and stop type.
Bullish Trend Change
The strategy is triggered, when stocks over $20 are crossing above resistance with a 60 minute high. Consult the main AI window for this strategies’ target, hold time and stop type.
Buyers Stepping
In A strategy that uses our Fibonacci pullback as the trigger to go long. This is a pullback entry concept. Stocks from 50 cents to 30 dollars will show up on this alert. The pullback entry will be on a stock that is already up nicely on the day and the S&P 500 has to be positive for the day. Consult the main AI window for this strategies’ target, hold time and stop type.
Close to a Cross
This strategy triggers when a stock has a strong intraday move and a very short-term proprietary moving average crosses the 50-Day SMA. These moving average crossovers are followed closely by institutions which can cause huge buying pressure after the alert.
The Continuation
Stocks between 50 cents and 50 dollars make up this strategy. The trigger is a new 30 minute high if the stock had 2 consecutive up days coming into the present day. Thus the name “continuation”. The daily range for this candle will be a wide range above normal. Consult the main AI window for this strategies’ target, hold time and stop type.
Count de Monet
Looks for stocks to go long that are making a resistance breakout to a 5-Day High area. This strategy is focused on stocks under $40 with small to medium-sized float. The S&P 500 needs to have a green 5-minute candle. Consult the main AI window for this strategies’ target, hold time and stop type.
Cuts Like a Knife (Short)
Another short-selling strategy that looks for a breakdown of support (as defined by Trade Ideas data). The trigger to go short is Crossed below Support on stocks up to 100 dollars. The earnings filter is turned on to play stocks that just had earnings in the last day to look for downward momentum to ride from the earnings news. Consult the main AI window for this strategies’ target, hold time and stop type.
Downward Dog (Short)
This is simply a breakdown of a channel (as defined by Trade Ideas data). A short-selling momentum strategy that looks for stocks under 50 dollars. Consult the main AI window for this strategies’ target, hold time and stop type.
Downward Momentum (Short)
A short-selling strategy that looks to pile on the selling. A downward break of the opening 30-minute range is the trigger to go short here. The price of this strategy will focus on stocks between 20 and 100 dollars and the S&P has to be negative in the last 15 minutes. This strategy also looks at a long-term filter to ensure the stock is in a daily downtrend. Consult the main AI window for this strategies’ target, hold time and stop type.
Early Bird
Stocks under $20 that are crossing above an algorithmic resistance level on slightly higher than normal 5-minute volume. The volume today is currently under 1m shares. Ranges for the 10 day, 120 minute and 15 minutes are capped so as it catch the move early. Consult the main AI window for this strategies’ target, hold time and stop type.
Float On
Stocks from 1 to 100 that are crossing above short-term resistance is the trigger for this long side strategy. There are numerous filters for moving average relative strength and only scans for low float stocks under 20 million shares. Market filters also ensure that the S&P 500 is showing strength on the day and in short-term time frames. Consult the main AI window for this strategies’ target, hold time and stop type.
Got Dough Wants to Go
This strategy will focus on large float stocks, mid-high cap stocks that are showing momentum on the daily and the intraday charts. The S&P 500 needs to be positive on the day. The trigger to go long this strategy comes from the 30-minute high event. Consult the main AI window for this strategies’ target, hold time and stop type.
Horseshoe Down
Looks for a gap down in price with an attempt to come back up and fill a portion of the gap. The alert triggers to go short if the price moves back below the prior low of the gap opening. The exact opposite of “Horseshoe Up” Consult the main AI window for this strategies’ target, hold time and stop type.
Horseshoe Up
Looks for a gap up in price with an attempt to come back down and fill a portion of the gap. The alert triggers to go long if the price moves back above the prior high of the gap opening. Consult the main AI window for this strategies’ target, hold time and stop type.
Knocking On Resistance (Short)
A short strategy that looks to fade the upward movement of stocks under 20 dollars using a breakout of the opening range but right into a level of resistance (R1) as defined by Trade Ideas technology. Consult the main AI window for this strategies’ target, hold time and stop type.
Little Big Guy
This strategy focuses on stocks under 8 dollars. The trigger is a minimum 5 hour level of resistance. This strategy has market filters that look at the S&P 500 to make sure it is not too negative on the day. Consult the main AI window for this strategies’ target, hold time and stop type.
Looking for a Bounce
Here the A.I. is looking for a 30-minute opening range breakdown at a certain level of support that will look to bounce off support and go long based on the filters used here. The max price for this strategy is 20 dollar stocks. Consult the main AI window for this strategies’ target, hold time and stop type.
Mighty Mouse
Stocks from 50 cents to 5 dollars that are crossing above resistance as defined by Trade Ideas data is the idea behind this strategy. The stock must be up compared to yesterday and wait 15 minutes before this event triggers. The name Mighty Mouse suggests stocks under 5 dollars that are showing upward opportunities early in the day. Consult the main AI window for this strategies’ target, hold time and stop type.
Nice Chart
Numerous filters make up this long strategy. The trigger is a New High above yesterday’s high but with many more filters looking at market strength, moving averages, and RSI in the short term. The max price for this strategy is 80 dollars. Consult the main AI window for this strategies’ target, hold time and stop type.
Nickelback
Nickelback is basically the same concept as “Quarterback” but only monitors a symbol list of stocks that trade in 5 cent increments in hopes of making a better spread on entry and exit. A pullback of 25% is still needed for the entry trigger. Consult the main AI window for this strategies’ target, hold time and stop type.
No Fear Short Here (Short)
The trigger of this is a locked or crossed market (bid and offer are the same or even crossed). A short-selling strategy that looks at Nasdaq and S&P market filters and downward momentum to trigger a short selling opportunity. The price window for this short momentum strategy is 50 cents to 8-0 dollars. Consult the main AI window for this strategies’ target, hold time and stop type.
Not a Double Bottom (Short)
The trigger for this short sell alert is what appears to be a double bottom but breaks down thru support. Stocks from 10 to 100 dollars make up this strategy and the change is 1 minute period is a significant down move. Market filters do not allow for the S&P 500 to be up too much in the last 15 minutes. Consult the main AI window for this strategies’ target, hold time and stop type.
On Support
This is very similar to the “Looking for a Bounce” strategy as it is looking for a breakdown in the opening 30-minute range. However, this strategy looks at only stock above 20 dollars that are bouncing off support as defined by the filters used. Consult the main AI window for this strategies’ target, hold time and stop type.
Power Hour Long
Looks to buy strong stocks relative to the previous day and only in the last hour of the day. The S&P 500 must be up in the last 10 minutes as a market filter. Consult the main AI window for this strategies’ target, hold time and stop type.
Power Hour Short (Short)
Looks to short weak stocks relative to the previous day and only in the last hour of the day. The S&P 500 must be down in the last 10 minutes as a market filter. Consult the main AI window for this strategies’ target, hold time and stop type.
Pushing Through Resistance
The signal is triggered by a 30-minute opening range breakout to go long. This strategy is set to wait for around 40 minutes after the open before any alert would trigger. There needs to be positive movement in the trailing 15 minute period as well. Consult the main AI window for this strategies’ target, hold time and stop type.
Putting on the Brakes
Similar to “Knocking on Resistance” but for stocks above 20 dollars and more filters to ensure the 5-day range is not too strong. The 30-minute relative weakness in the S&P 500 is also considered. Consult the main AI window for this strategies’ target, hold time and stop type.
Quarterback
Looks for strong stocks that had a significant move upward then pulls back 25% for the entry trigger. Stock prices will be 5 to 100 dollars and relative volume needs to be above normal. The A.I. has added many RSI filters and the stock must be up from yesterday’s close. Consult the main AI window for this strategies’ target, hold time and stop type.
Selling Strength (Short)
This is similar to “Topping Formation” but for stocks above 20 dollars. Market filters require the S&P 500 to not be positive. Consult the main AI window for this strategies’ target, hold time and stop type.
Slippery Slope (Short)
This short selling strategy uses a new 5 minute low as the entry trigger. Stocks between the price of 50 and 200 are monitored for weakness relative to the prior day and also the 10-day and 1-year range with negative momentum coming into the current trading day. Consult the main AI window for this strategies’ target, hold time and stop type.
Staggering Volume
This one is looking for stocks making new highs that are off the chart in terms of relative volume, 5-minute volume, and 1-minute volume. There is a short squeeze component as well using the “days to cover” filter. “Position in Range” filters under 60-minute time frames are also used here. These stocks will be fast movers in general. Stocks above and under 5 dollars are in play with this strategy.
Strong Stock Pulling Back
This strategy is triggered by a 25% pullback from highs on stocks that are showing strong volume and price movement relative to the S&P 500 even on a weak day. Stocks under 20 dollars only in this strategy. Consult the main AI window for this strategies’ target, hold time and stop type.
Sunrise Mover
This strategy is set to be active after only 5 minutes into the day and stops being active 45 minutes after the bell. Stocks between 3 and 80 dollars are scanned for a break above short-term resistance as the trigger to go long if the S&P 500 is positive. There are numerous filters added by the A.I. looking at moving average relative strength across the board. Consult the main AI window for this strategies’ target, hold time and stop type.
Tailwind
This long strategy uses a pullback in price to trigger the entry. Stocks that have a complex setup of moving averages and are positive across the board on those moving average and volume filters are considered. The max price of this strategy is 60 dollars. Consult the main AI window for this strategies’ target, hold time and stop type.
Topping Formation (Short)
This is a short-selling strategy that looks to fade an overbought situation with a new 5 day high being the trigger to go short. The price window will be stocks between 10 and 20 dollars. Market filters require the S&P 500 to not be positive. Consult the main AI window for this strategies’ target, hold time and stop type.
Trend Play
Uses a proprietary moving average ribbon to identify when a stock is in a strong trend. For this play to trigger both on the daily and intraday charts need to be aligned with the same trend using the same metric. This makes stocks interesting to long-term players which will in a lot of cases push the price for shorter-term players.
Trend Play Short (Short)
Same as the Trend play (see above). But this strategy is looking for downtrends that can trigger a short sell signal.
The Vault
A long strategy that looks for oversold conditions in stocks between 9 and 30 dollars. The current price is likely near the low of the 10-day range. The event is triggered by crossing back thru yesterday’s resistance. This strategy has many additional filters; too many to list here.
Volume Doesn't Lie
This strategy looks for stocks that are up at least 4% and doing at least 2 times normal volume. The volume is the trigger and the theory is that the price action will continue in the same direction as the gap. This was originally designed for multi-day holds, but was reconfigured for Holly (so keep that in mind). Consult the main AI window for this strategies’ target, hold time and stop type.
Wake Up Call
This strategy looks for stocks to buy under 20 dollars making new highs with low float size. There are numerous filters for intraday moving averages and price action filters in the last 15-30 minutes that the A.I. has added. The stock needs to be up a bit in the last 5 minutes before it triggers as well. Consult the main AI window for this strategies’ target, hold time and stop type.
Yesterday Hammer Today Strength
This is searching for your textbook hammer candle to have happened yesterday. This pattern shows sellers being rejected after trying to push the price lower. The alert triggers after a stock has shown strength in the current trading day and has pushed through resistance.
Engulfing
This watches the current day's action to see if a possible engulfing candle is forming (today's low lower than yesterday's and today's high higher than yesterday's). This looks to trigger after both sides of that equation are made and we are showing some intraday strength.
AVWAP Bounce
The strategy uses a multi-day Vwap to find stocks that are not only bouncing off today's VWAP but yesterday's as well.
The Guiding Hand (Long)
Both of these are looking at the same thing just reversed. We are looking at stocks that are gapping and the basing sideways looking for a short-term moving average to catch up to price and push it higher.
Balloon Under Water/The Anvil (Short)
These are revisions to the mean algos that are looking for stocks that have drifted away from what our algos are looking at for “fair value”. It looks to take the other side of the move after momentum has shifted.
The Guiding Hand (Short)
Both of these are looking at the same thing just reversed. We are looking at stocks that are gapping and the basing sideways looking for a short-term moving average to catch up to price and push it higher.
Bon Shorty 2.0
The original user-generated AI algorithm is back. Just like Holly grails version, this is looking for a stock that was weak yesterday selling off today. Also known as a second-day play.
Pushing The Spring
This looks for a tight consolidation on the daily chart and a breakout the following day.
Pulling The Arrow Back
Looking at yesterday's trading we are looking for sellers failing to keep prices low yesterday causing a late-day bounce. Bullish action the following day is often great confirmation of the next move.
Failed Bounce (Short)
This is the opposite of pulling the arrow back where we are looking for a rejection of buyers in yesterday's action to continue today.
Bear/Bull Trap (Short)
This is looking for the classic trap pattern. Where a stock will break the high of yesterday just barely and then start to reverse forcing the other side to sell.
Revision To The Mean Long
This algorithm is looking to catch that falling intraday knife. Looking for a quick bounce in a weak stock.
Snap Back Long/Short (Short)
These are looking for reversion to the mean but on a daily basis instead of intraday day.
Separation From The 8
There are many ways to define “overbought”. In this case, we are looking at how much a stock has deviated from its 8 periods moving average.
Breakout long (Short)
Neo’s focus is on high-volume stocks that are currently in the news. For these algorithms, they are looking to take an early move on these stocks in the direction of the trend.
Pullback long (Short)
These algos look for the same Neo signature stocks in the news but are looking for them to base sideways before pushing higher.
Where to find Holly
You will find our Virtual Trade Assistant Holly in the Channel Bar in the channels named Holly AI and Long Term Holly AI.
If you would like to include Holly in your own layout, rather than using our preset Holly channels, you can open her individual windows from the Toolbar.
Click on New and select the Premium AI Strategy Window or the Premium AI Strategy Trades Window or the Premium AI Long Term Strategy Trades Window

Holly Windows
Overview: Holly Windows
The AI Strategy Window will list the strategies that Holly, after a long night of backtesting and optimization, has carefully selected for the upcoming trading day.
To see Holly’s trading in action, head to the AI Strategy Trades Window. All the trades that Holly enters during the day will appear here.
For detailed insight into the AI Strategy Window, head to this section.
For detailed insight into the AI Strategy Trades Window, head to this section.
For detailed insight into the AI LongTerm Strategy Trades Window, head to this section.
Show AI Trades
The trades of Holly will not only be presented to you in the AI Strategy Trades Window but also on the charts.
To enable this feature, right-click into your Chart, select Properties, and then Show AI Trades.
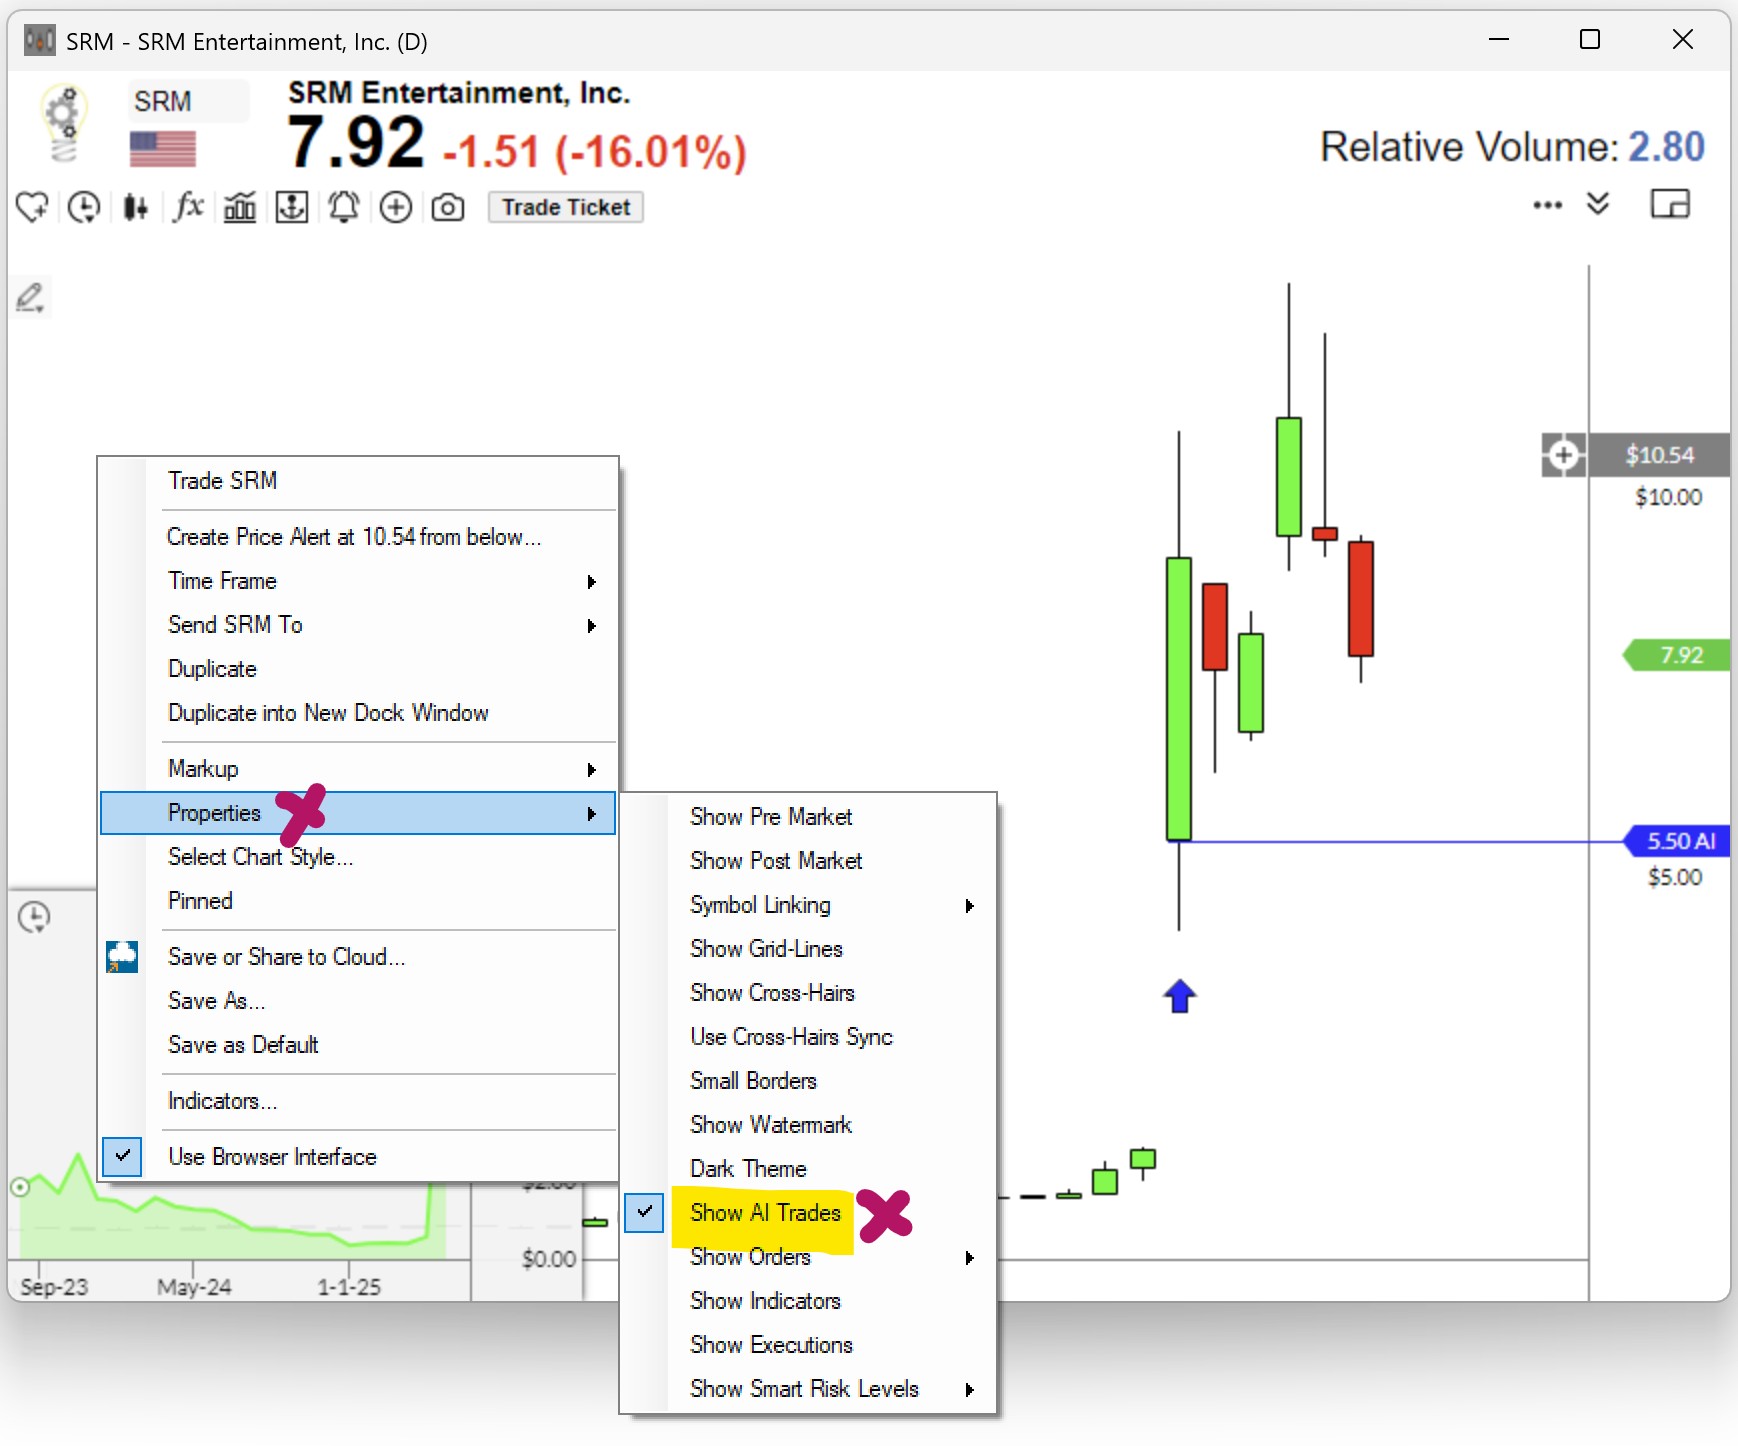
The AI trades will be displayed in a quick and easy-to-grasp visual format:
-
An upward-pointing arrow indicates the entry bar of a Long Trade.
-
A downward-pointing arrow indicates the entry bar of a Short Trade.
-
The blue line represents Holly's Entry Price.
-
A red line indicates the Stop Price.
Holly Visuals on Charts:
AI Risk Size Explained
By Default, the AI Risk Size is set to 100 shares per trade.
This setting can be adjusted to reflect your personal investment style. From the Toolbar choose Tools, select Options, and then AI Trade Size.

Here you have the choice between defining Holly’s entry parameters based on:
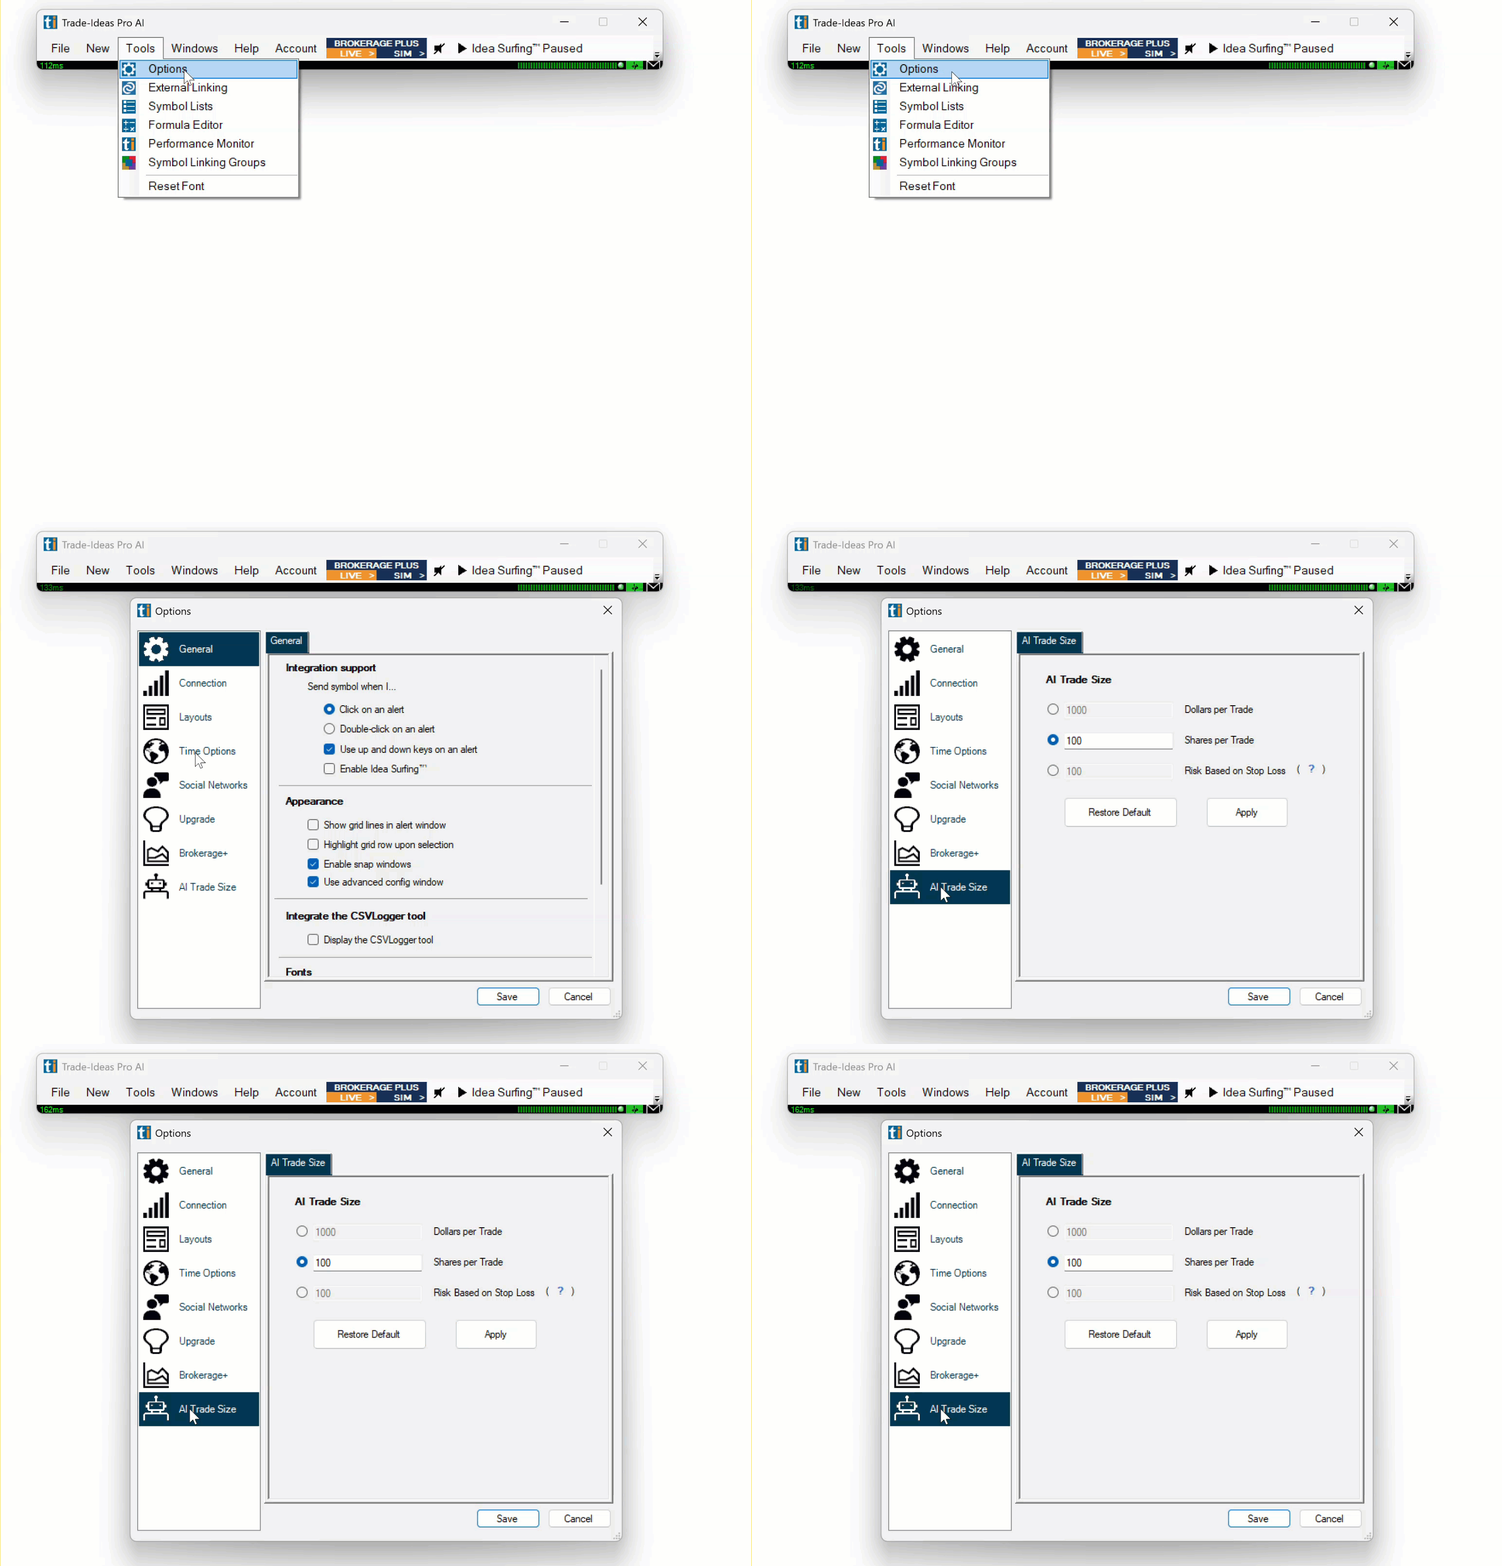
-
Dollars
If you entered $2000 as the amount and the stock price is $20, Holly will buy 100 shares. If the stock price is $40, she will only buy 50 shares.
-
Shares
You can enter a fixed number of Shares per trade to buy or short.
-
Risk
If you choose to risk $100 and Holly’s algorithmic stop loss per trade is $0,20, she will buy 500 shares per trade.
-
Default
By Default, the AI Profit & Loss is based on 100 shares per trade.
These settings will be used to calculate the Profit & Loss in both AI Windows.
AI Holly Strategy Window
The AI Strategy Window will list the strategies that Holly, after a long night of backtesting and optimization, has carefully selected for the upcoming trading day.
You will find it in the Toolbar under New, as well as in the Trade Ideas AI Channel.
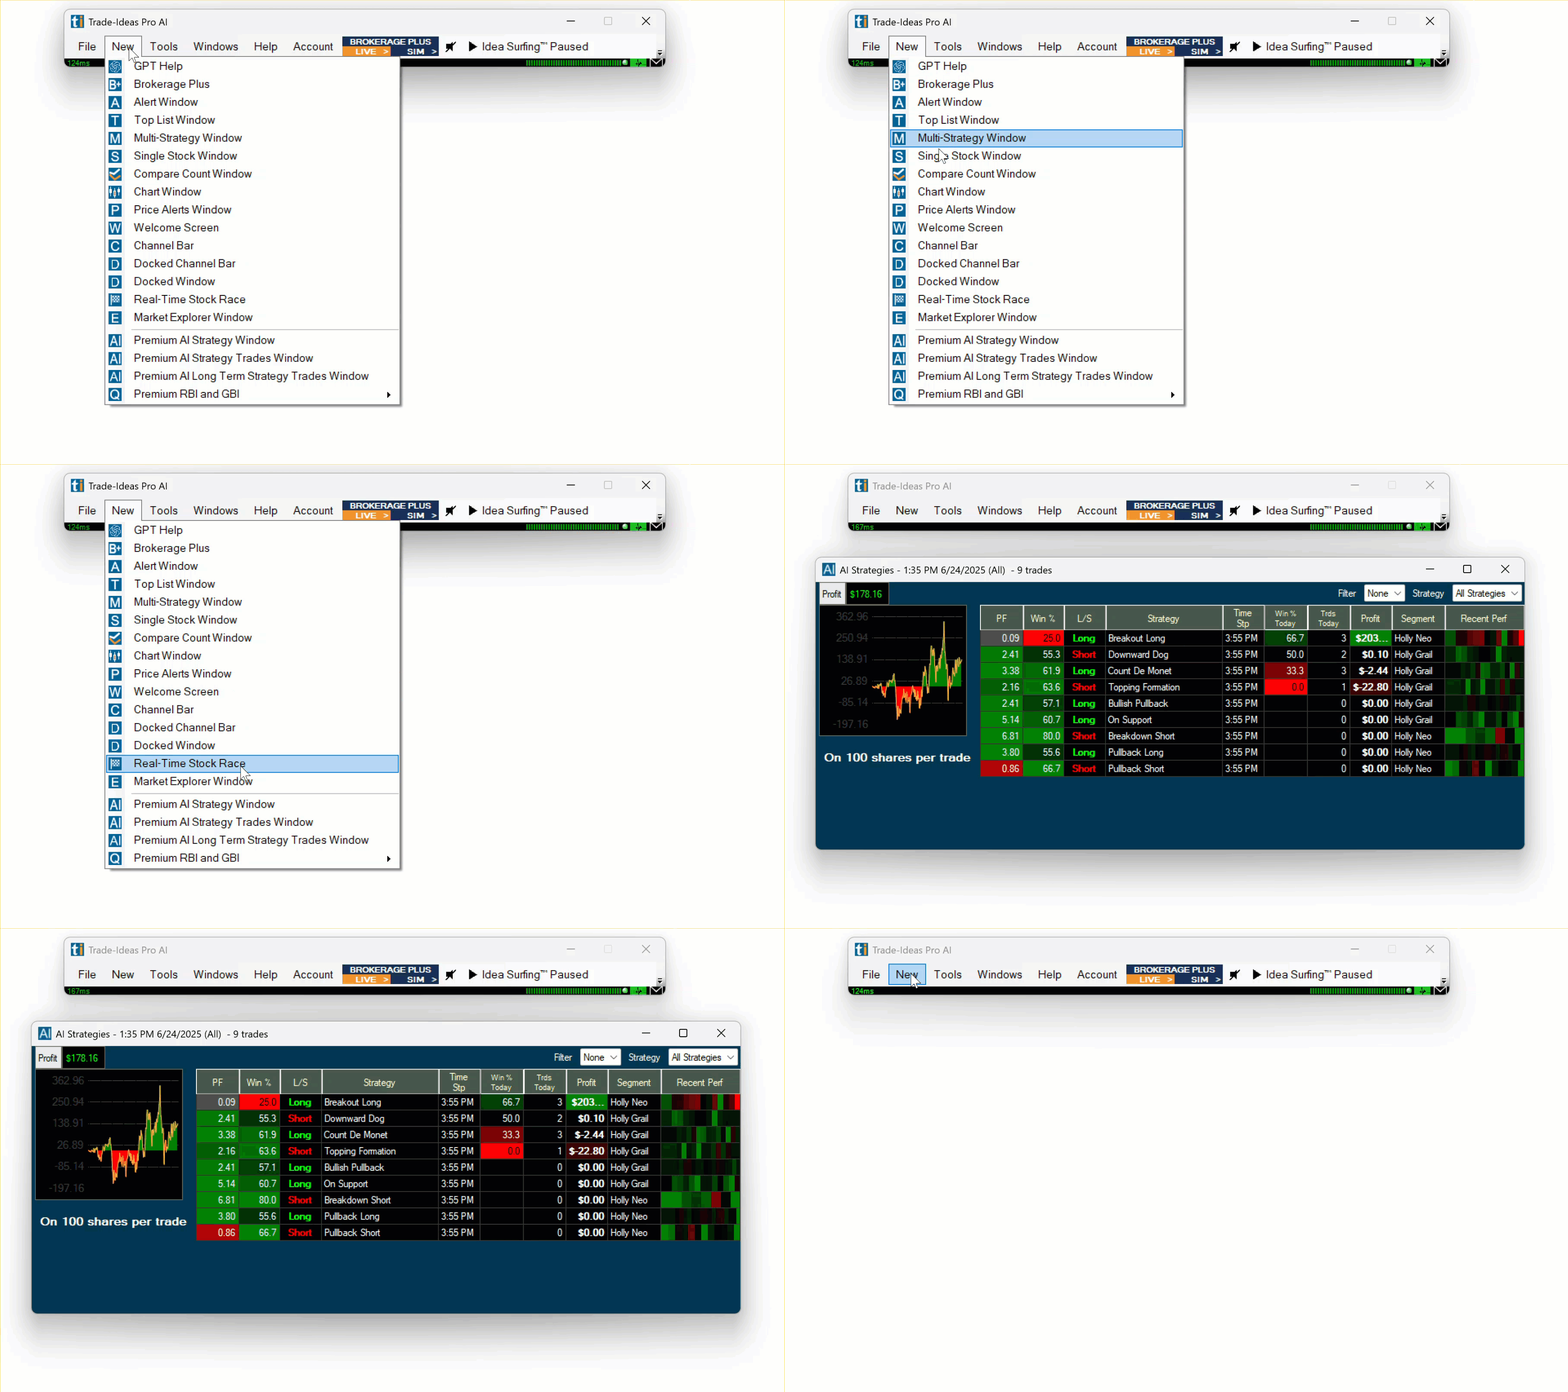
AI Strategy Window Overview:
Filters
The two filter dropdowns on the top right-hand side of the AI Strategy Window, enable you to filter by active, inactive, long, and short strategies, as well as individual strategies.
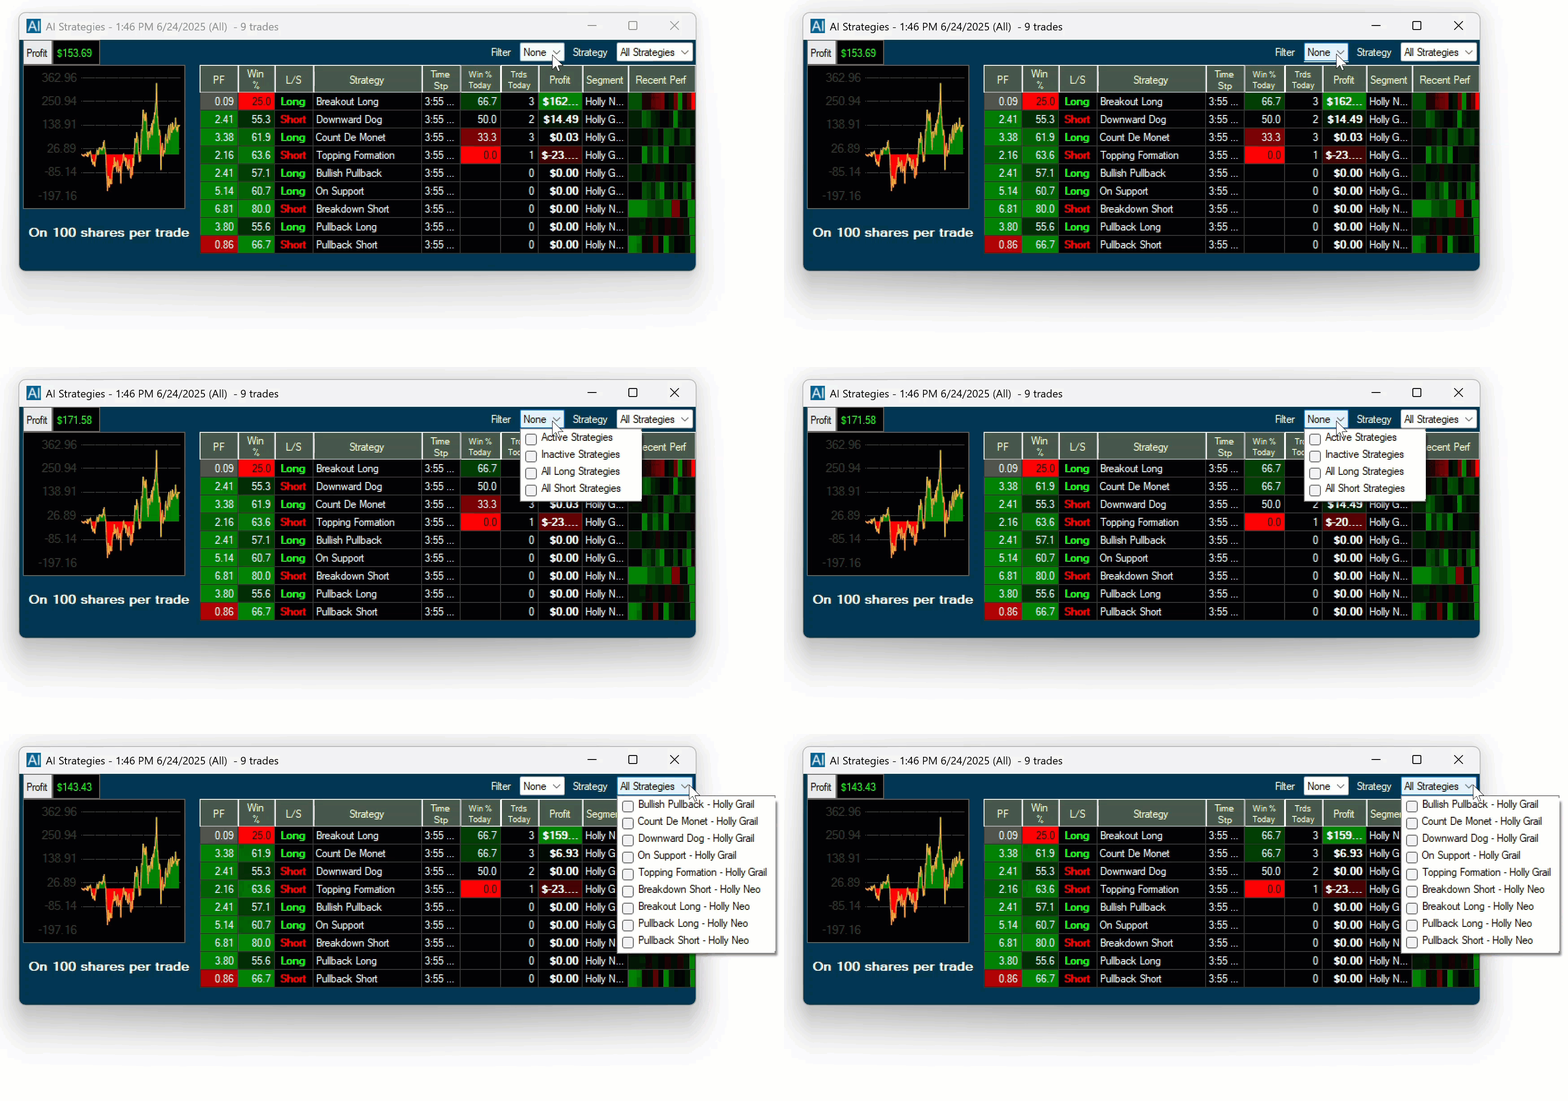
The filters are part of the Strategy Menu, which you can choose to show or hide. Simply right-click into the AI Strategy Window and check/uncheck the option Show Strategy Menu.
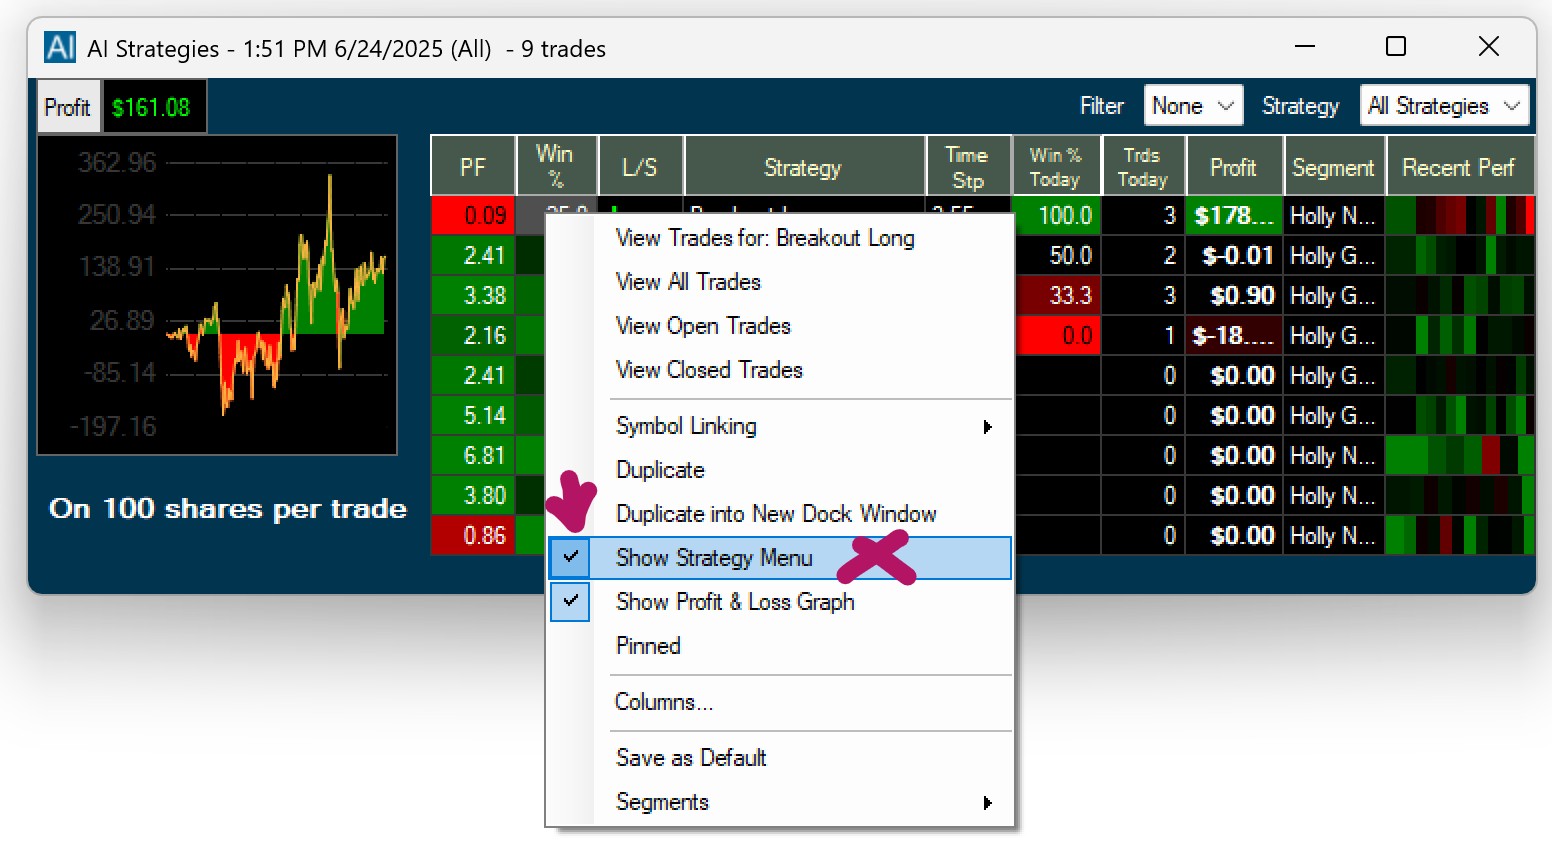
Right-Click Menu
The Right-Click Menu is the main way to control and configure most of the Trade Idea windows and the Holly AI Windows are no exception.
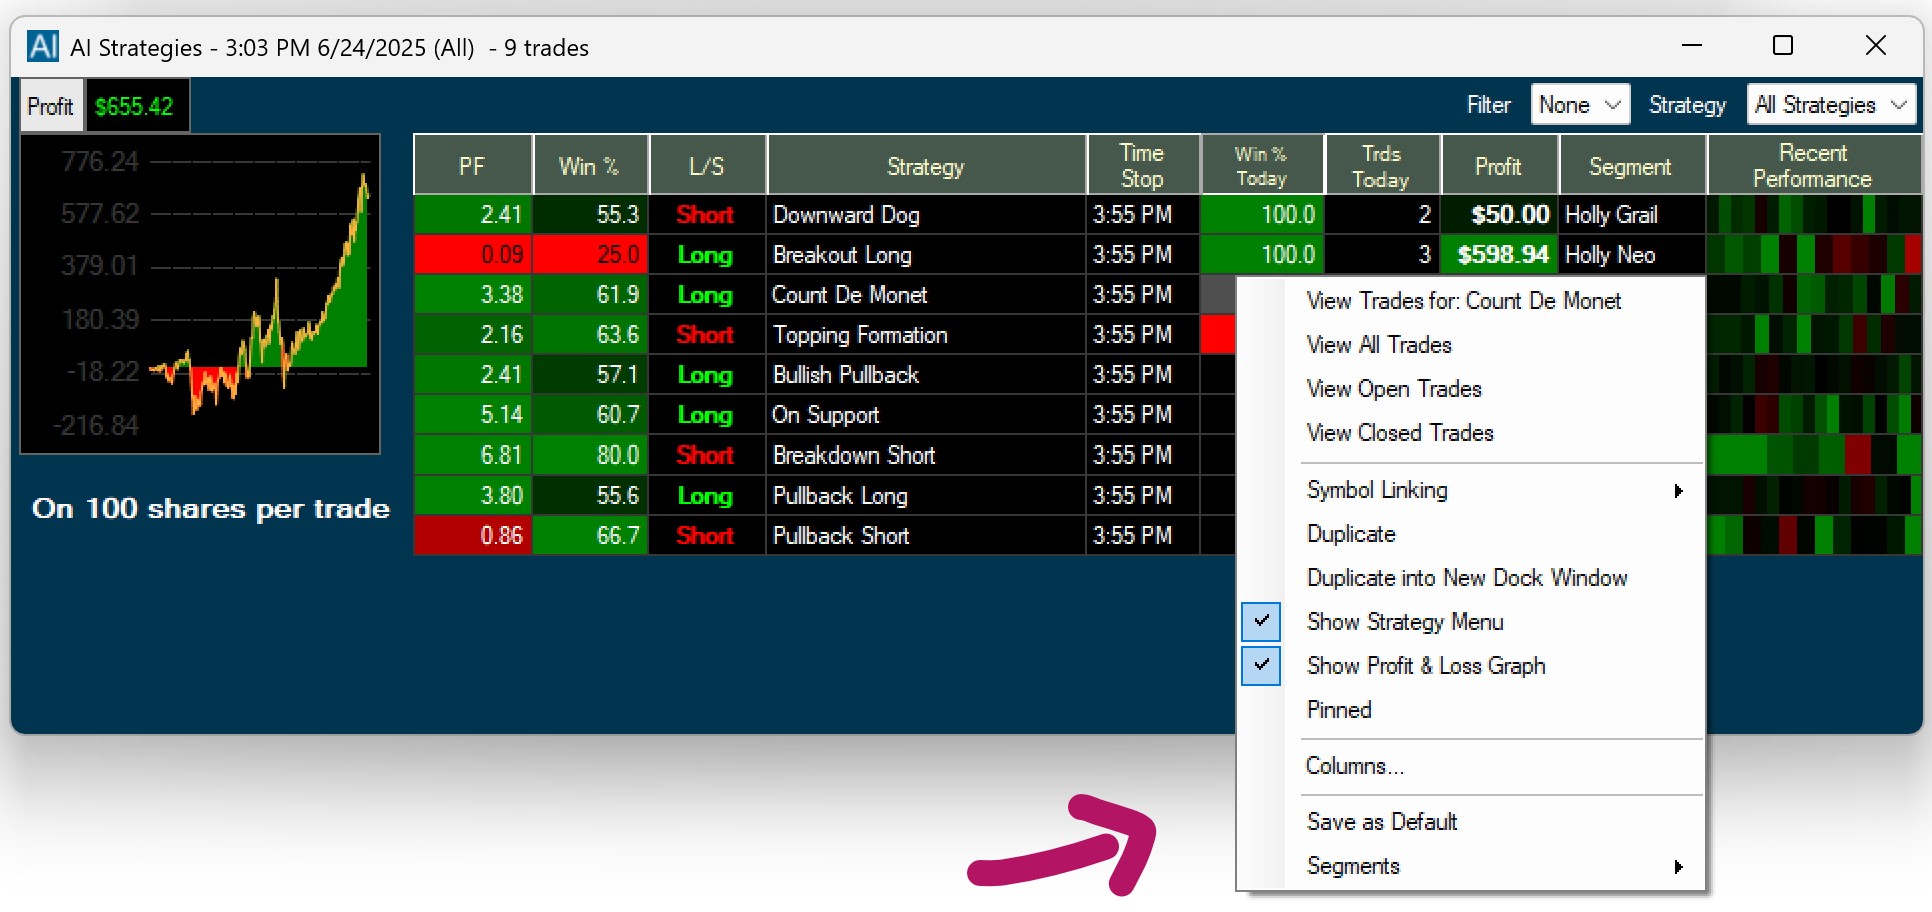
View Trades
The Right-Click-Menu gives you the option to only view the trades of a specific strategy, or to view all trades, only the open trades or only the closed trades.
Selecting any of these options will open a new AI Strategy Trades Window that contains your trade selection.
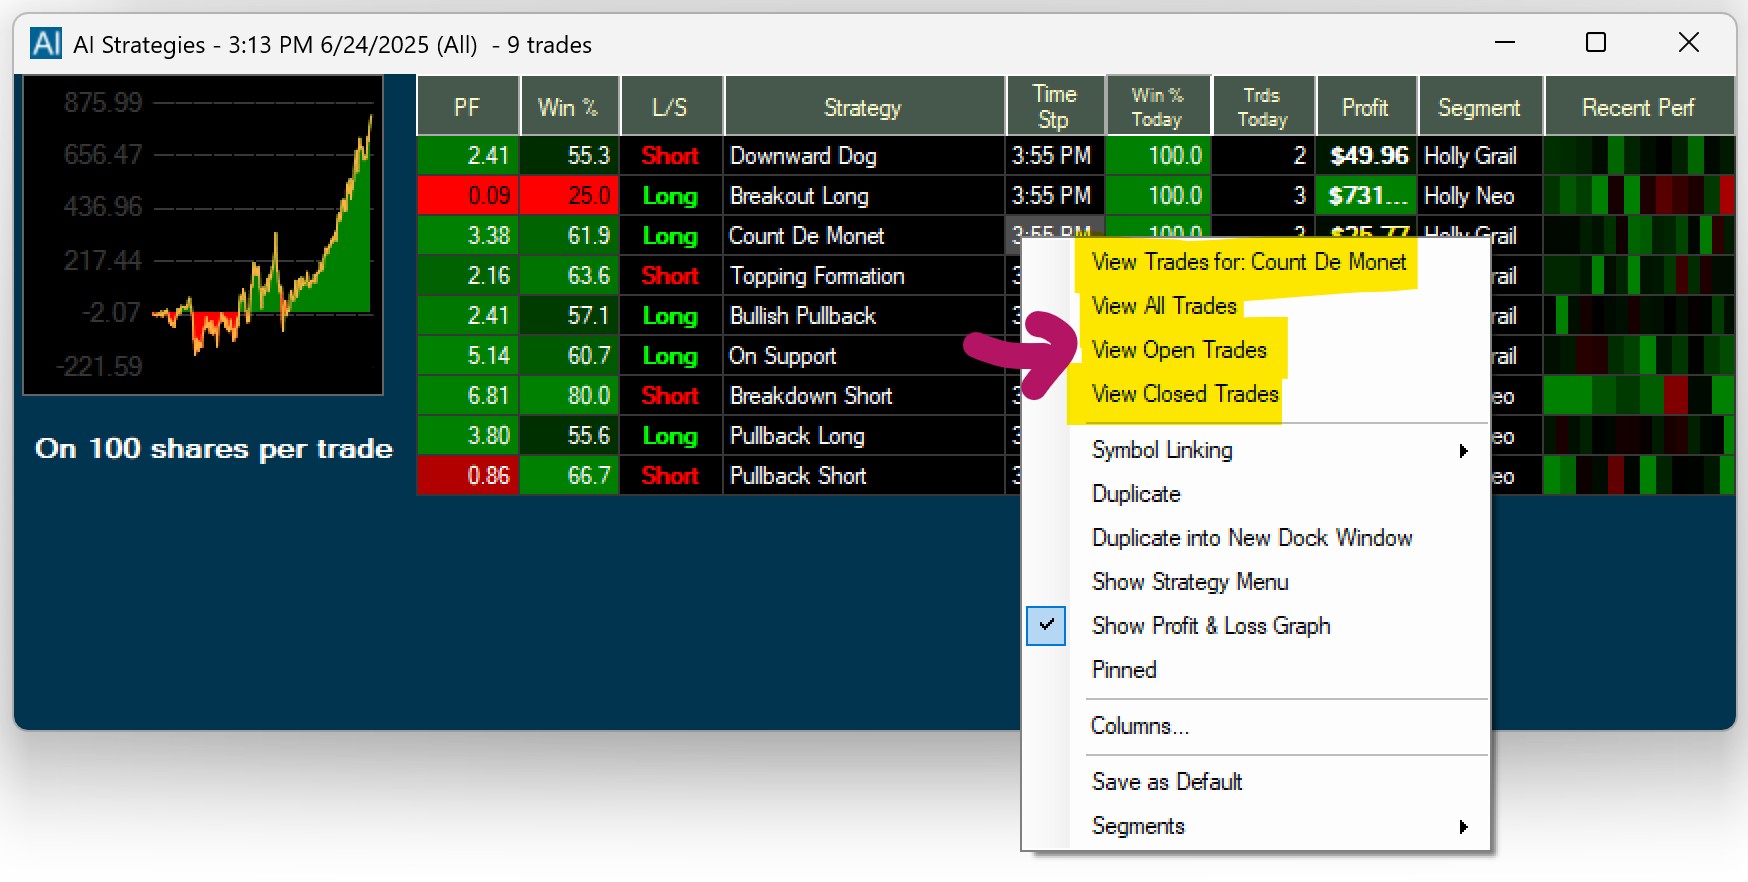
Duplicate
To copy your current window, use the Duplicate function. Simply right-click into your AI Strategy Window and select Duplicate from the dropdown.
You will get an exact copy of the current window, which you can modify while keeping the original window intact.
Duplicate into New Dock Window
To open a copy of a free-floating window in a new Dock, right-click into the free-floating window and select Duplicate into New Dock Window.
An exact copy of your free-floating window will now be opened in a new Dock.
Duplicate into XYZ Dock
To load a copy of a free-floating window into an already open Dock, right-click into the free-floating window and select Duplicate into XYZ Dock, where XYZ stands for the Name of that particular Dock.
An exact copy of your free-floating window will now be added to the chosen Dock.
Show Strategy Menu
You can choose to show or hide the Strategy Menu, which contains the Profit & Loss display on the top left-hand side of the window as well as the two filter options on the top right-hand side.
Simply right-click into the AI Strategy Window and check or uncheck Show Strategy Menu.
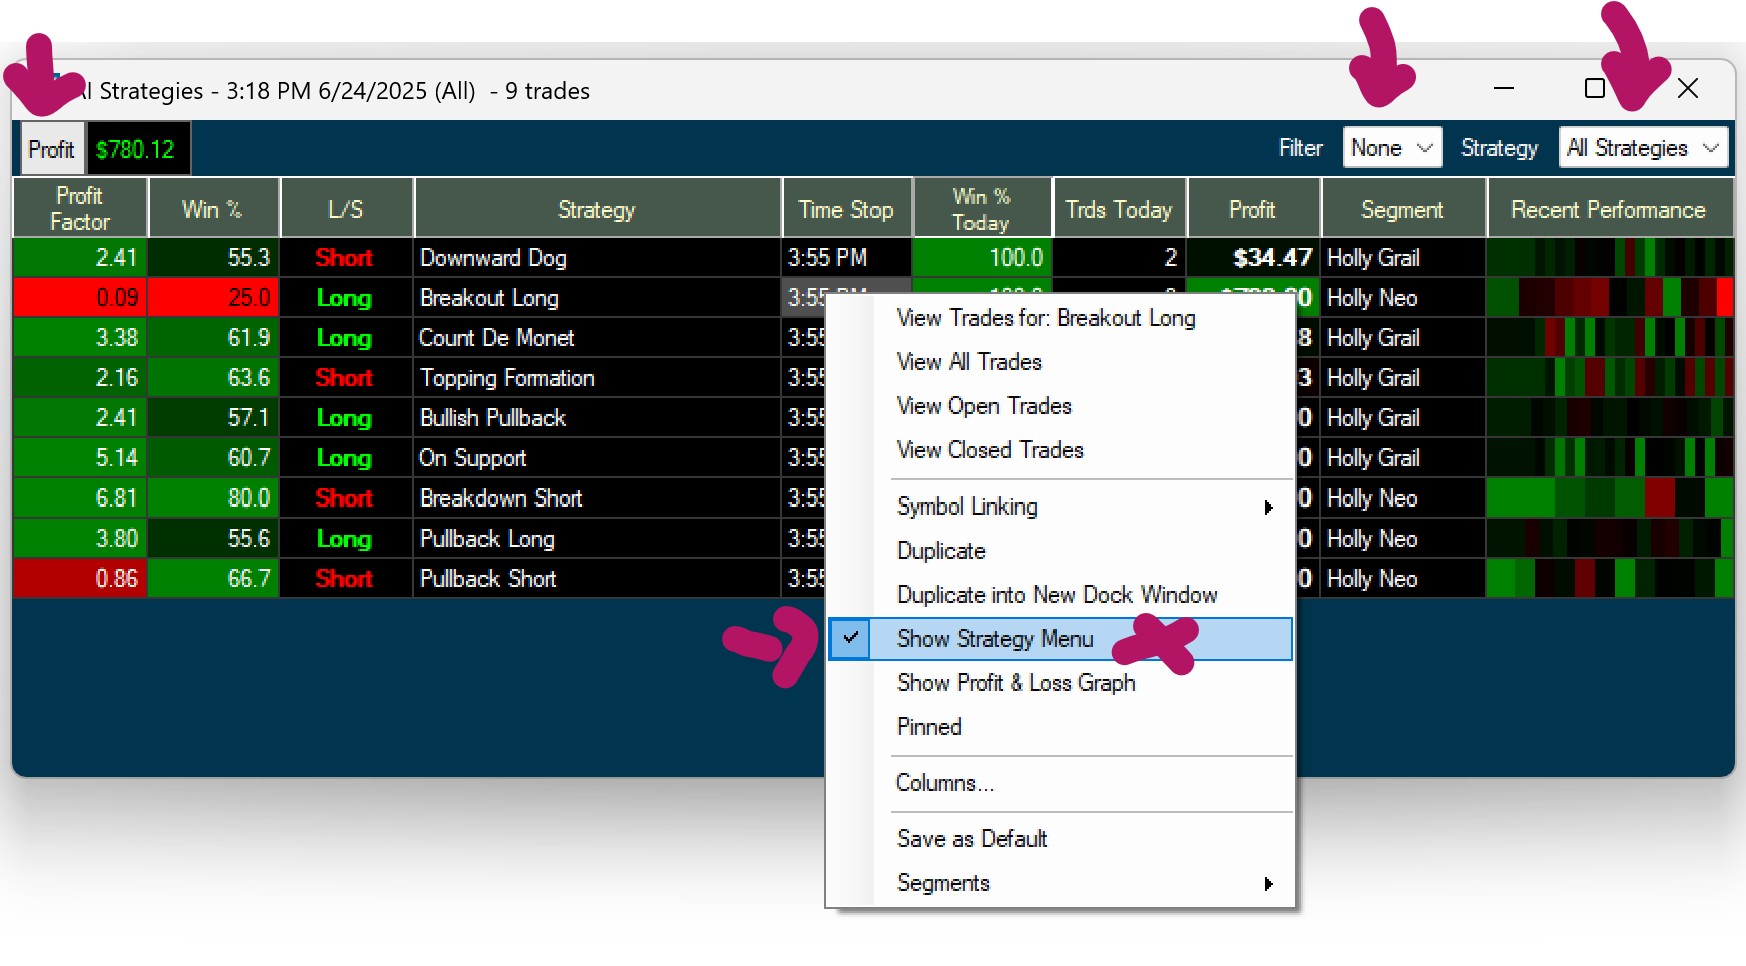
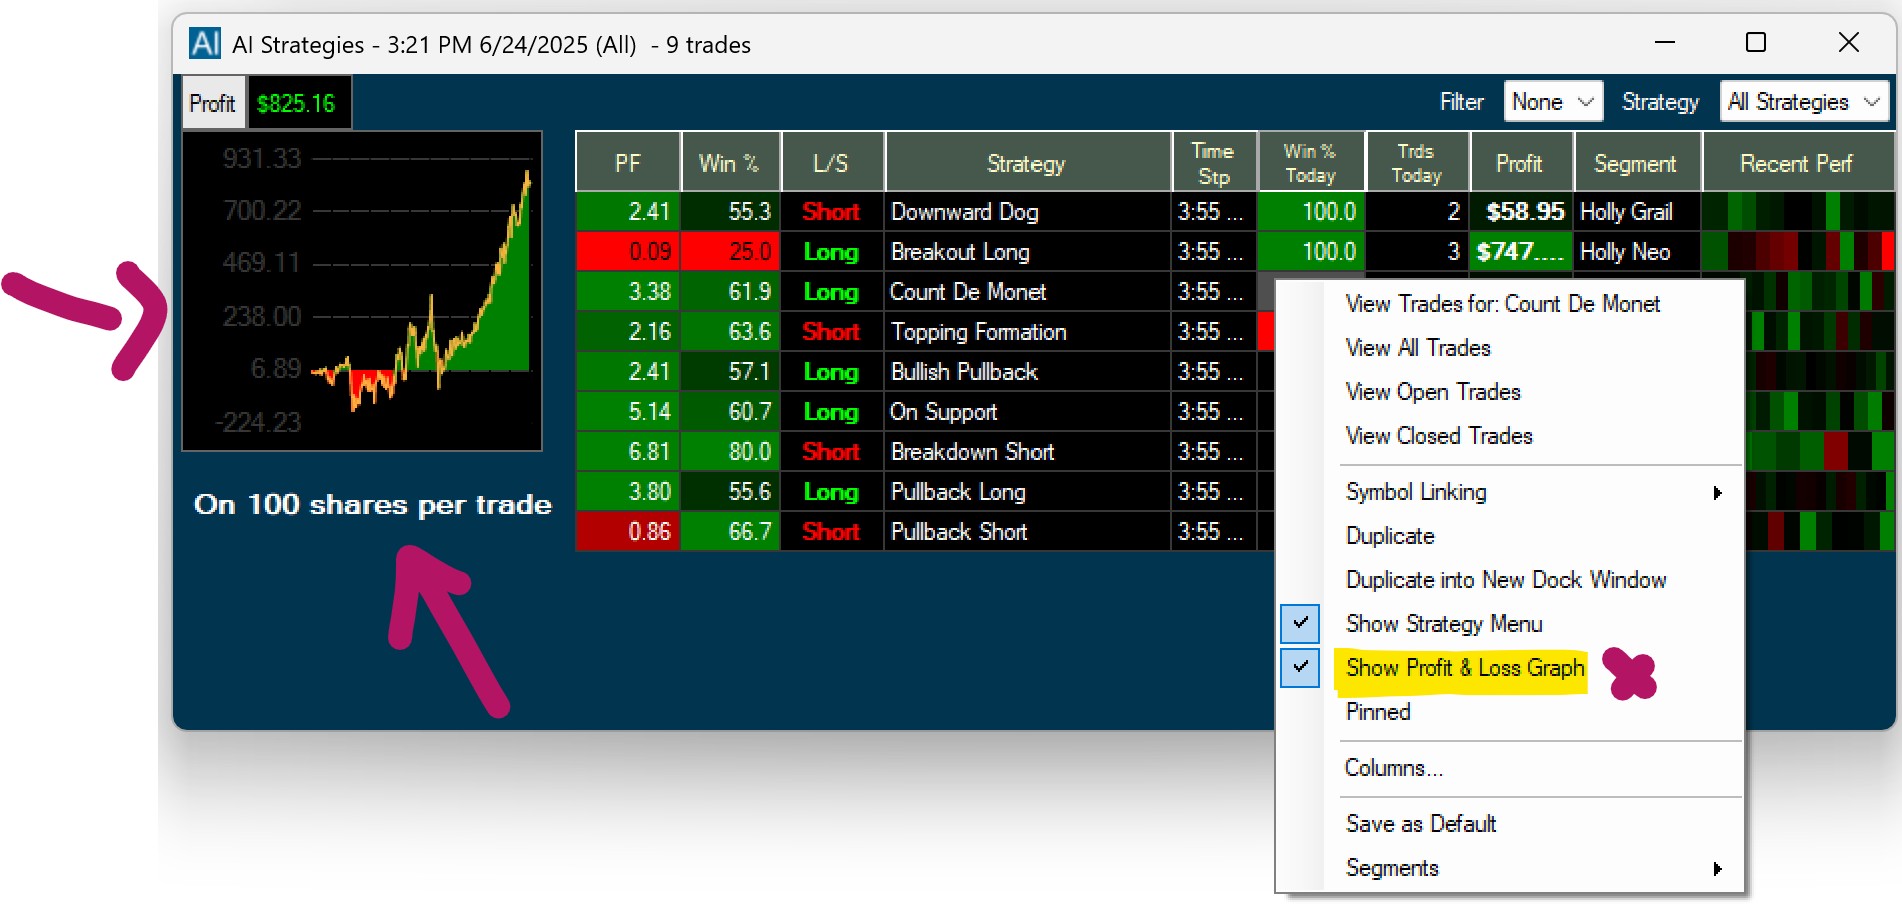
Show Profit & Loss Graph
The Profit & Loss Graph displays the Total Profit & Loss based on the AI Risk Size. You can choose to show or hide the Profit & Loss Graph.
Simply right-click into the AI Strategy Window and check or uncheck Show Profit & Loss Graph.
Pinned
To keep a single Trade Ideas window on your screen permanently, even when switching layouts, or toggling through channels, right-click into the specific window, and select Pinned from the dropdown. The Pinned Feature, is available for all Trade Idea Windows, including Scans, Charts, Compare Count, and the Holly AI Windows.
Once a window is pinned, it does not follow the behavior of the other windows.
This is useful if you would like to include one or more windows of a channel in a custom layout, without saving the individual windows to the Cloud first.
It is important to note, that this window will stay open until you decide to unpin it. When accidentally saved within a layout, It might load multiple times, when closing and re-opening this layout. At worst, you will have multiple versions of the window all running on top of each other in the same position. This can put a strain on system resources and drastically impact software performance. The pinning option should therefore be used very carefully and consciously. A window should always be unpinned after the desired action is completed.
To do this, right-click into the window and remove the checkmark on Pinned.
To see all pinned and unpinned windows, or to close them, go to the Toolbar, select Windows, and choose, Close All Unpinned, or Close All Pinned.
Columns
The columns can be reorganized via left-click drag and drop. The individual columns can also be extended or compressed by using your mouse.
To add more columns right-click into the window and select Columns.
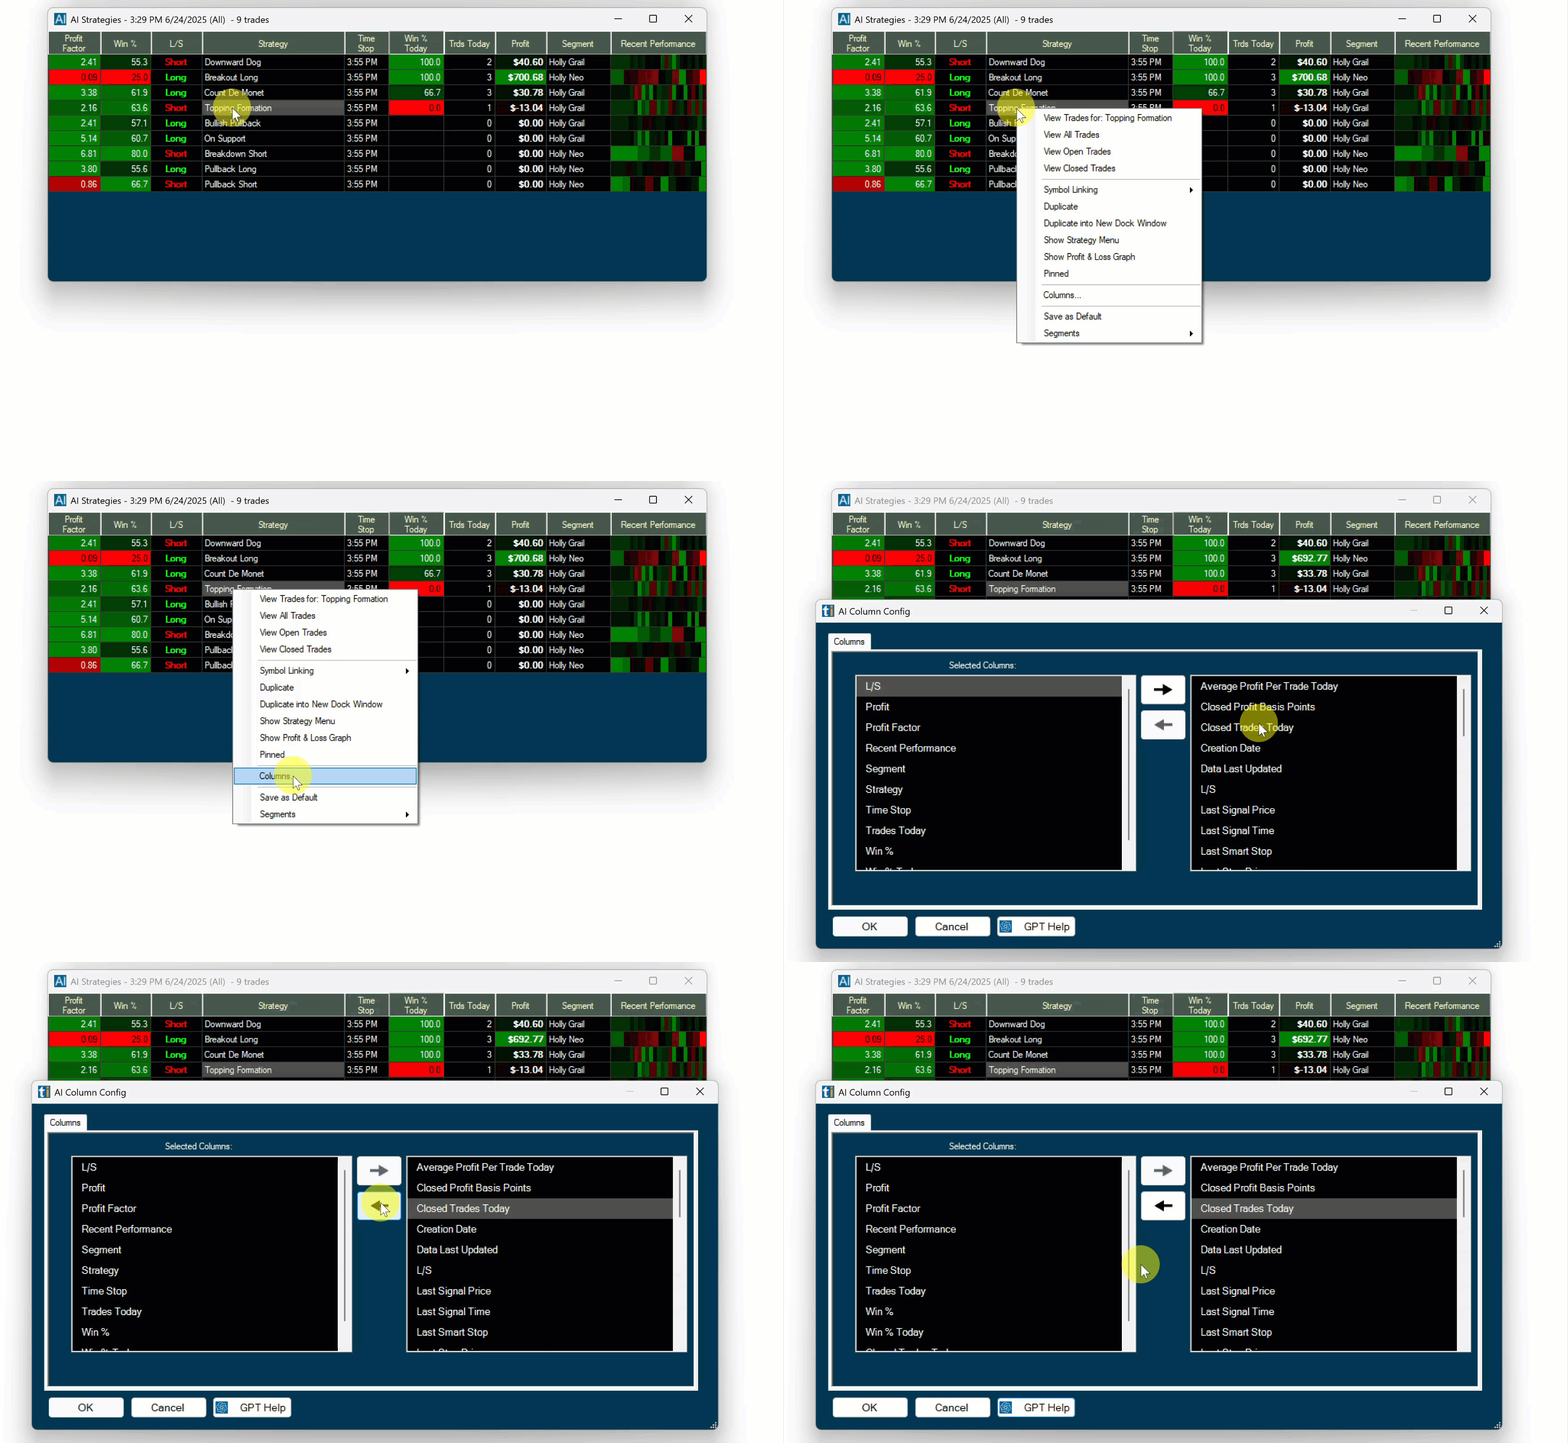
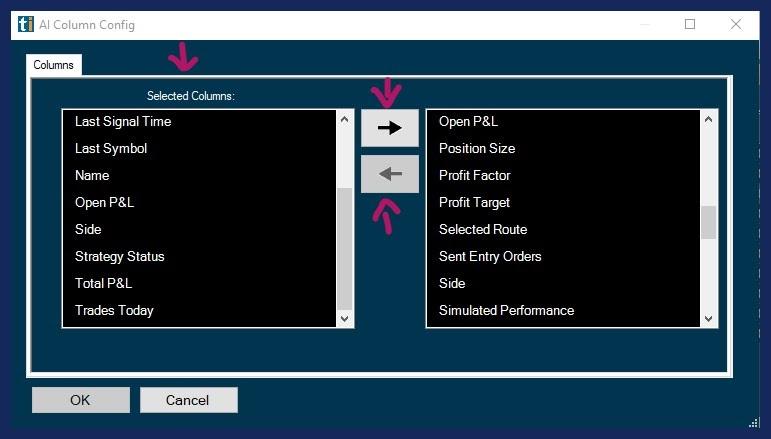
The left-hand side shows the already listed columns, the right-hand side shows the columns that can be added.
Select additional columns by highlighting them with a left mouse click.
Click the arrow pointing to the left to move them to the Selected Columns field.
To remove any of the already selected columns, highlight the column, then click the arrow pointing to the right.
Click OK when you are done.
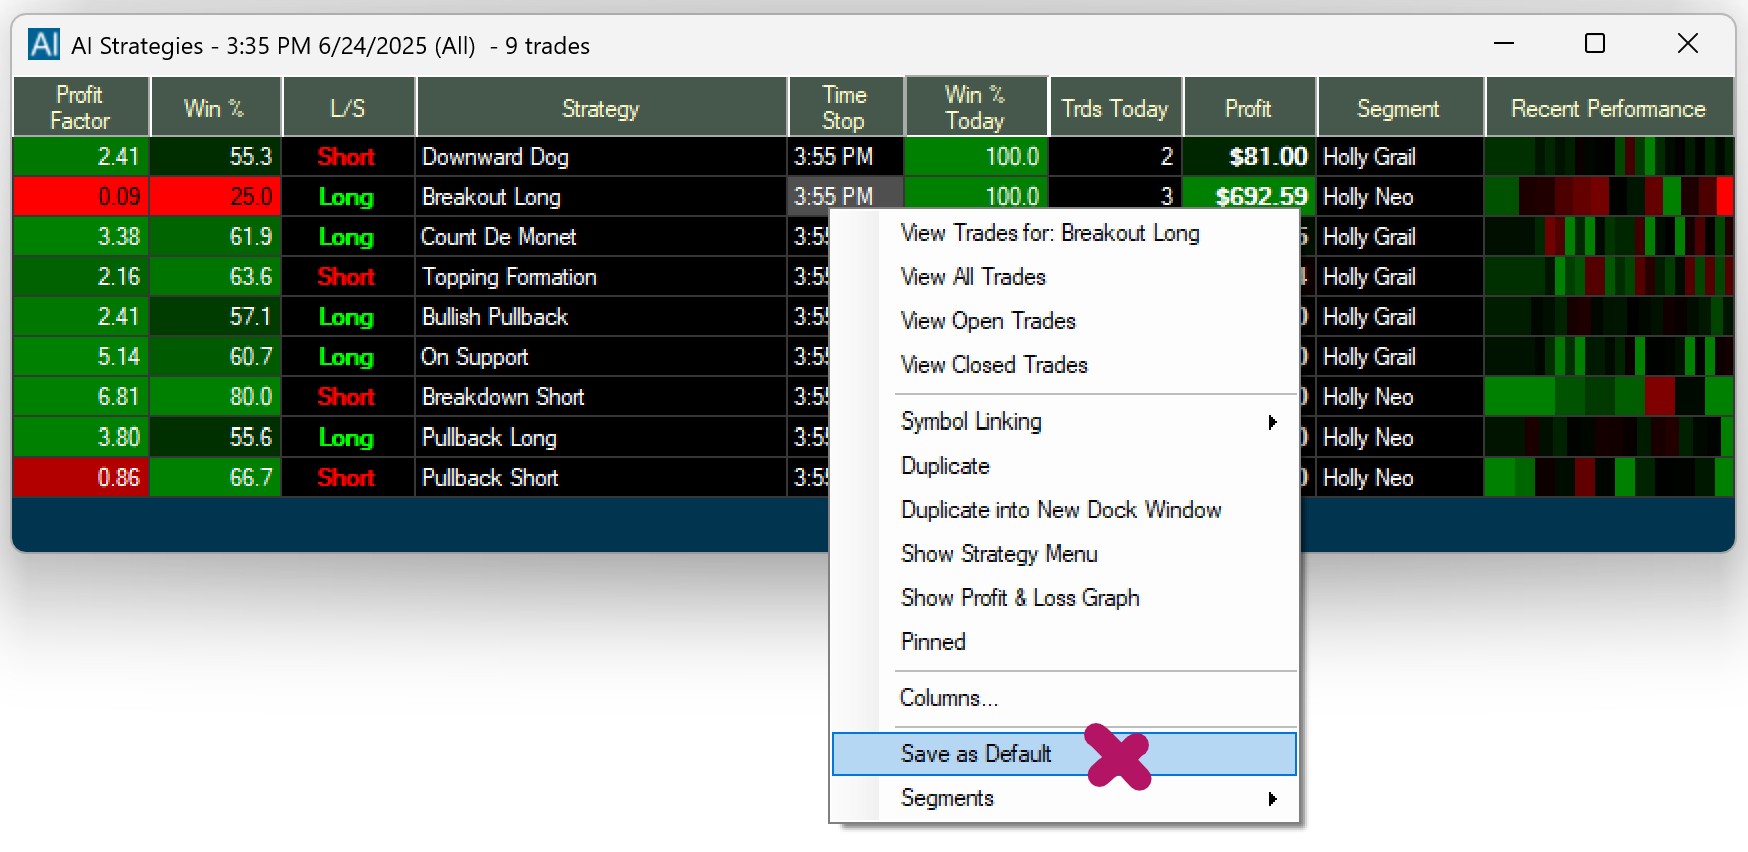
Save as Default
You can save a window and its configuration as the default version of this window type by right-clicking and choosing Save As Default. Whenever you now open a new window of this type from the New Tab of your Toolbar, the window configuration that you saved as default, will load.
The Load Window option, which you can find in the File Tab of the Toolbar, provides access to all the default versions of your Trade Ideas windows. The default layouts of your Chart, Single Stock, Brokerage Plus, and AI Windows are saved in the TradeIdeasPro folder on your local computer.
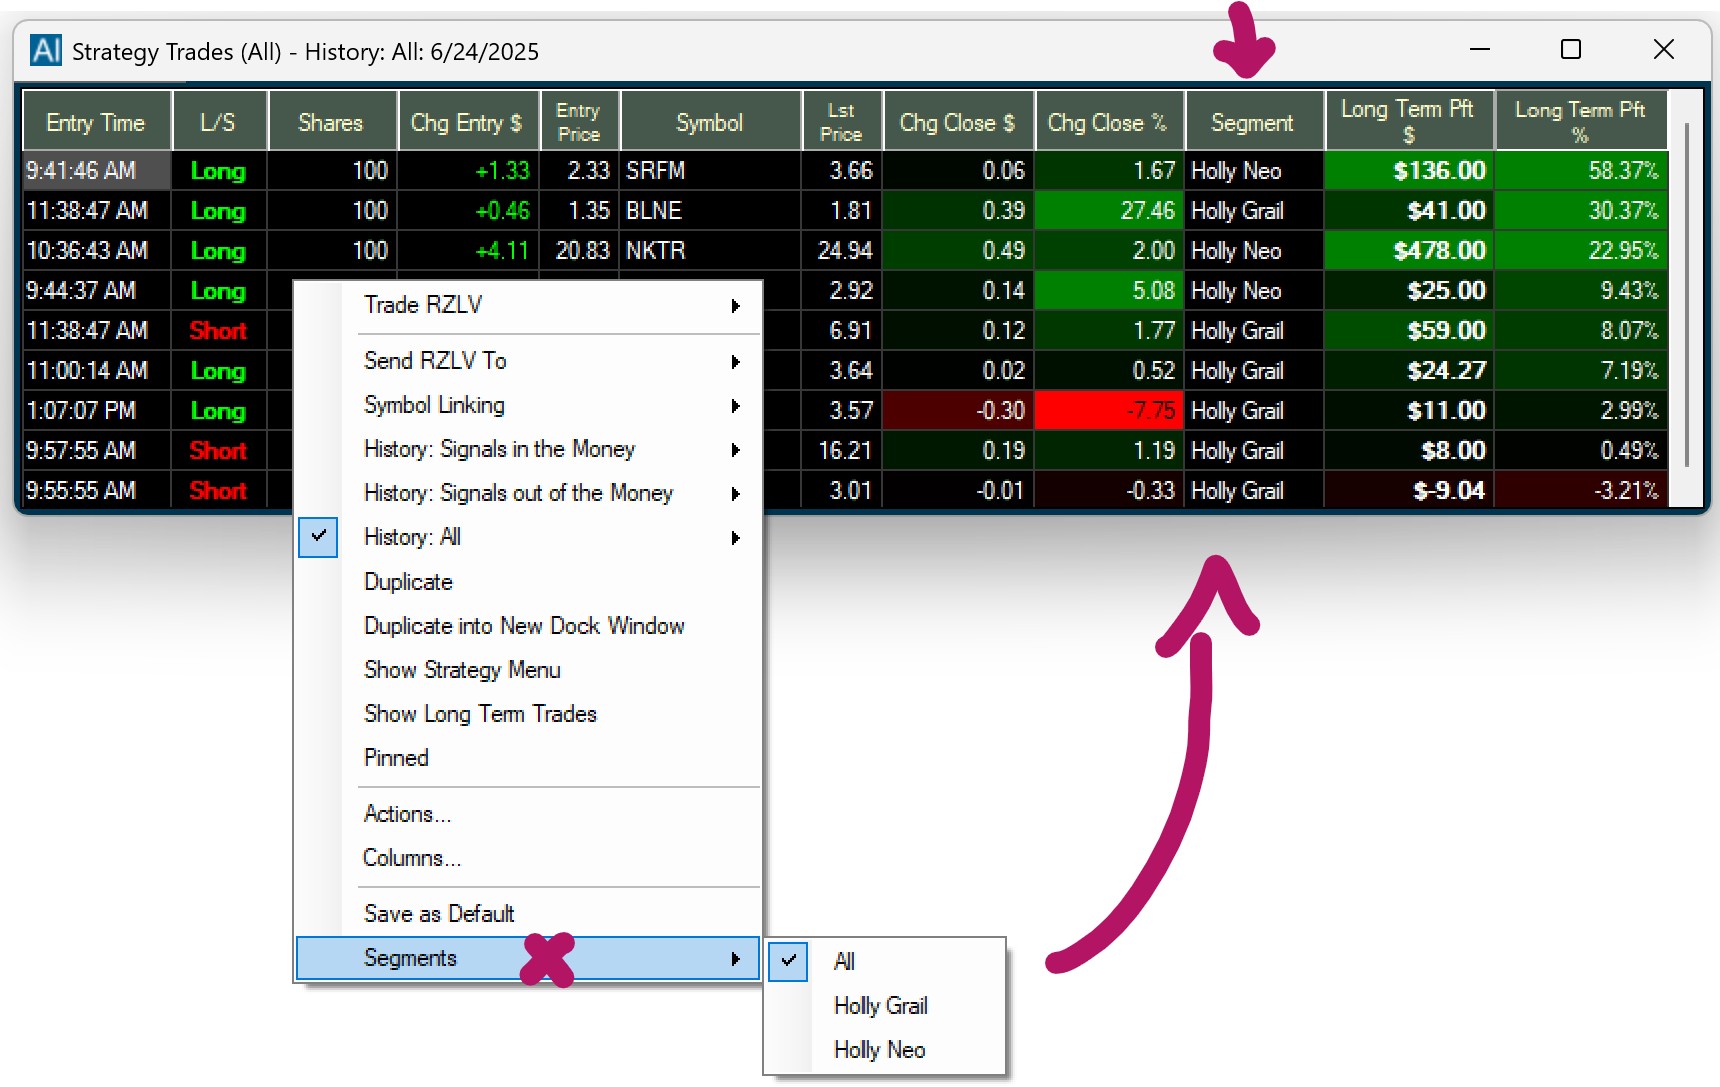
Segments
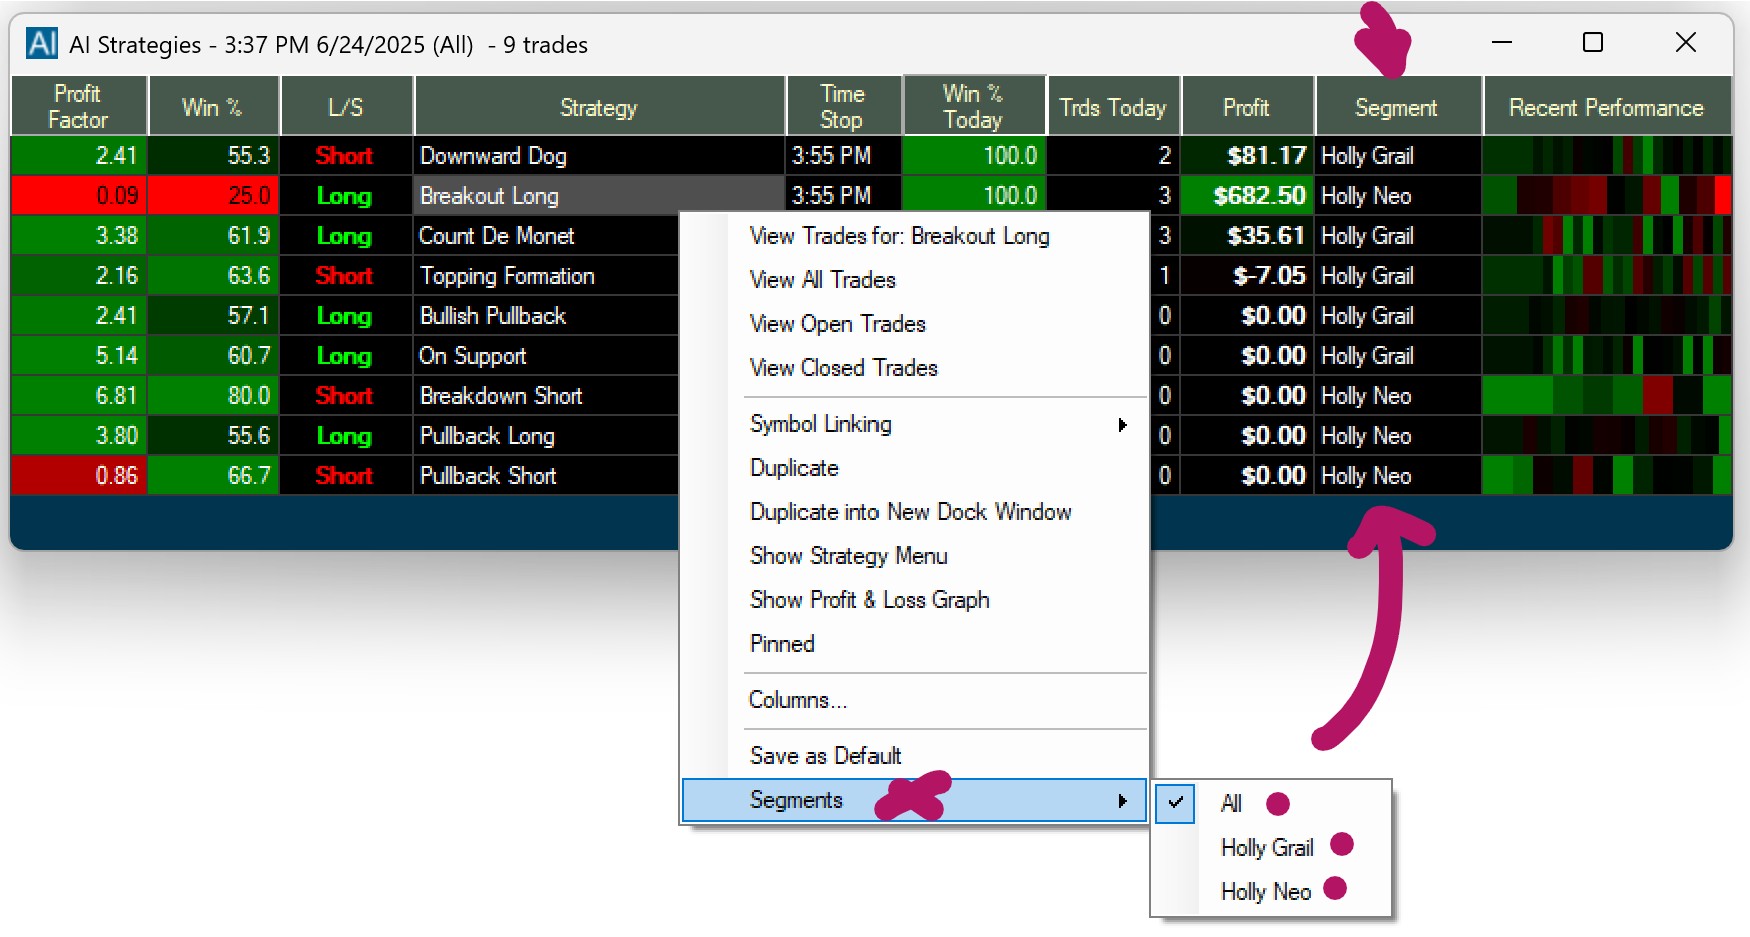
Holly consists of three Segments, namely Holly Grail, Holly 2.0, and Neo, which have different strategies assigned.
To switch to a specific Holly Segment, select Segments and make your choice.
AI/Holly Strategy Trades Window
To see Holly’s trading in action, open to the AI Strategy Trades Window. All the trades that Holly enters during the day will appear here.
Whenever Holly enters a new trade, the entire entry row will flash.
You will find it in the Toolbar under New, as well as in the Trade Ideas AI Channel.
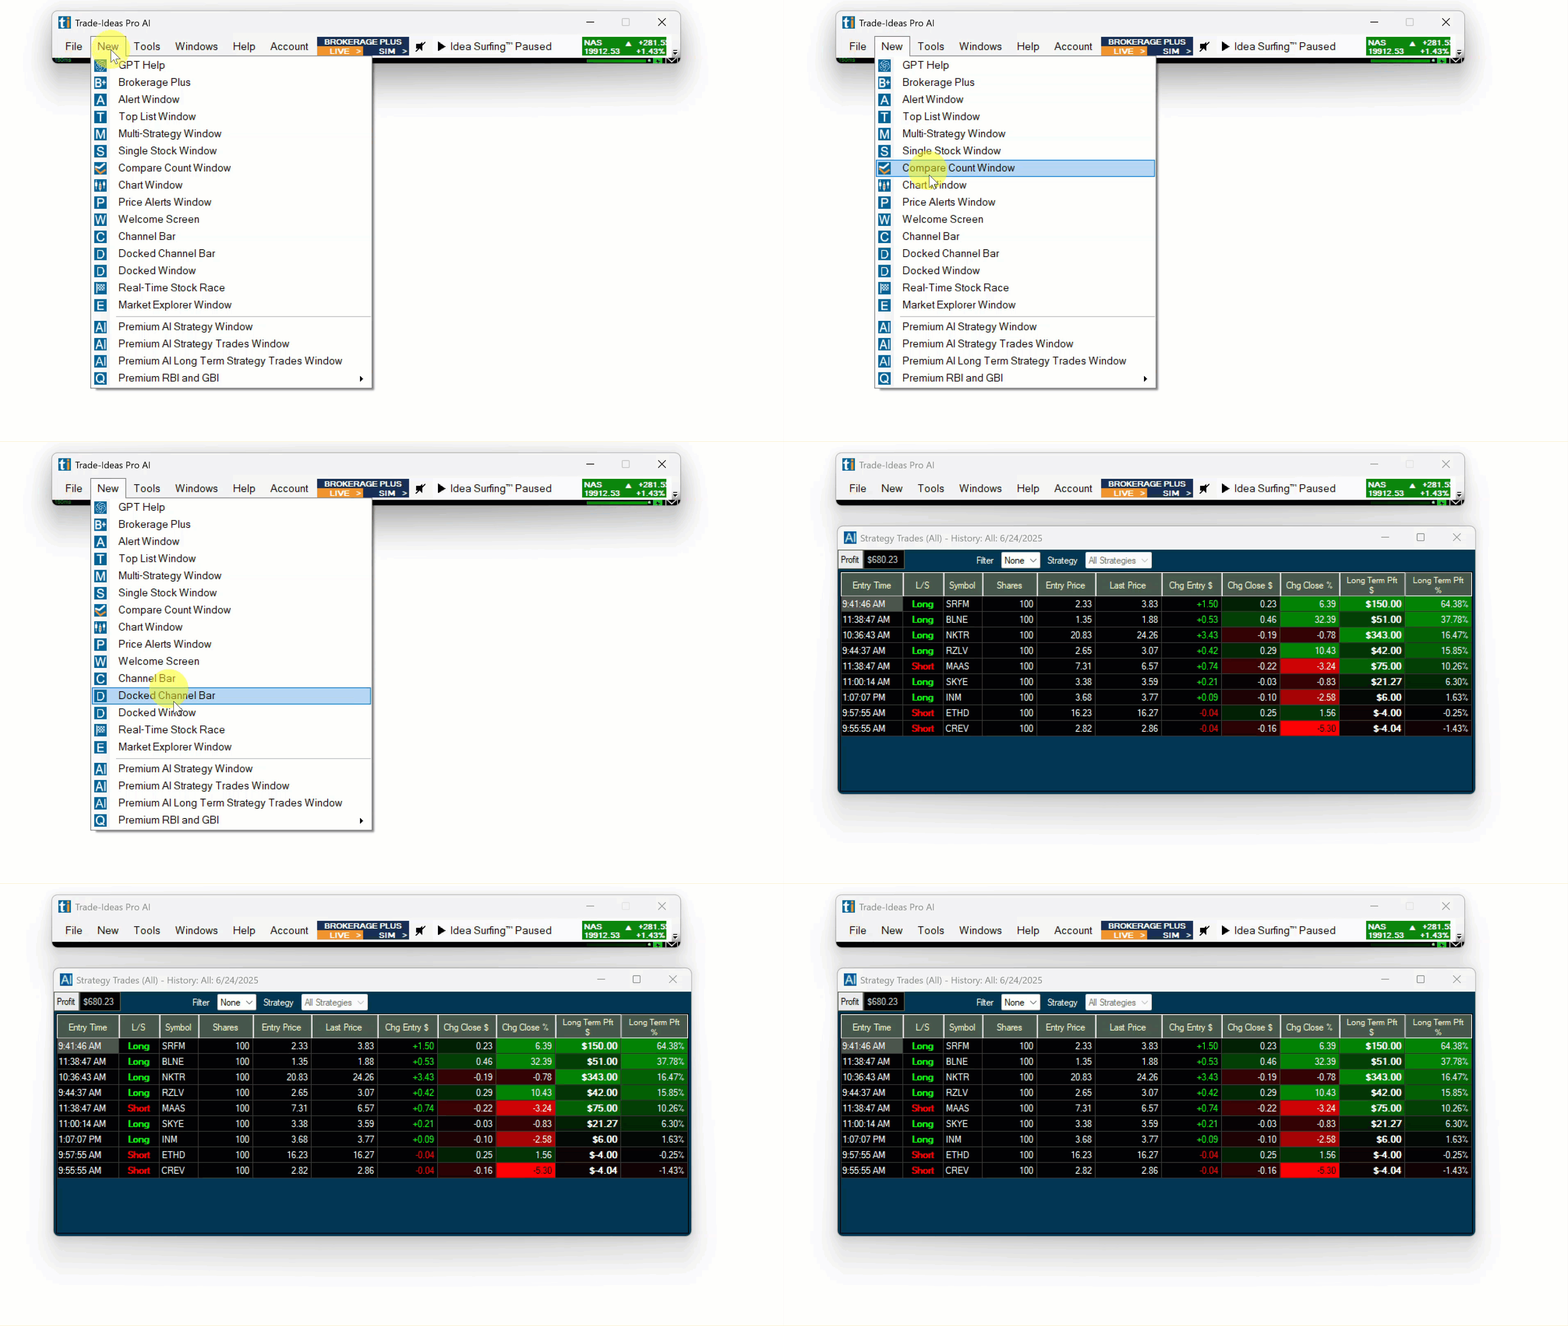
AI/Holly Strategy Trades Window:
Filters
The two filter dropdowns on the top right-hand side of the AI Strategy Trades Window, enable you to filter by open/closed positions, all long/short strategies and profitable/losing trades, as well as individual strategies.
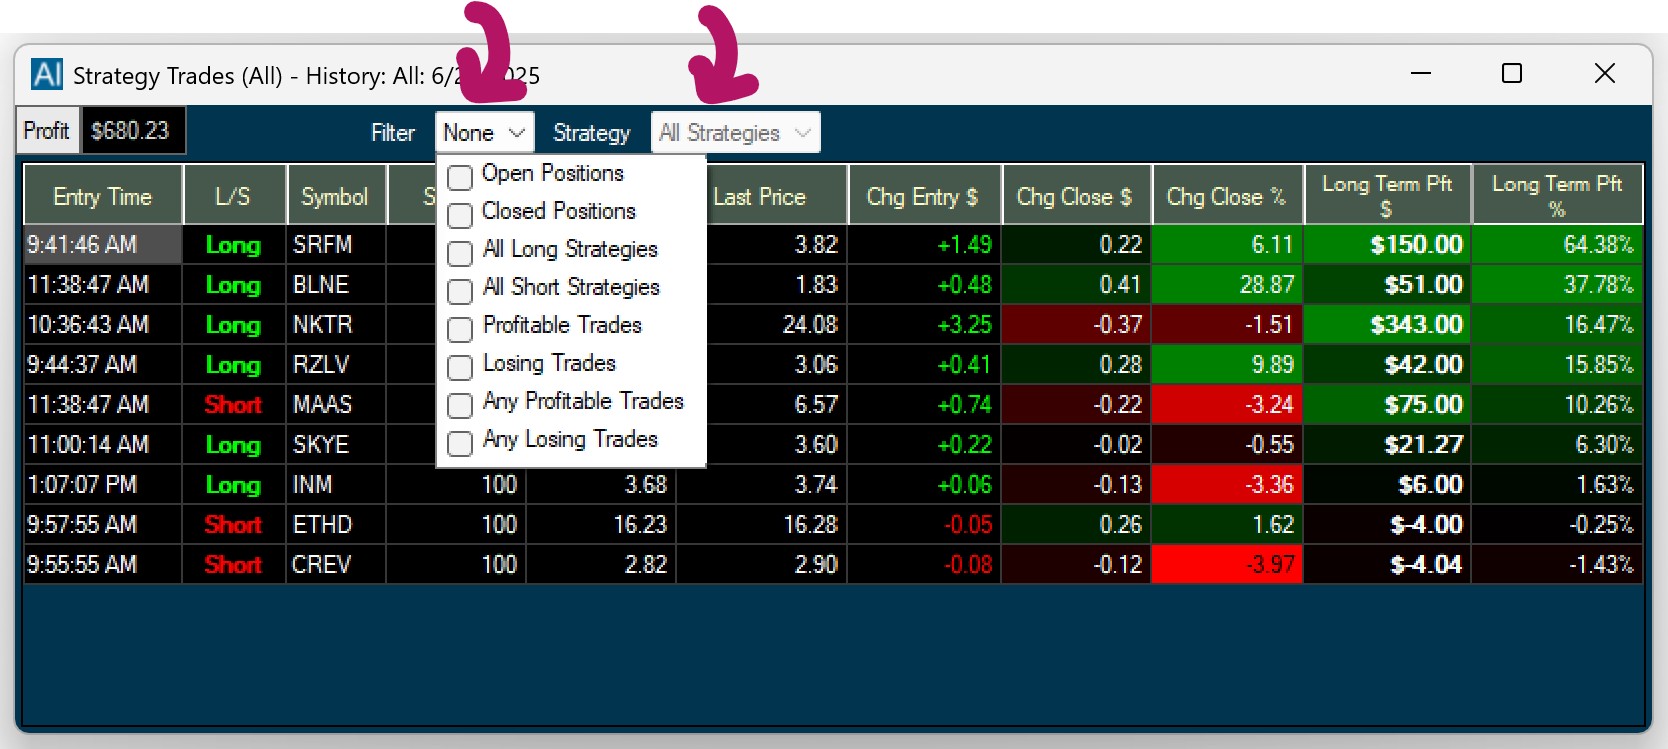
The filters are part of the Strategy Menu, which you can choose to show or hide.
Simply right-click into the AI Strategy Trades Window and check/uncheck the option Show Strategy Menu.
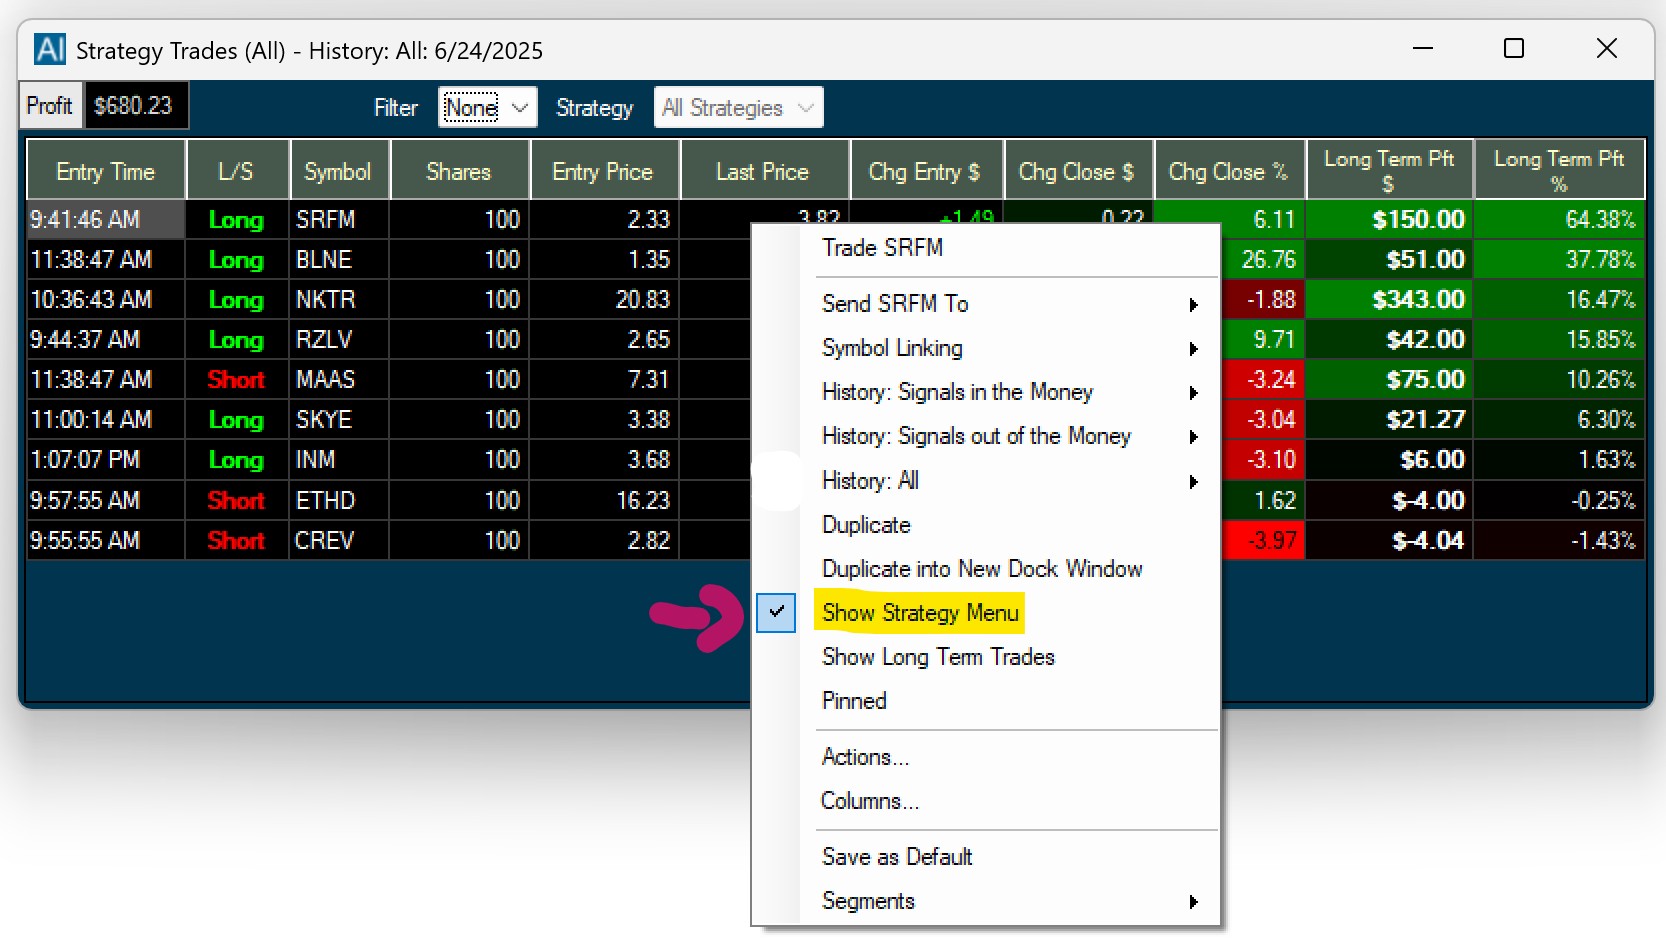
Right-Click Menu
The Right-Click Menu is the main way to control and configure most of the Trade Idea windows and the Holly AI Windows are no exception. Right-click into any Trade Ideas Window, and you will see a host of options revealed that enable you to adjust a window's settings.
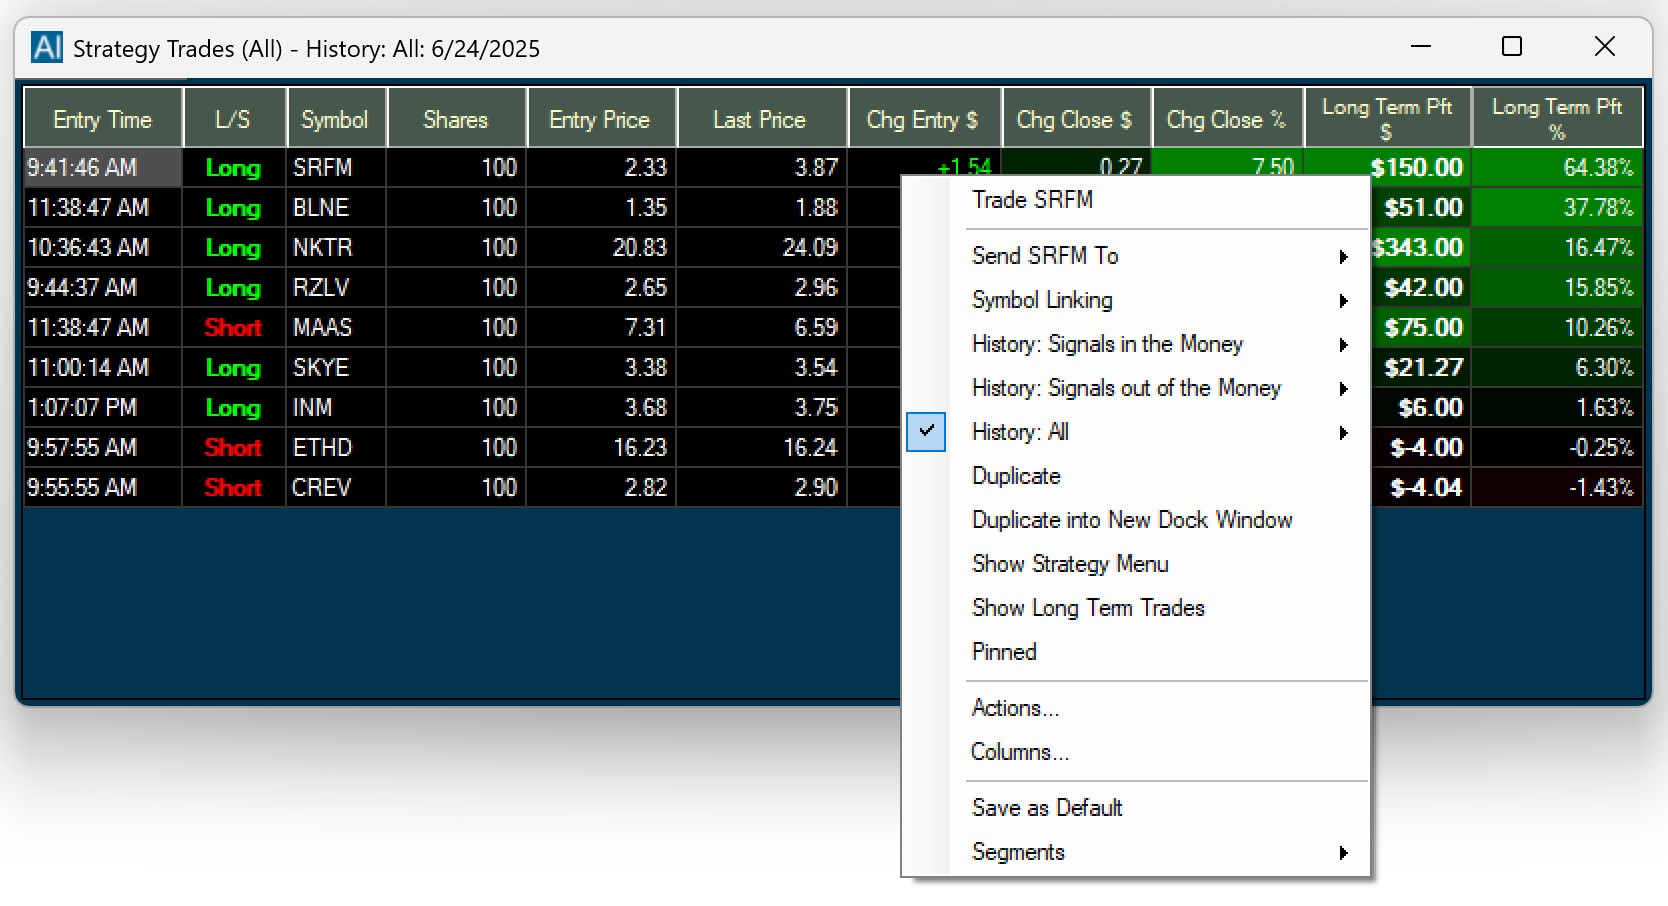
Trade XYZ
Our Brokerage Plus Module enables you to send orders based on Holly's strategies directly to participating brokers or our simulator.
As a first step, open the Brokerage Plus Module by clicking, Brokerage Plus Sim in the Toolbar. This will automatically connect you to our Simulator.
You can confirm that you are connected to our Simulator, by clicking Connect in the top left-hand corner. If the connection bar and the chosen connection option are green, the connection has been established. To connect to a participating Brokerage Platform, follow the instructions in the Brokerage Plus How to connect Holly section.
Once connected, right-click the symbol you would like to trade within the AI Strategy Trades Window and select Trade XYZ.
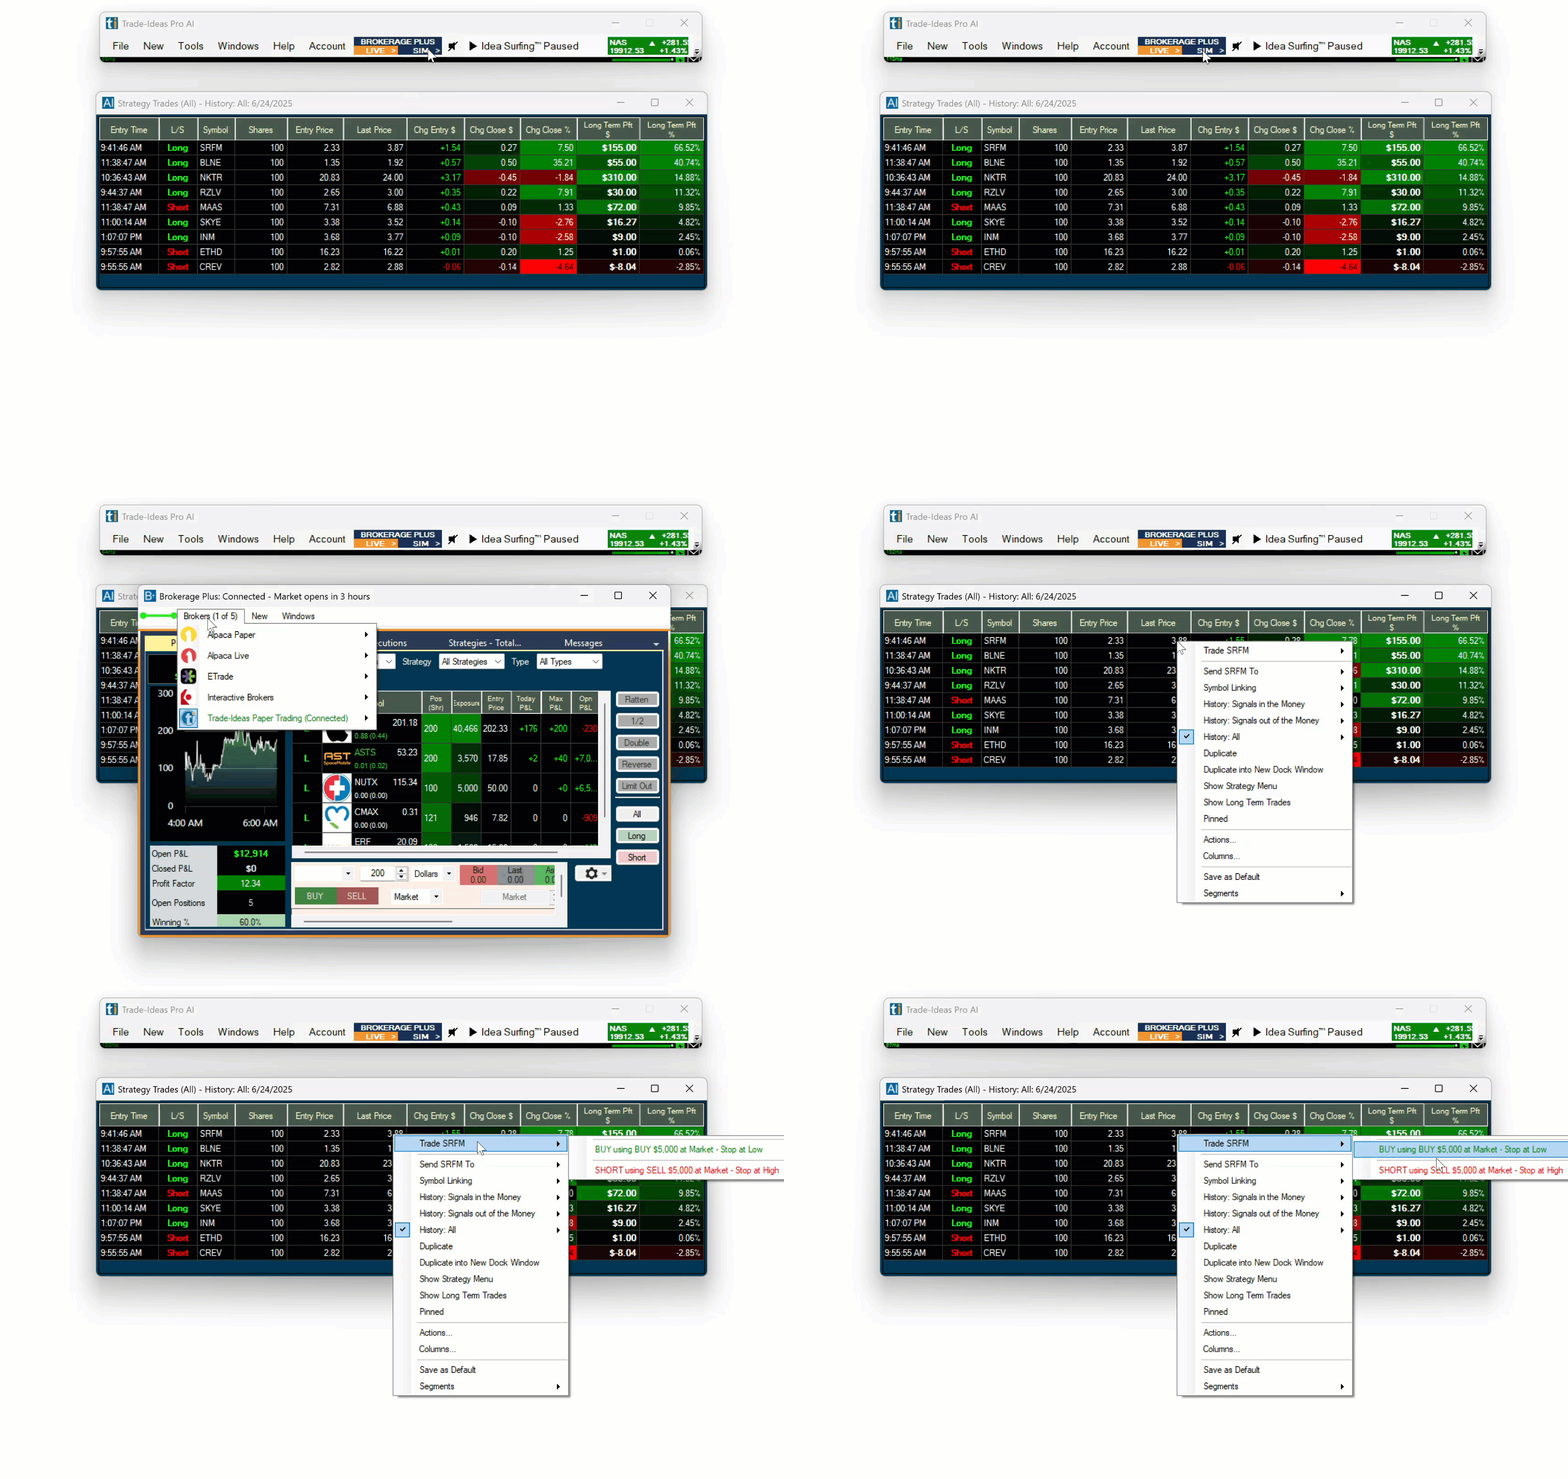
You have a few preset Order Entry Templates to choose from, but you easily can modify them, or create your very own One-Click Orders including stops and targets from scratch.
For more info head here: One-Click-Trading Strategies
Send XYZ to…
The Send to Feature that you can access via right-click into the AI Strategy Trades Window, enables you to lookup more info for a stock, add it to a watchlist, or share it with others.
You can send the chosen symbol to a chart window, a single stock window, to Twitter, or the Web. By selecting Send to Web, you can find info about the stock on Yahoo Finance, Finviz, and many other web-based platforms.
Lastly, you can send the stock symbol to one of your symbol lists or create a new symbol list.
This is particularly helpful if you would like to bookmark the stock and continuously monitor it independent of Holly.
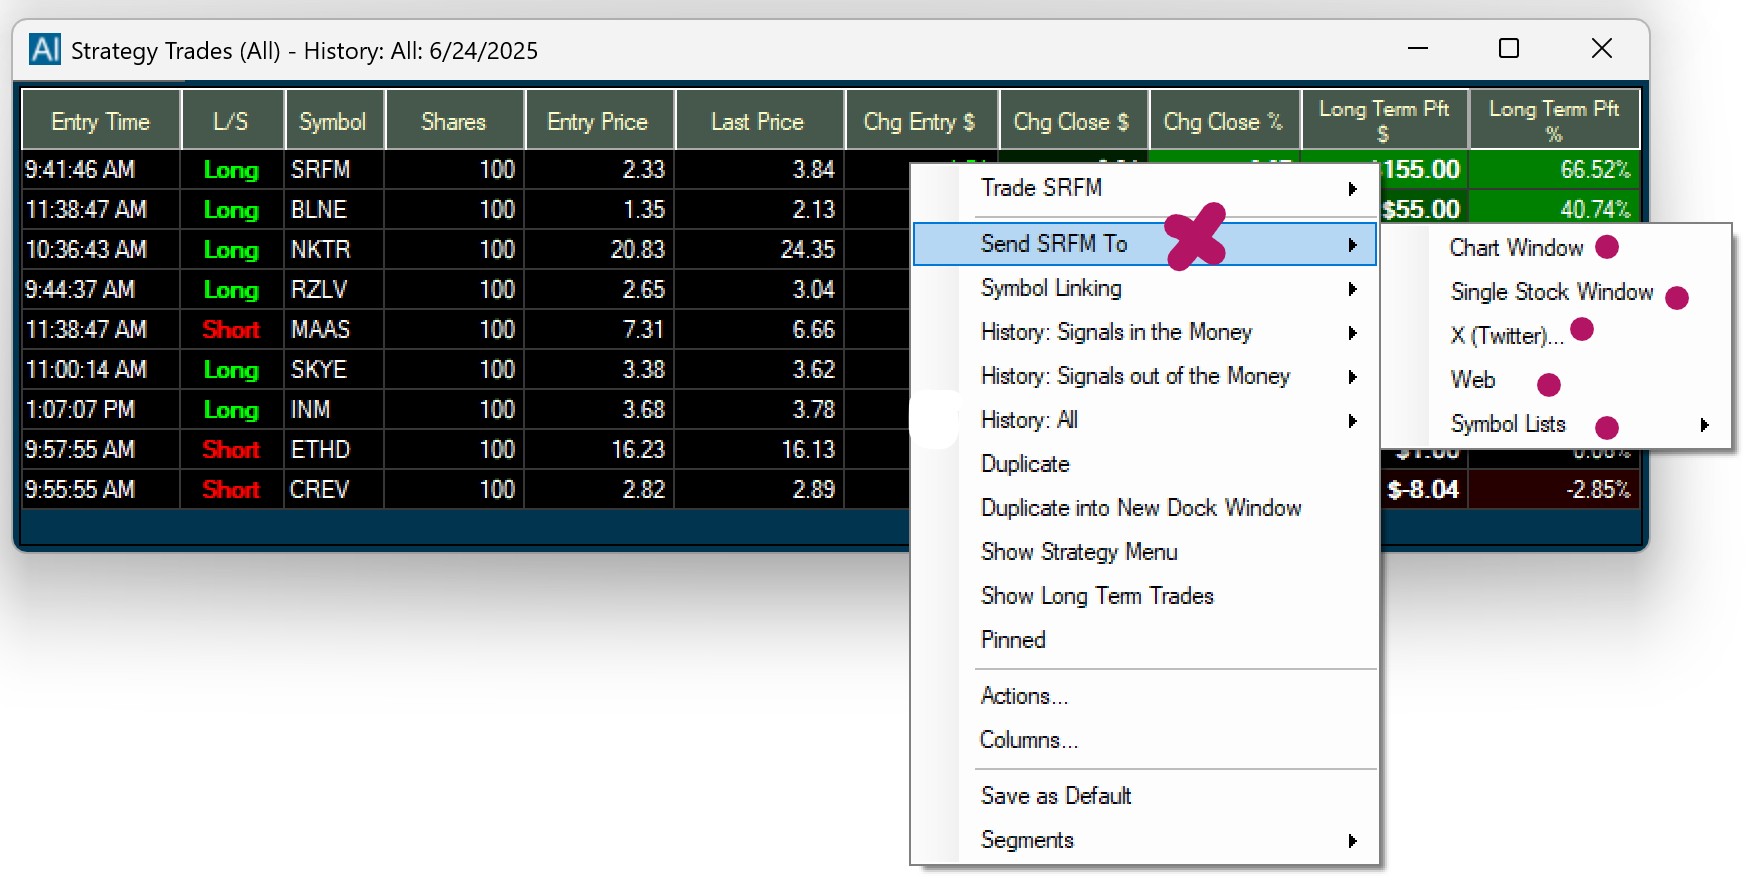
For more details about the Send to Feature have a look at this section
To learn more about Symbol Lists, head to the Symbol List section.
Symbol Linking
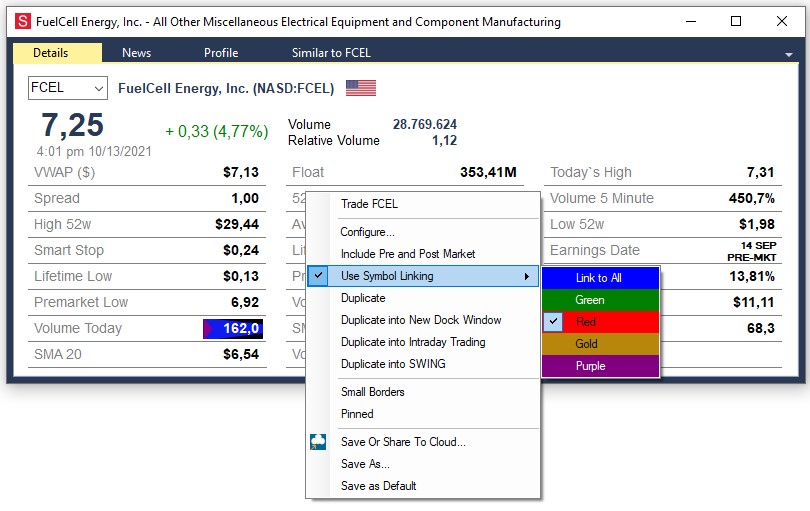
Most Trade Idea Windows, including Alert, Top List, Multi-Strategy, and Compare Count Windows as well as the Holly AI Windows, RBI, GBI, and Price Alerts can be symbol-linked to a Chart or Single Stock Window. This means that when changing your windows stock symbol, your symbol-linked Chart or Single Stock Window will automatically change as well, and display the specific stock’s data.
To enable Symbol Linking for a Single Stock Window, right-click into it, and select Symbol Linking. Now, add a Checkmark to the left-hand side of the Symbol Linking option.
To enable Symbol Linking for a Chart, right-click into it, select Properties, and then Symbol Linking. Now, add a Checkmark to the left-hand side of the Symbol Linking option.
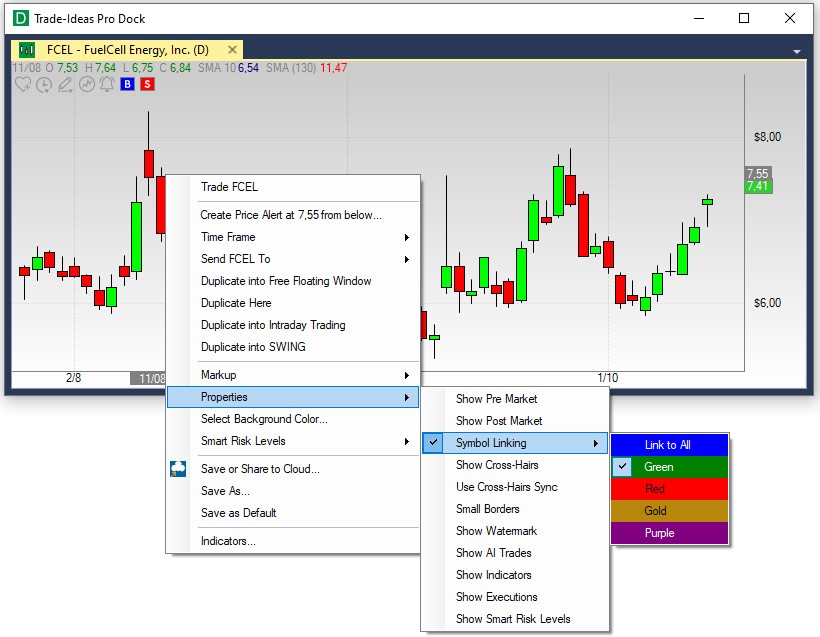
By default, all symbol-linked Windows belong to the blue, Link to All, Color Group.
The assigned color will always display in the top left-hand corner of each window.
You can create up to 4 additional Linking Groups and by doing so, link selected windows to a specific Chart or Single Stock Window, which is very useful when monitoring various scans.
There are two ways to create a Linking Group:
- Option 1
You can assign windows to a specific Color Group individually. To do so, right-click into your window, select Symbol Linking, and choose a color from the dropdown. The selected window will now display the Color Group in the top left-hand corner.
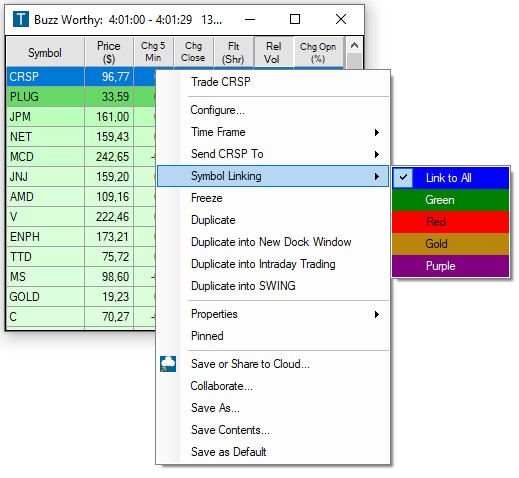
Next, right-click into your Single Stock Window and select Symbol Linking.
Add a Checkmark to the left-hand side of the Symbol Linking option, then select a Color Group from the Symbol Linking dropdown.
Your Single Stock Window will now be linked to all the windows that belong to the same Color Group and update accordingly whenever you change the stock symbol in one of these windows.
Follow the same process with your Chart, right-click into it, select Properties, and then Symbol Linking. Now, add a Checkmark to the left-hand side of the Symbol Linking option. Thereafter, choose a Color Group.
Please note, that the Single Stock Window and Chart will also be linked to the Blue Color Group since this is the default Link to All Group.
- Option 2
To establish a Linking Group for a number of windows at once, go to the Toolbar, open the Tools Tab, and select, Symbol Linking Channels.

The next window will display all the Trade Ideas windows currently in use.
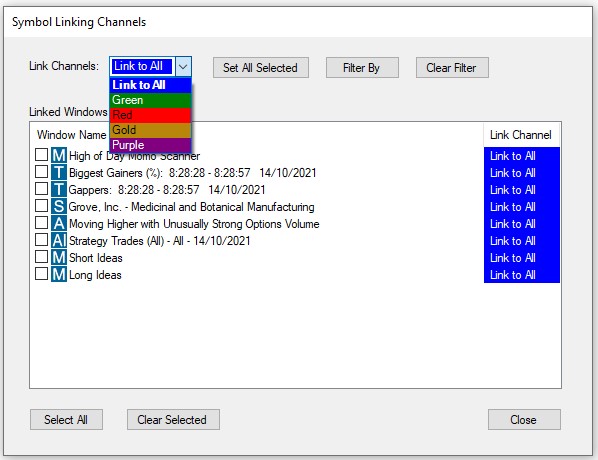
By default, each window is assigned to the blue, Link to All, Linking Group.
To establish a new Linking Group, select the windows that will be part of the new Linking Group by adding a checkmark.
You can select all windows at once by choosing, Select All, at the bottom.
You can clear your selection by selecting, Clear Selected, at the bottom.
Once you have selected the windows, open the Link Channels dropdown in the top left-hand corner. Select a color for your new Linking Group, then choose, Set All Selected, to assign the windows.
All the selected windows will now display the color of the Linking Group you have assigned them to.
To see all windows that are assigned to a specific Linking Group, choose the Group Color from the Link Channels dropdown, then select, Filter By. To see all available windows, select, Clear Filter.
Once you have assigned the windows, select Close.
All the windows that you assigned to a Linking Group will now display the Group Color in the top left-hand corner.
Any Single Stock Window or Chart that has been assigned to the same Color Group will update accordingly, whenever you change a stock symbol in one of the other Linking Group windows.
Holly AI History & Performance
The History Feature allows you to analyze Holly’s past trades. You can select specific days or a time period.
To access the function, right-click into the AI Strategy Trades Window and select one of the following three options:
- History: Signals in the Money
The Signals in the Money Window allows you to see Holly’s past trades for the chosen time period ranked by long-term profit in percent with the highest return at the top and ending at 0%.
- History: Signals out of the Money
The Signals out of the Money Window allows you to see Holly’s past trades for the chosen time period ranked by long-term profit in percent starting at 0% and descending into negative values.
- History: All
The All History Window allows you to see all Holly’s past trades for the chosen time period ranked by long-term profit in percent starting at the highest percentage return and ending at the lowest percentage return.
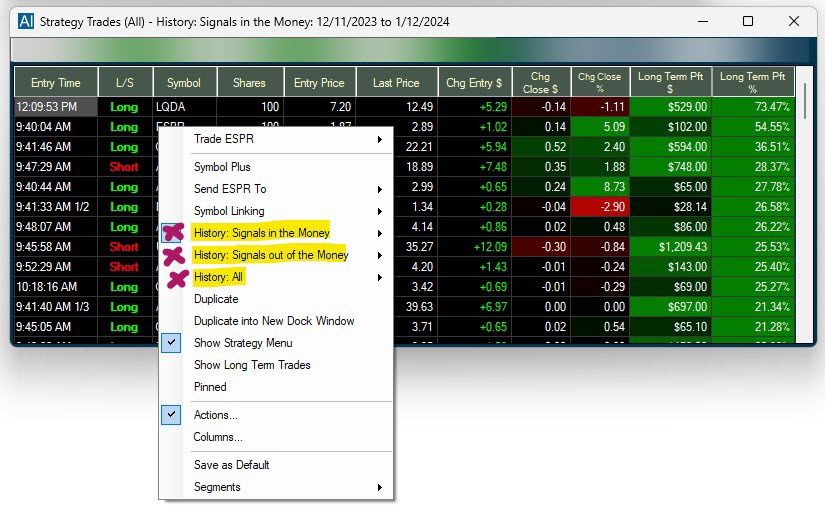
Each option allows you to refine the results by selecting specific days or a time period for your review.
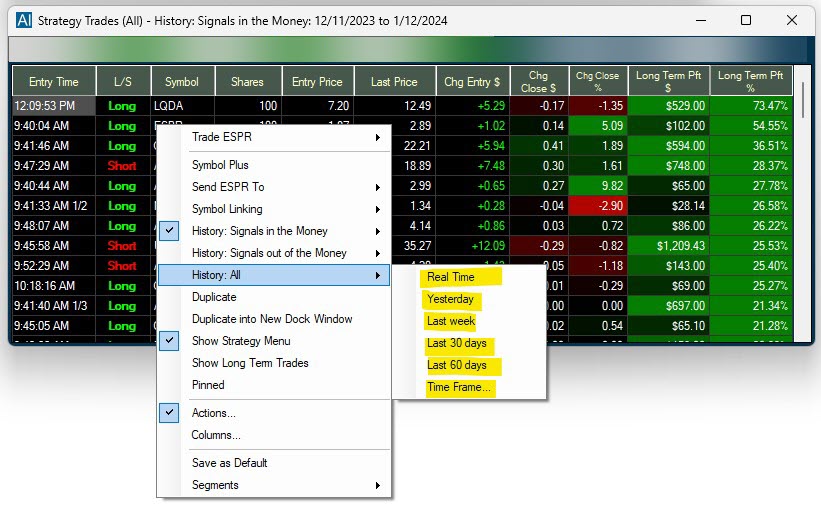
You can sort the output of these History Windows by specific columns.
To transfer the column entries into a spreadsheet, highlight the rows either by clicking and holding down your left mouse key while moving over the rows or by pressing the Control and A key on your keyboard. To copy your selection, press the Control and C key on your PC’s keyboard. Finally, press the Control and V key to paste the selected rows into your spreadsheet.
Go to the Toolbar, select Options, Layouts, and then Highlight grid row upon selection to highlight entire rows with one mouse click. If this setting is disabled, you can highlight single columns.

To see some of Holly AI's great past trades have a look at our Holly Records Page
Duplicate
To copy your current Trade Ideas Window, use the Duplicate function. Simply right-click into your AI Strategy Trades Window and select Duplicate from the dropdown.
You will get an exact copy of the current window, which you can modify while keeping the original window intact.
Duplicate into New Dock Window
To open a copy of a free-floating window in a new Dock, right-click into the free-floating window and select Duplicate into New Dock Window. An exact copy of your free-floating window will now be opened in a new Dock.
Duplicate into XYZ Dock
To load a copy of a free-floating window into an already open Dock, right-click into the free-floating window and select Duplicate into XYZ Dock, where XYZ stands for the Name of that particular Dock. An exact copy of your free-floating window will now be added to the chosen Dock.
Show Strategy Menu
You can choose to show or hide the Strategy Menu, which contains the Profit & Loss Top Menu on the top left-hand side of the window as well as the two filter options on the top right-hand side.
Simply right-click into the AI Strategy Trades Window and check or uncheck Show Strategy Menu.

Pinned
To keep a single Trade Ideas window on your screen permanently, even when switching layouts, or toggling through channels, right-click into the specific window, and select Pinned from the dropdown. The Pinned Feature, is available for all Trade Idea Windows, including Scans, Charts, Compare Count, and the Holly AI Windows.
Once a window is pinned, it does not follow the behavior of the other windows.
This is useful if you would like to include one or more windows of a channel in a custom layout, without saving the individual windows to the cloud first.
It is important to note, that this window will stay open until you decide to unpin it. When accidentally saved within a layout, It might load multiple times, when closing and re-opening this layout. At worst, you will have multiple versions of the window all running on top of each other in the same position. This can put a strain on system resources and drastically impact software performance. The pinning option should therefore be used very carefully and consciously. A window should always be unpinned after the desired action is completed.
To do this, right-click into the window and remove the checkmark on Pinned.
To see all pinned and unpinned windows, or to close them, go to the Toolbar, select Windows, and choose, Close All Unpinned, or Close All Pinned.
Actions - Sound Notifications
Whenever Holly enters a new trade, the entire entry row will flash, giving you a visual clue.
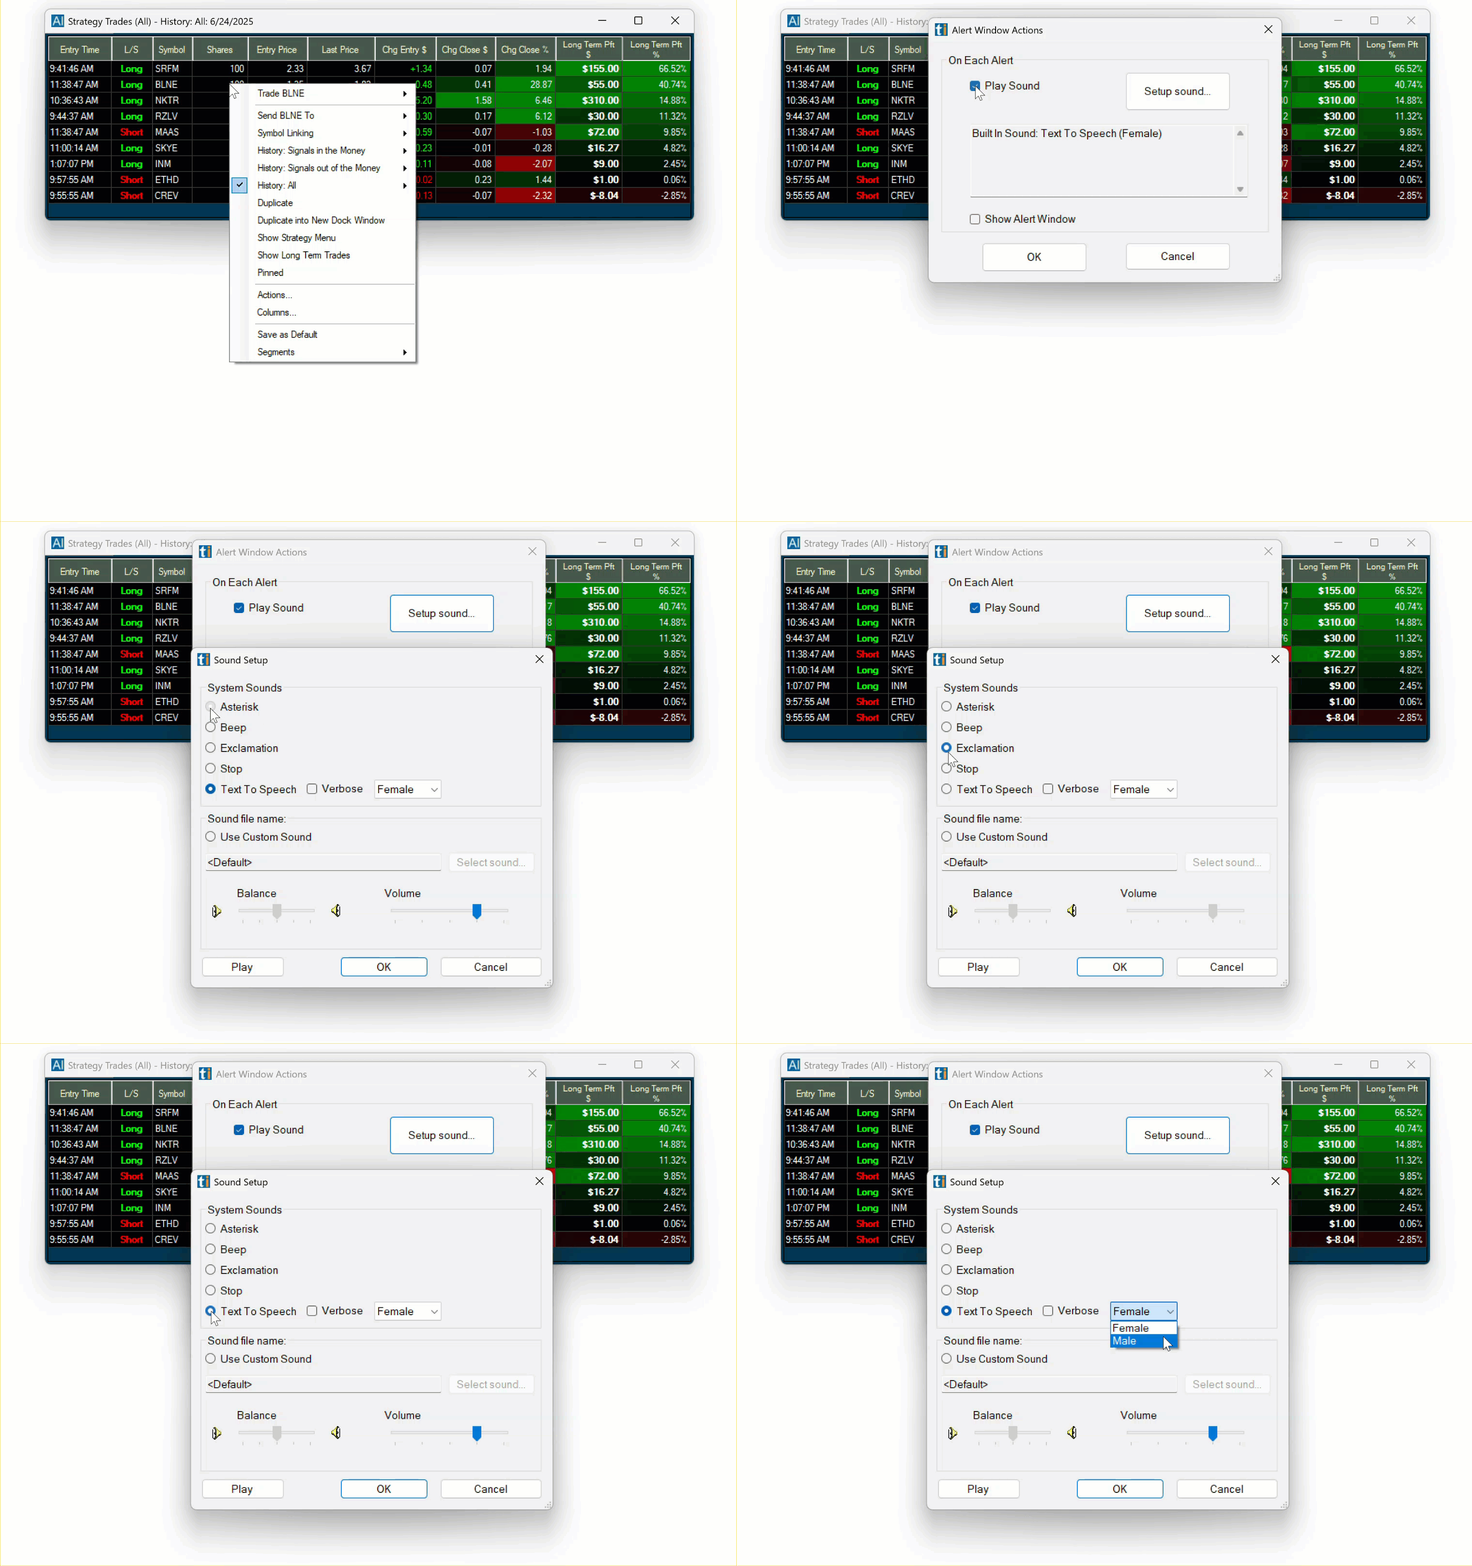
To enable additional Sound Notifications, right-click into the AI Strategy Trades Window and select Actions.
-
Check Play Sound in the new popup window.
-
Then click Set Up Sound.
-
The next window will display built-in sound options. You can choose an asterisk, a beep, exclamation, a stop, or text to speech. If you choose the Text-To-Speech, a female or male voice will call out each stock symbol that triggers. Verbose will mention more details about the trade. Further below, you can choose a custom sound from your local computer (WAV format only).
-
Once you have selected a Sound Option, click Play to test the audio. Use the Balance and Volume sliders to adjust the sound to your liking.
-
Hit Okay when you are done.
Columns
The columns can be reorganized via left-click drag and drop. The individual columns can also be extended or compressed by using your mouse.
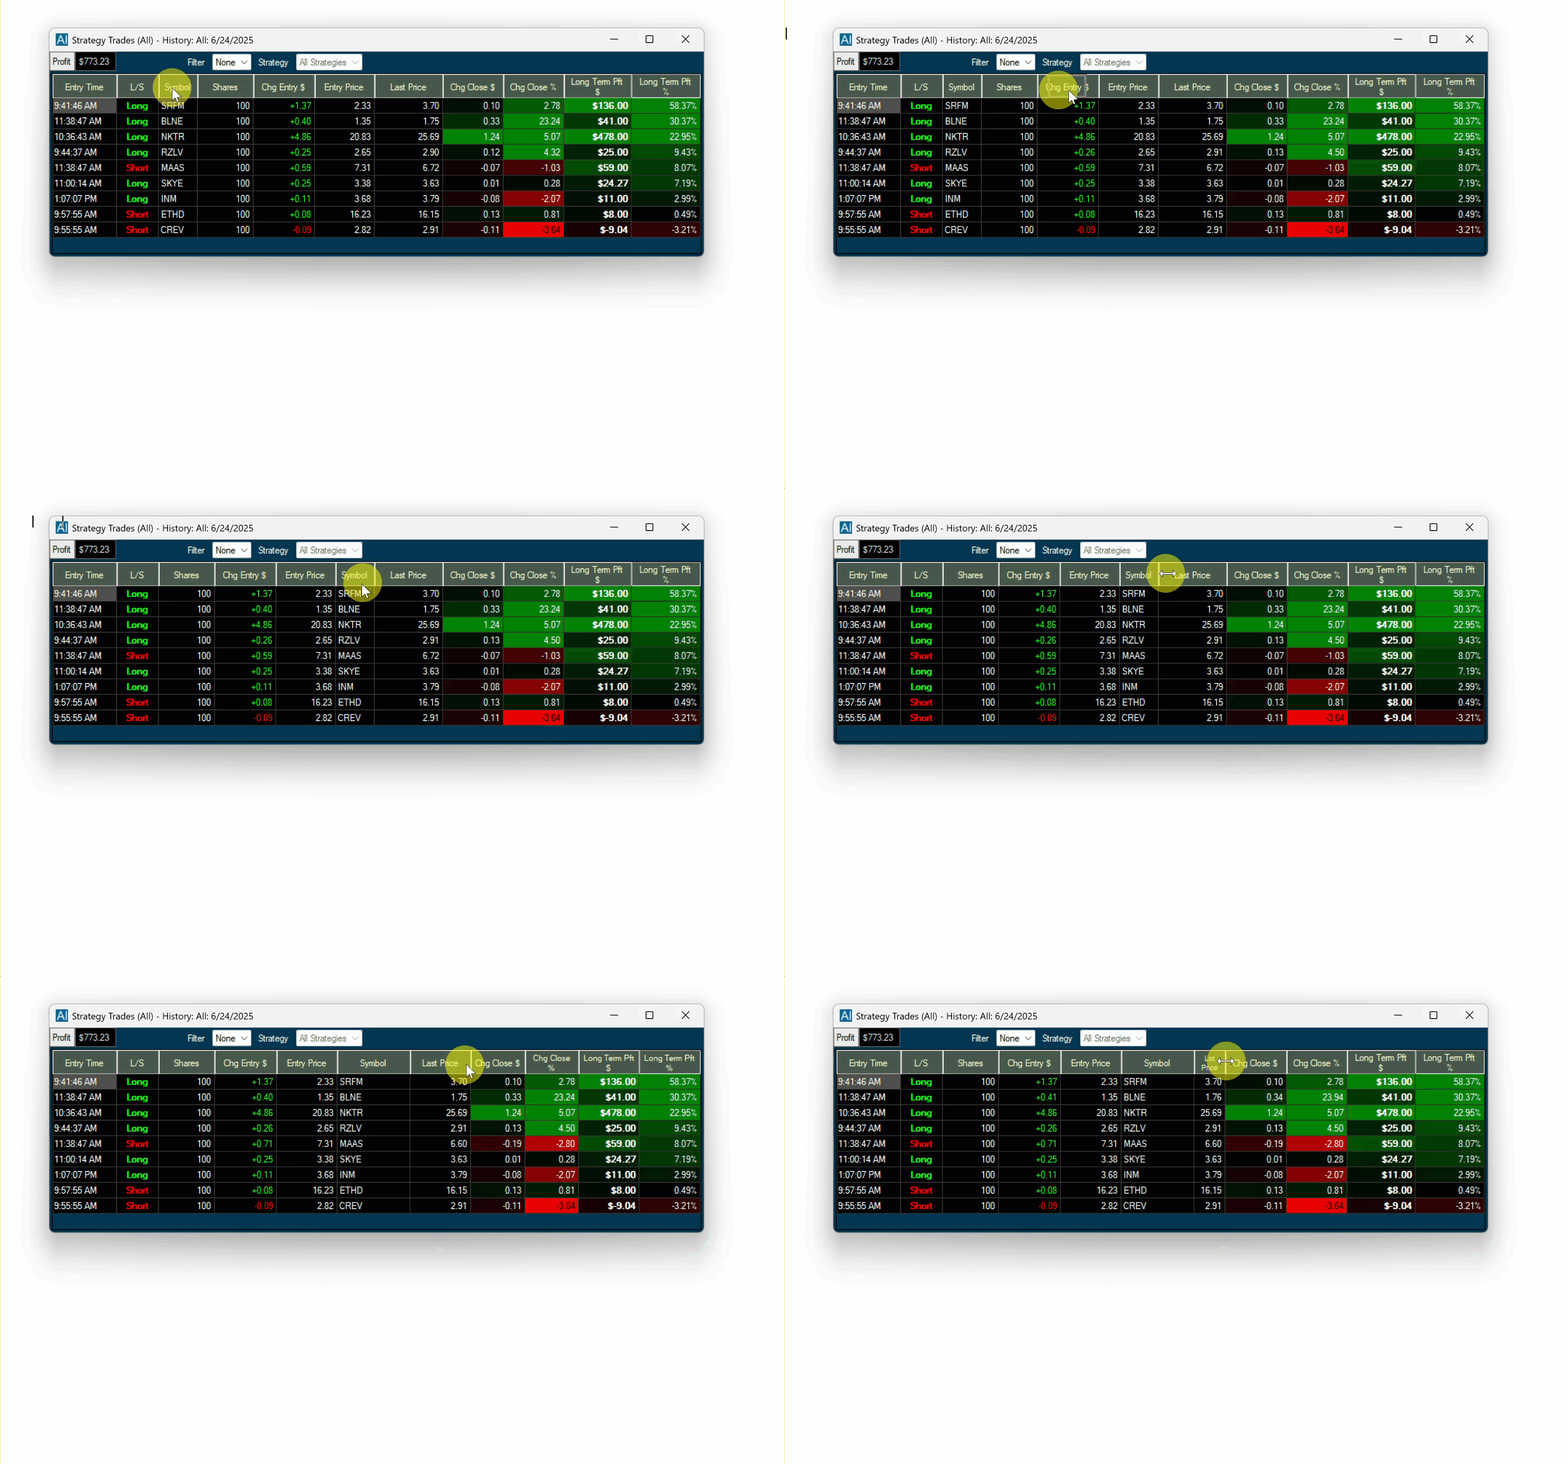
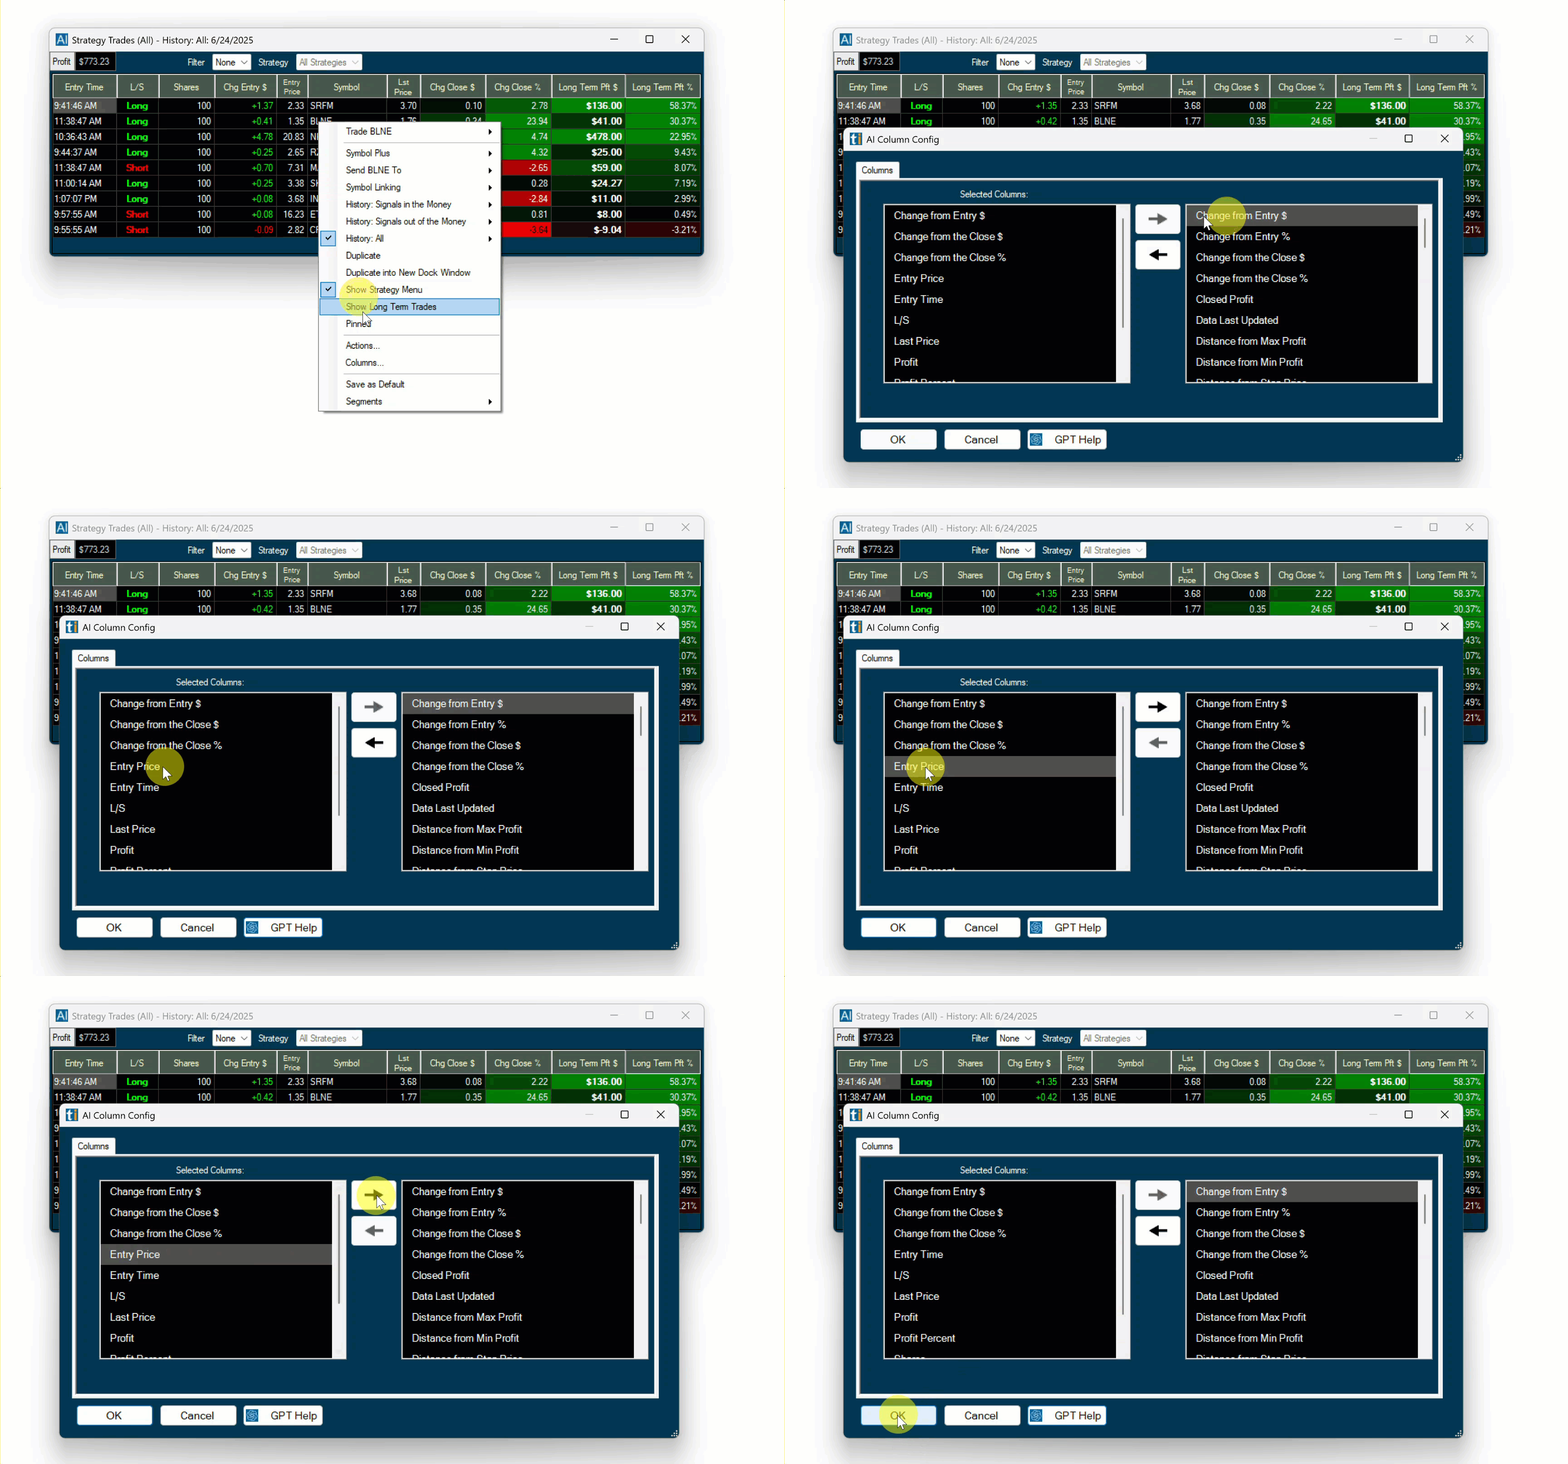
To add more columns right-click into the window and select Columns.
The left-hand side shows the already listed columns, the right-hand side shows the columns that can be added.
Select additional columns by highlighting them with a left mouse click.
Click the arrow pointing to the left to move them to the Selected Columns field.
To remove any of the already selected columns, highlight the column, then click the arrow pointing to the right.
Click OK when you are done.
Reentry Feature
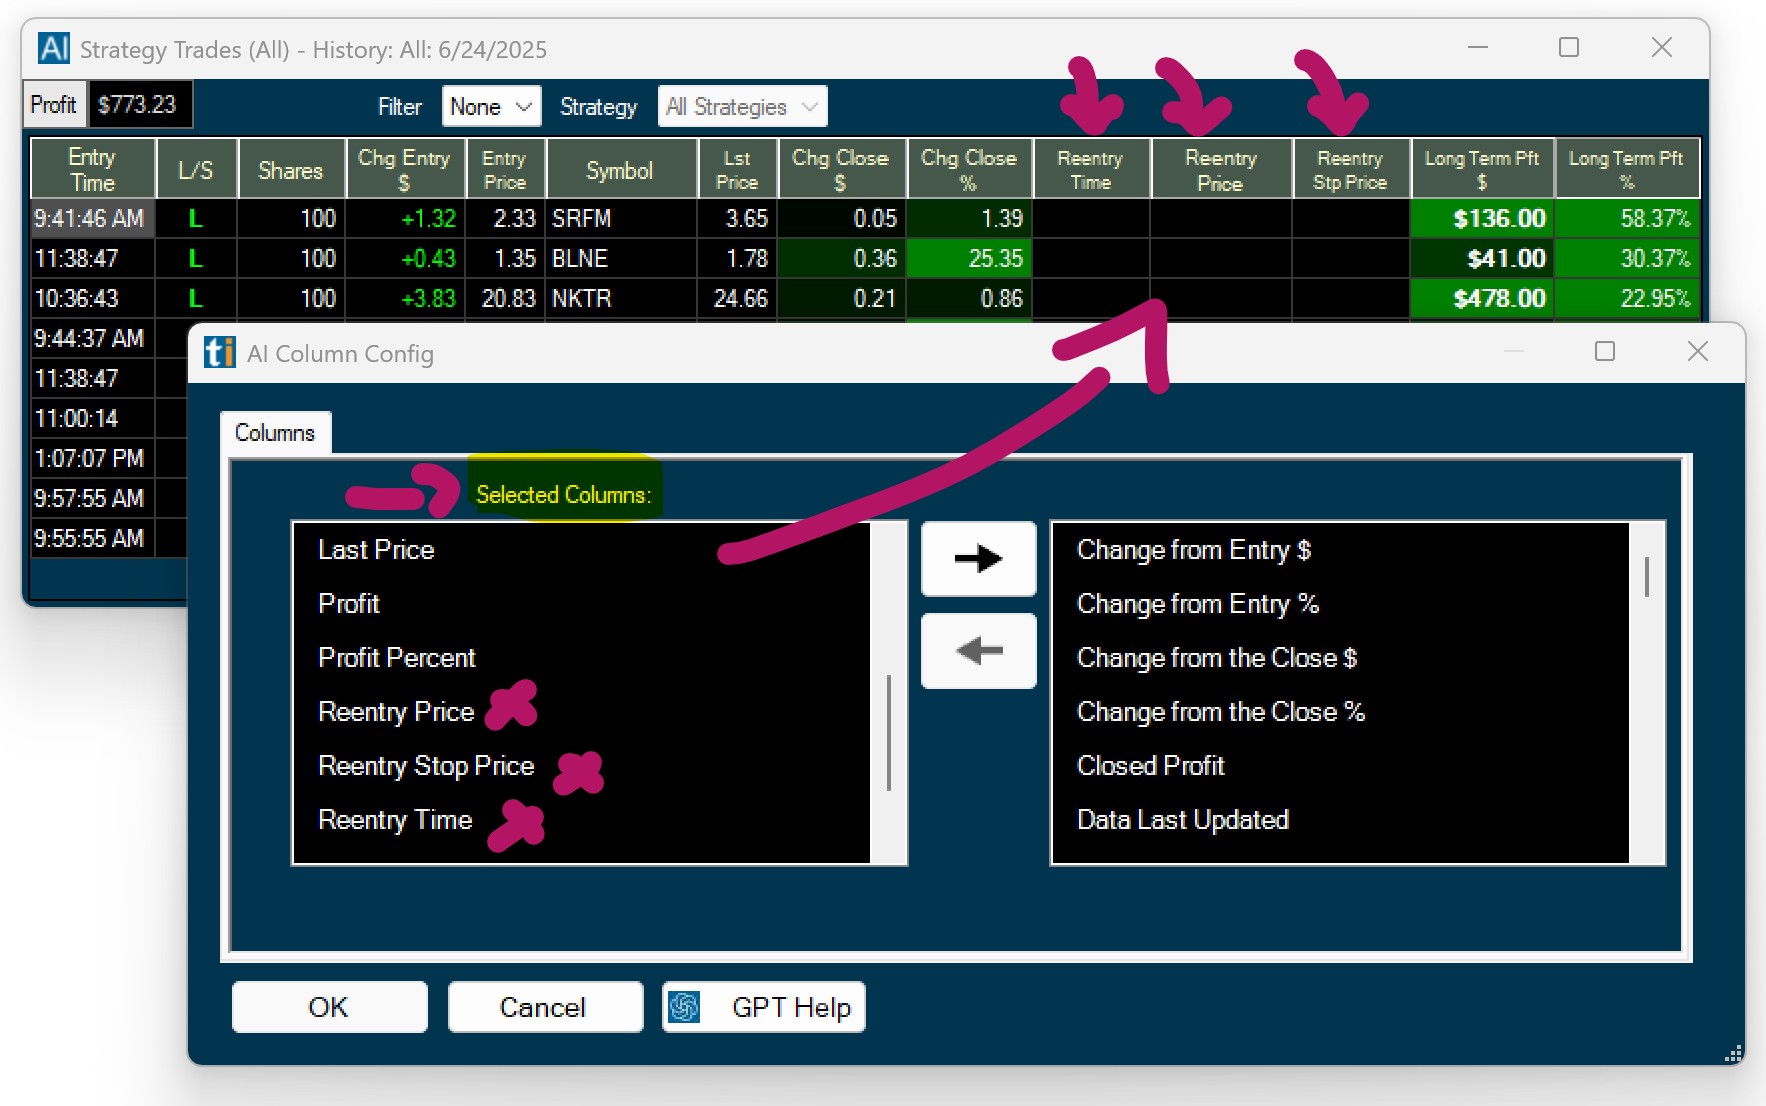
If a stock rallies back up or down after Holly's Stop has been hit, she will re-enter the trade once the price reaches the halfway level between the stop price and her initial entry. Her initial Stop will stay in place. Reentries are treated as new trades and have no impact on the P&L of the initial trade.
You can see Holly’s Reentry Time and Reentry Price by selecting and adding the corresponding columns via the right-click Menu.
Save as Default
You can save a window and its configuration as the default version of this window type by right-clicking and choosing Save As Default. Whenever you now open a new window of this type from the New Tab of your Toolbar, the window configuration that you saved as default, will load.
The Load Window option, which you can find in the File Tab of the Toolbar, provides access to all the default versions of your Trade Ideas windows. The default layouts of your Chart, Single Stock, Brokerage Plus, and AI Windows are saved in the TradeIdeasPro folder on your local computer.
Segments
Holly consists of three Segments, namely Holly Grail, Holly 2.0, and Neo, who all employ different strategies. To switch to a specific Holly Segment, select Segments and make your choice.
Premium AI Longterm Strategy Trades Window
Holly exits all her trades at the end of each trading day. However, the trade catalysts don’t simply expire when the stock market closes. Some of these triggers offer the potential to catapult a stock over the course of several days or weeks in the direction of the day’s trading signal.
The AI Longterm Strategy Trades Window enables you to see these trades.
Traders can now benefit from Holly’s carefully selected trades beyond the initial trading day, and easily track them.
To load this window, go to the Toolbar, open the File Tab and select Premium AI Longterm Strategy Trades Window:

All stocks listed in the Long Term Strategy Trades Window fit one of the following criteria:
-
When the original trade was a Long Trade, they are either making new highs or are moving from red to green.
-
When the original trade was Short Trade, they are either making new lows or are moving from green to red .

Each thumbnail chart relays the following info:
-
The Direction of the Trade (Buy/Sell)
-
The Original Entry Price
-
The Current Price of the Stock

Below each thumbnail chart you will find the following info:

-
The Direction of the Original Holly AI Trade (Long or Short)
-
The Original Entry Price
-
The Date of the Original Trade
-
The Signal Price, which is the price that triggered the stock being added to the Longterm Holly AI Strategy Trades List
-
The Total Change in $, which is the difference in dollar between the Original Entry Price and the Signal Price
-
The Total Change in %, which is the difference in percent between the Original Entry Price and the Signal Price
-
The Total Number of Profitable Days counted from the Original Entry Date
By default, the thumbnail charts are sorted by Signal Time, from left to right.
Clicking the top arrows on the left and right-hand side enables you to move through the list.
The total number of stocks on the list as well as the current position are displayed on these arrows.

A click on the bottom arrow on the right-hand side will bring you to the last stocks on the list, a click on the bottom arrow on the left-hand side will bring you back to the first entries.

A click on the thumbnail header will load the stock in any symbol-linked chart

To see Holly AI Trade details in your chart, right-click into the chart, select Properties and then Show AI Trades

To see all longterm Holly AI trades in grid view, right-click into the Long Term Strategy Trades Window and select Show Data Grid.

This will open the Long Term Strategy Trades Data Grid

By default, the thumbnail charts are sorted by Signal Time Descending from left to right.
A double-click on a data grid colum header will change the sort order of the thumbnails accordingly.

To remove stocks from the list, simply click on the X in the top right-hand corner of the thumbnail chart.

To reverse the symbol removal, right-click into the window and select, Clear Removed Symbols.
To add indivudal removed symbols back to the list, select Add Removed Symbols, then select the specific symbol(s) from the dropdown.
Audible Trade Notifications
Whenever Holly enters a new trade, the entire entry row will flash, giving you a visual clue.
To enable additional Sound Notifications, right-click into the AI Strategy Trades Window and select Actions.

-
Check Play Sound in the new popup window.
-
Then click Set Up Sound.
-
The next window will display built-in sound options. You can choose an asterisk, a beep, exclamation, a stop, or text to speech. If you choose the Text-To-Speech, a female or male voice will call out each stock symbol that triggers. Verbose will mention more details about the trade. Further below, you can choose a custom sound from your local computer (WAV format only).
-
Once you have selected a Sound Option, click Play to test the audio. Use the Balance and Volume sliders to adjust the sound to your liking.
-
Hit Okay when you are done.
Holly AI History & Performance
The History Feature allows you to analyze Holly’s past trades. You can select specific days or a time period.
To access the function, right-click into the AI Strategy Trades Window and select one of the following three options:
- History: Signals in the Money
The Signals in the Money Window allows you to see Holly’s past trades for the chosen time period ranked by long-term profit in percent with the highest return at the top and ending at 0%.
- History: Signals out of the Money
The Signals out of the Money Window allows you to see Holly’s past trades for the chosen time period ranked by long-term profit in percent starting at 0% and descending into negative values.
- History: All
The All History Window allows you to see all Holly’s past trades for the chosen time period ranked by long-term profit in percent starting at the highest percentage return and ending at the lowest percentage return.

Each option allows you to refine the results by selecting specific days or a time period for your review.

You can sort the output of these History Windows by specific columns.
To transfer the column entries into a spreadsheet, highlight the rows either by clicking and holding down your left mouse key while moving over the rows or by pressing the Control and A key on your keyboard. To copy your selection, press the Control and C key on your PC’s keyboard. Finally, press the Control and V key to paste the selected rows into your spreadsheet.
Go to the Toolbar, select Options, Layouts, and then Highlight grid row upon selection to highlight entire rows with one mouse click. If this setting is disabled, you can highlight single columns.

To see some of Holly AI's great past trades have a look at our Holly Records Page
How to use Holly
There is more than one way to incorporate Holly into your trading:
Option 1: Holly Hands-On
Follow Holly's trades by placing orders manually
Option 2: Holly One-Click
Follow Holly's trades via One-Click Trading from the AI Strategy Trades Window or our Charts
Option 3: Holly from Charts
Follow Holly's trades via One-Click Trading from our Charts
Option 1: Trade Holly Hands-On
One easy way of benefiting from Holly's Trading Signals is to monitor her real-time trade suggestions via the AI Strategy Trades Window and then placing the orders manually in your Broker's Account.
This is the way to go, if you have an account at a Brokerage that doesn't connect to our Brokerage Plus Module.
Our External Linking feature makes placing an order manually in your trading account a breeze.
Set up Sound Alerts to get notified whenever Holly places a new trade, then check the chart and trade parameters.
If the stock is in your price range and you like the setup, follow Holly's example and enter the share size, stop loss, and target price manually into your brokerage platform.
Don't get discouraged if you don't manage to enter at the exact same time and price as Holly. Most of her trades are not set to only last seconds. Keep evaluating the trade as it progresses and feel free to take partial profits or to exit earlier or later than Holly.
Always remember, the combination of human and machine is much more powerful than each on their own.
Option 2: One-Click Trading
Our Brokerage Plus Module enables you to trade directly from our Trade Ideas charts or the AI Strategy Trades Window via one-click while sending your orders to participating brokers or our simulator.
This is the way to go, if you would like to trade one of Holly's stock picks, but you would like to apply your own entry and exit parameters to the trade.
-
Step 1: Choose and setup your preferred connection
-
Step 2a: Right-click into the Chart and select Trade XYZ

OR
-
Step 2b: Right-click into the AI Strategy Trades Window and select Trade XYZ

-
Step 3: Select one of the Preset Order Templates or your own Preset Trading Strategy.

To learn all about Preset Order Entry Templates and how to create them, visit this section of the main User Guide.
-
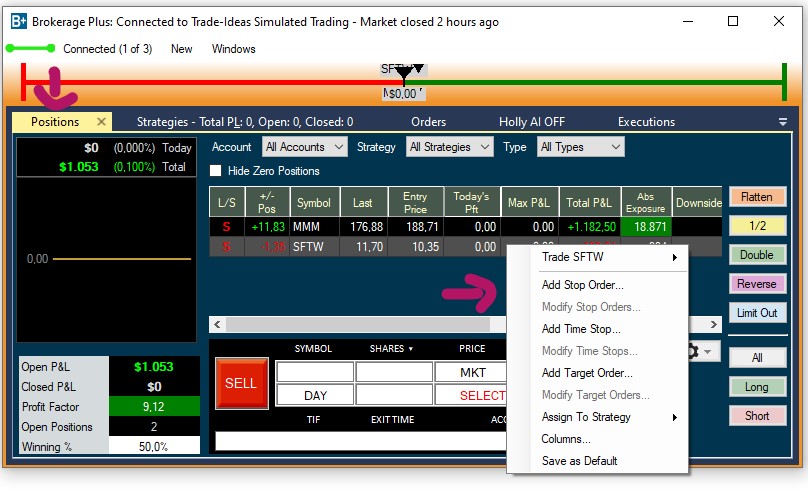
Step 4: Monitor the executed trades in the Positions Tab
Once executed, your trade will be displayed in the Positions Tab of Brokerage Plus, where you can modify targets and stops as well as flatten the trade.
Option 3: Chart Trading
Our Brokerage Plus Module enables you to trade directly from our Trade Ideas charts while sending your orders to participating brokers or our simulator.
-
Step 1: Choose and setup your preferred connection
-
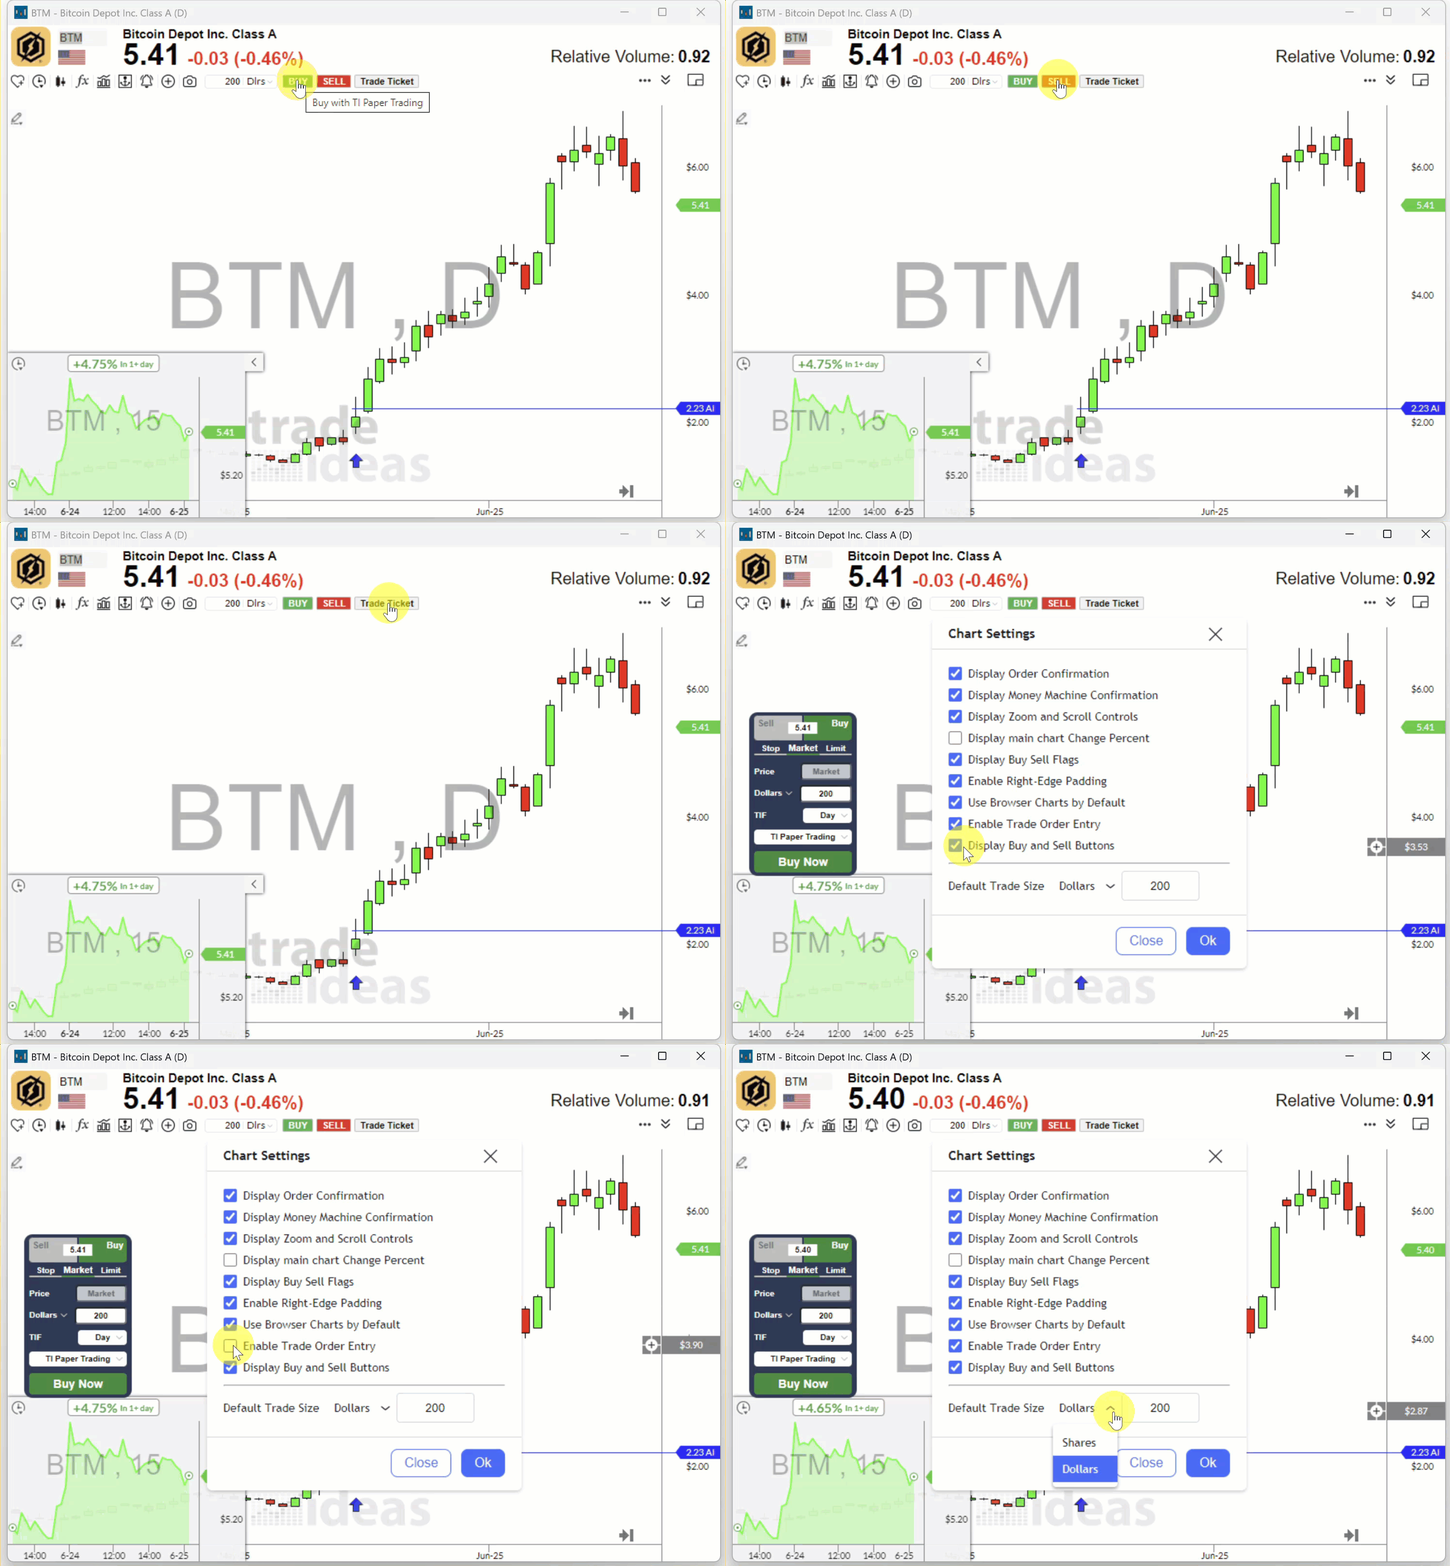
Step 2: Use the Chart Buy and Sell Buttons or our latest Chart Trading Feature Trade Ticket
-
Click once on either the Buy or the Sell Icon
-
A dotted horizontal line will now appear when you move your cursor
-
Move your cursor to the price level in the chart at which you would like to buy/short the stock
-
Click into the chart to place your order
-
Your Default Chart Long Strategy or Default Chart Short Strategy will now automatically be applied.
By default, the Chart Buy and Sell Buttons will submit a Market Order of $5000 worth of shares.
For Long Trades, a Stop Loss Order will be placed at the Low of the Day and for Short Trades, it will be placed at the High of the Day.
Your order will be sent directly to your brokerage/simulator with the configured Entry and Exit parameters.
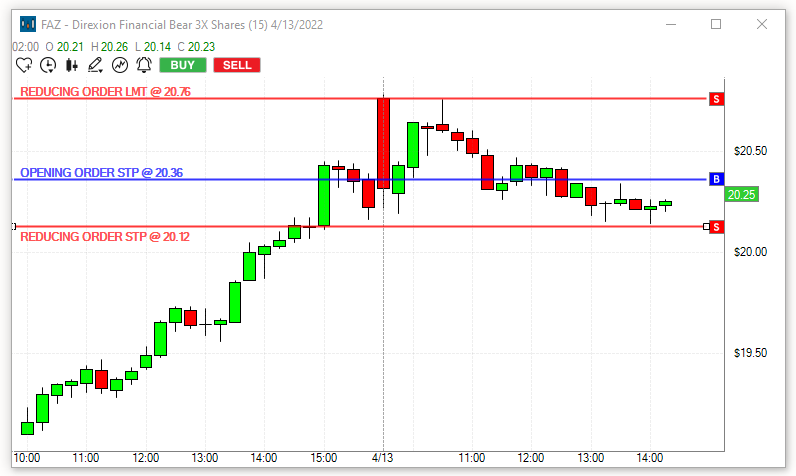
Your trade will also be displayed in the Positions Tab of Brokerage Plus. Whenever you adjust the Target or Stop, by moving the line on the chart, it will automatically be updated in Brokerage Plus as well.
Troubleshooting Tip:
If your Buy and Sell Chart Icons are ready to be used, they will be green/red.
If the Buy and/or Sell Icons are greyed out, you are either not connected to your Brokerage/Simulator or have not enabled a strategy as your Default Chart Long Strategy and/or Default Chart Short Strategy.
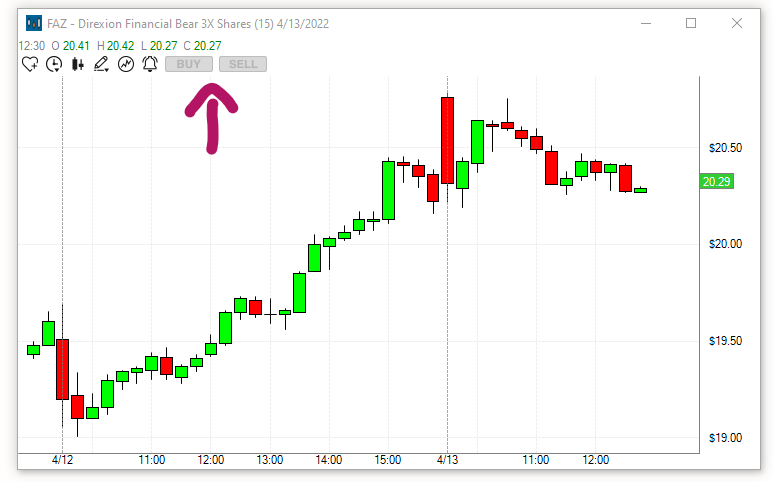
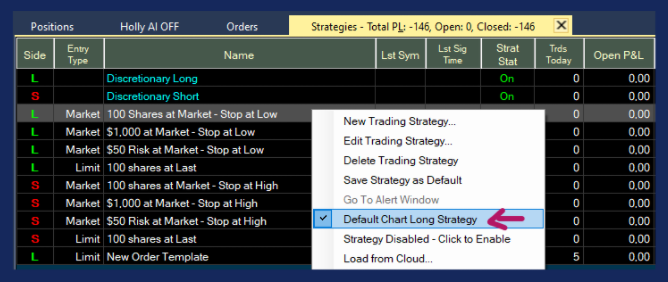
If you have already set up a One-Click Order Entry Template or would like to use one of the Preset One-Click Order Entry Templates as your default Chart Trading Strategy, follow these steps.
-
Open the Brokerage Plus Module Learn More
-
Head to the Strategies Tab
-
Highlight the Trading Strategy you would like to use
-
Right-click and check Default Chart Long Strategy or Default Chart Short Strategy.
If you would like to apply personalized Stops and Targets to your Chart Order and have not yet set up a One-Click Order Entry Template, follow the steps in this section first.
Holly Connection
You can trade Holly's picks in our Simulator, in a participating Broker's Simulator, in your Live Account at a participating Brokerage or in any other Brokerage Account you may have.
The three different setups will be discussed in the following sections.
Connect to the Trade Ideas Simulator
To trade Holly's picks in the Trade Ideas real-time Simulator, click the Brokerage Plus Sim button located in the Toolbar. This will establish an immediate connection to our in-house Trade Ideas Simulator.

Alternatively, you can access the Brokerage Plus Module from the Toolbar. Simply open the New Tab, and select Brokerage Plus.
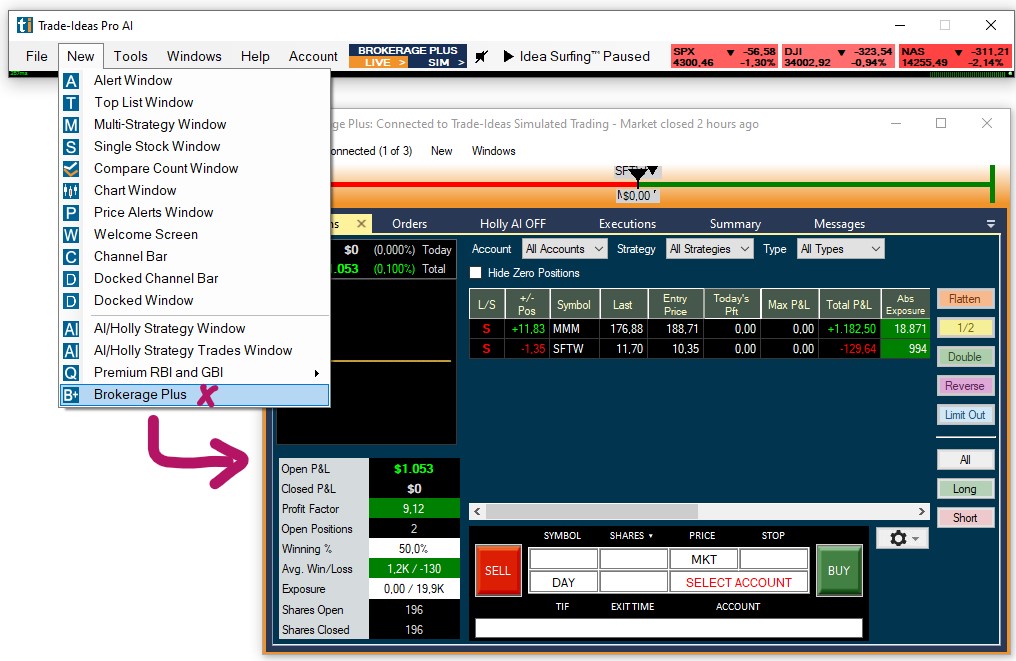
Then, open the Connect Tab of the Brokerage Plus Module and select Trade Ideas Simulated Trading - Connect from the dropdown.

The connection bar will turn green and the Connect Tab will display the number of established connections in brackets.
Once connected to our paper trading, you can trade Holly's signals manually via our Order Entry Panel, trade her stock picks directly from our charts, or trade from the AI Strategy Trades Window by right-clicking and selecting Trade XYZ.
To disconnect, click the Connect Tab, and select Trade Ideas Simulated Trading - Disconnect
Holly and Interactive Brokers
To trade Holly's picks in your Interactive Brokers Paper Trading or Live Account follow the steps in this tutorial. The setup for both accounts is identical except for the port number.
Since Interactive Brokers blocks the API connection of IB Lite Accounts, you will need to have an IB Pro Account to connect to Trade Ideas. Before the Brokerage Plus connection can be established, you need to configure Interactive Broker’s Trader Workstation.
Make sure to have a paid data plan from Interactive Brokers for the exchanges you would like to trade.
Open and log into Interactive Brokers Trader Workstation, choosing either Live Trading or Paper Trading.
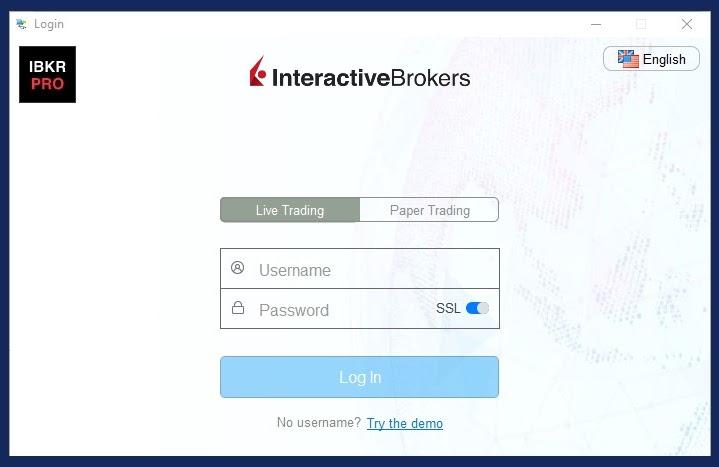
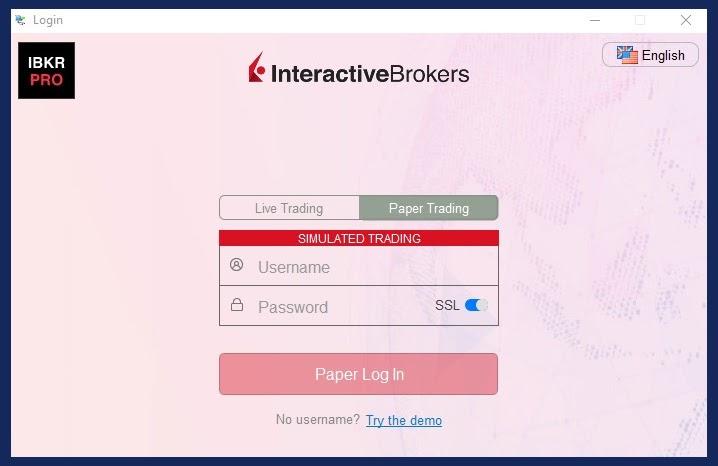
From the Trader Workstation Menu, select File, then Global Configuration.

Head to the API section Settings:
Make these three adjustments:
Check: Enable ActiveX and Socket Clients
Uncheck: Read-Only API
Select Socket Port Number 7496 to connect your Interactive Brokers Live Account,
Select Socket Port Number 7497 to connect your Interactive Brokers Simulated Account.

Thereafter, head to the API section Precautions:
Check all Bypass boxes to execute submitted orders immediately, without any further confirmation.
Uncheck all Bypass boxes if you would prefer to confirm the orders sent to Interactive Brokers before they are executed.
Hit Apply when you are done.

Now, open the Brokerage Plus Window from the Toolbar.

Click the Connect Tab in the upper left-hand corner of the Brokerage Plus Window.
Select Interactive Brokers - Connect from the dropdown.

As Client ID enter 0 or 1.
As TWS Login Type, choose TWS Live to connect to your Live Account or TWS Paper to connect to your Simulated Account.
Make sure, the Socket Port in Interactive Brokers' Trader Workstation corresponds (7496 for your IB Live Account and 7497 for your IB Simulated Account).
Click Connect.

You will now see a green connection bar next to the Connect Tab of Brokerage Plus.
Once connected to your IB account, you can trade Holly's signals manually via our Order Entry Panel, trade her stock picks directly from our charts, or trade from the AI Strategy Trades Window by right-clicking and selecting Trade XYZ.
To disconnect, click the Connect Tab, and select Interactive Brokers - Disconnect
Connect to ETrade
To trade Holly's picks in your ETrade Live Account follow the steps in this tutorial.
First, open the Brokerage Plus Window from the Toolbar.

Click the Connect Tab in the upper left-hand corner of the Brokerage Plus Window.
Select ETrade - Connect from the dropdown.

This will open the ETrade Login Page in your default web browser.
Log into your ETrade Account with your ETrade username and password.
Accept ETrade's connection to Trade Ideas.

Accept ETrade's connection to Trade Ideas:

Copy the 6 digit code provided.
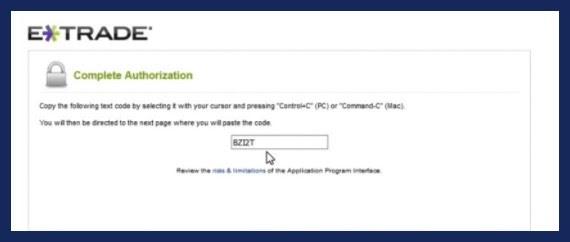
Minimize your browser window and paste it into the Connect to ETrade field of our software. Then, click Connect:

You will now see a green connection bar next to the Connect Tab of Brokerage Plus.
Once connected to your ETrade account, you can trade Holly's signals manually via our Order Entry Panel, trade her stock picks directly from our charts, or trade from the AI Strategy Trades Window by right-clicking and selecting Trade XYZ.
To disconnect, click the Connect Tab, and select ETrade - Disconnect
Lastly, make sure to have a data plan from ETrade for the exchanges you would like to trade.
Positions Tab
Once executed, your trades will be displayed in the Positions Tab of the Brokerage Plus Module, where you can monitor and modify them.
To change the parameters of any of your positions, highlight it, then right-click.
This will bring up a dropdown menu with various options.

Modify Stop Order
To adjust an already placed Stop Loss, highlight your position, then right-click and select Modify Stop Order. Thereafter, choose a preset value for your Stop Loss or enter an exact price.

Alternatively, you can move your Stop Loss, which is displayed as a line on your chart including the projected loss value, right on the chart.

Modify Time Stop
To modify a Time Stop, highlight your position, then right-click and select Modify Time Stop. Thereafter, choose a time.

Add Target Order
To add a Target Order to your trade, highlight your position, then right-click and select Add Add Target Order. Thereafter, choose a value. The newly added Target Order will be displayed in a column in the Positions Tab as well as on the chart of the stock as a line together with the projected profit value.

Modify Target Order
To adjust an already placed Target Order, highlight your position, then right-click and select Modify Target Order. Thereafter, choose a preset value.

Alternatively, you can move your Target Order, which is displayed as a line on your chart together with the projected profit value, right on the chart.

Columns
The columns of the Positions Tab can be reorganized via drag and drop with your mouse. The individual columns can also be extended or compressed by using your mouse. To sort the data by a column, double-click on the column header.
To add more columns right-click into the Positions Tab field and select Columns.

The left-hand side shows the already listed columns, the right-hand side shows the columns that can be added.
Select additional columns by highlighting them with a left mouse click.
Click the arrow pointing to the left to move them to the Selected Columns field.
To remove any of the already selected columns, highlight the column, then click the arrow pointing to the right.
Click OK when you are done.
Gear Icon Options
Show Profit & Loss Graph
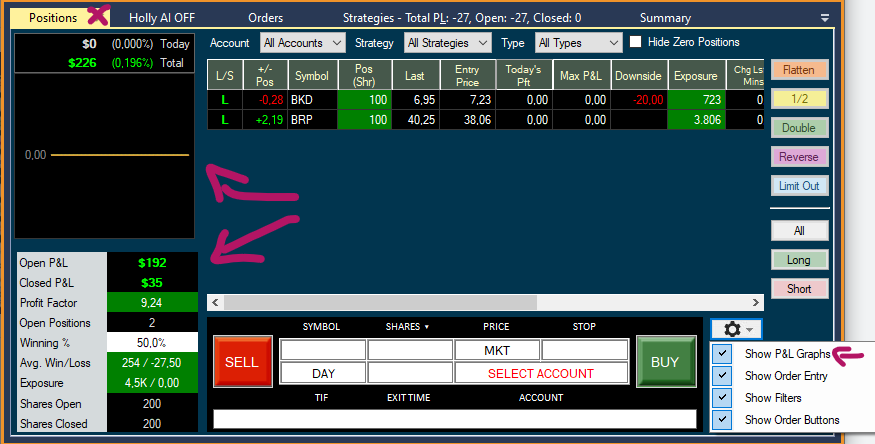
To display the Profit & Loss Graph as well as other performance statistics about your trades in the Positions Tab, click the Gear Icon in the bottom right-hand corner and select Show P&L Graphs.
The Positions Tab Graph displays the Total Trading Profit & Loss of all your Trades.
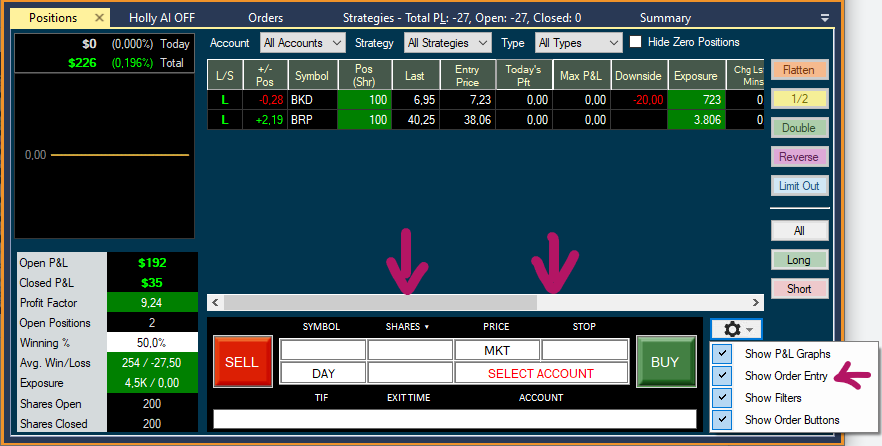
Show Order Entry
To display the manual Order Entry Panel in the Positions Tab of the Brokerage Plus Window. Click on the Gear Icon in the bottom right-hand corner and check the option Show Order Entry.
This will open the Order Entry Panel right inside the Positions Tab.
Show Filters
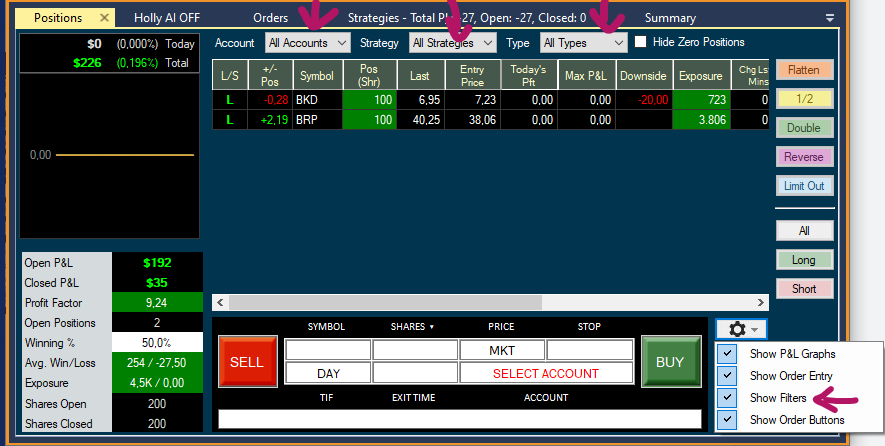
To add Filter functionality to your Positions Tab, click on the Gear Icon in the bottom right-hand corner and check the option Show Filters.
This will add three Filter options to the top of the Positions Tab. You can filter your positions by Trading Account, applied Trading Strategy as well as Open, Closed, Long, and Short.
Next to the three Filter dropdowns, you have the option to show or hide Zero Positions. Zero Positions are your completed trades.
Show Order Buttons
To add Rapid Order Buttons to your Positions Tab, click on the Gear Icon in the bottom right-hand corner and check the option Show Order Buttons.

-
Flatten will close the current positions by initiating a market order.
-
½ will half the number of shares by initiating a market order.
-
Double will double the number of shares by initiating a market order.
-
Reverse will close the current long/short positions and enter into new short/long positions by initiating a market order, which is double in size to the current order but trading in the opposite direction.
-
Limit Out enables you to exit one or all of your trades at once whilst applying a Limit Offset to the price that the stock is currently trading at. Highlight the position you would like to exit, then add the Limit Offset that you would like to apply to the current Bid/Ask price of the stock.
-
All highlights all your positions at once
-
Long highlights all your active Long positions at once
-
Short highlights all your active Short positions at once
Why Holly?
... because Holly Helps Everyone! No matter if you are a new Trader, a seasoned Trader, a Day Trader or a Swing Trader, you will be able to benefit from Holly and gain a definite edge in the market!
Holly and the New Trader
As a new Trader, you can quickly become overwhelmed by all the data streaming in. The immense amount of information is as exhausting as it is exciting. You haven't found your trading style yet and the stock market may seem like a vast ocean of unexplored territory. Navigating all that deep blue on your own might feel overwhelming, but with the help of our investment discovery engine Holly, it really doesn't have to be. Holly dives deep into the stock market and comes back with a map to guide your investment decisions. What would take a trader days or weeks, Holly accomplishes in seconds. She watches the stock market for you and analyzes the data as it comes in. When you log into your customized channel she tells you the trends, recommends the plan for getting in, as well as getting out, and shows you opportunities to make the most of your investment dollars.
As a new trader, you can learn a lot from Holly. See her as a mentor on your side who helps you navigate the markets. Monitor how she executes her trades, which strategies she applies, and which risk modes work best in which market.
Holly and the Seasoned Trader
Apart from utilizing Holly's tried and tested strategies, there is value in monitoring the performance of the different risk metrics. The Moderate Risk Mode outperforming the Conservative Risk Mode, for example, would be a strong signal to hold onto winners instead of taking quick profits. And conversely, if the Conservative Risk Mode is outperforming the Moderate Risk Mode, it is a strong indication that the market is choppy, and one would be best advised to take profits quickly or at least move up the stop in the direction of the trend. Holly’s strategy selection and direction can also give traders a good indication about what kind of a market to expect in the upcoming trading day. If Holly, for example, mainly chooses long strategies, one could take that as a sign to keep a close eye on all shorts.
Holly and the Swing Trader
Holly exits all her trades at the end of each trading day. However, the trade catalysts don’t simply expire when the stock market closes. Some of these triggers offer the potential to catapult a stock over the course of several days or weeks in the direction of today’s trading signal. A swing trader can use Holly’s carefully selected trades to create a watchlist of stocks that are suitable for a swing setup. You can point any of your scans at such a Symbol List and/or use them in combination with Price Alerts.
Have a look at this section of the main User Guide for step-by-step instructions on how to create and use Symbol Lists.
Following a simple routine could put you in a position to leverage the power of Trade Ideas’ Holly to identify statistically significant edges and gain potentially large profits.
Look at the weekly chart of MARA below for example. Holly traded this stock multiple times over days and weeks, a savvy swing trader looking for good setups, could have potentially ridden this trend all the way up.

Holly AI Performance
To see some of Holly AI's recent trades have a look at our Holly Records Page
Feel free to also browse through the collection of TI AI Updates below:
🆕 Trade Ideas AI Best Trades: 05/03/24
🆕 Trade Ideas AI Best Trades: 05/02/24
🆕 Trade Ideas AI Best Trades: 05/01/24
🆕 Trade Ideas AI Best Trades: 04/30/24
🆕 Trade Ideas AI Best Trades: 04/29/24
🆕 Trade Ideas AI Best Trades: 04/26/24
🆕 Trade Ideas AI Best Trades: 04/25/24
🆕 Trade Ideas AI Best Trades: 04/24/24
🆕 Trade Ideas AI Best Trades: 04/23/24-2
🆕 Trade Ideas AI Best Trades: 04/23/24-1
🆕 Trade Ideas AI Best Trades: 04/22/24
🆕 Trade Ideas AI Best Trades: 04/19/24
🆕 Trade Ideas AI Best Trades: 04/18/24
🆕 Trade Ideas AI Best Trades: 04/17/24
🆕 Trade Ideas AI Best Trades: 04/16/24
🆕 Trade Ideas AI Best Trades: 04/15/24
🆕 Trade Ideas AI Best Trades: 04/12/24
🆕 Trade Ideas AI Best Trades: 04/11/24
🆕 Trade Ideas AI Best Trades: 04/10/24
🆕 Trade Ideas AI Best Trades: 04/09/24
🆕 Trade Ideas AI Best Trades: 04/08/24
🆕 Trade Ideas AI Best Trades: 04/05/24
🆕 Trade Ideas AI Best Trades: 04/04/24
🆕 Trade Ideas AI Best Trades: 04/03/24
🆕 Trade Ideas AI Best Trades: 04/02/24
🆕 Trade Ideas AI Best Trades: 03/28/24
🆕 Trade Ideas AI Best Trades: 03/27/24
🆕 Trade Ideas AI Best Trades: 03/26/24
🆕 Trade Ideas AI Best Trades: 03/25/24
🆕 Trade Ideas AI Best Trades: 03/22/24
🆕 Trade Ideas AI Best Trades: 03/21/24
🆕 Trade Ideas AI Best Trades: 03/20/24
🆕 Trade Ideas AI Best Trades: 03/19/24
🆕 Trade Ideas AI Best Trades: 03/18/24
🆕 Trade Ideas AI Best Trades: 03/18/24
🆕 Trade Ideas AI Best Trades: 03/15/24
🆕 Trade Ideas AI Best Trades: 03/14/24
🆕 Trade Ideas AI Best Trades: 03/13/24
🆕 Trade Ideas AI Best Trades: 03/12/24
🆕 Trade Ideas AI Best Trades: 03/11/24
🆕 Trade Ideas AI Best Trades: 03/08/24
🆕 Trade Ideas AI Best Trades: 03/07/24
🆕 Trade Ideas AI Best Trades: 03/06/24
🆕 Trade Ideas AI Best Trades: 03/05/24
🆕 Trade Ideas AI Best Trades: 03/04/24
🆕 Trade Ideas AI Best Trades: 03/04/24
🆕 Trade Ideas AI Best Trades: 03/01/24
🆕 Trade Ideas AI Best Trades: 03/01/24
🆕 Trade Ideas AI Best Trades: 02/29/24
🆕 Trade Ideas AI Best Trades: 02/28/24
🆕 Trade Ideas AI Best Trades: 02/28/24
🆕 Trade Ideas AI Best Trades: 02/27/24
🆕 Trade Ideas AI Best Trades: 02/27/24
🆕 Trade Ideas AI Best Trades: 02/22/24
🆕 Trade Ideas AI Best Trades: 02/21/24
🆕 Trade Ideas AI Best Trades: 02/20/24
🆕 Trade Ideas AI Best Trades: 02/16/24
🆕 Trade Ideas AI Best Trades: 02/15/24
🆕 Trade Ideas AI Best Trades: 02/12/24
Ahead of the Pack: Today’s TI AI Market Winners TGLS & JMIA
Let’s quickly dive into how the Trade Ideas AI Holly turned market signals into cash for traders today – all before lunch!
Trade 1: TGLS – Swift Short
- Entry at $52.69, dipped to $49.61. 👀
- Profit: $3.08 per share, a quick 5.8% drop.
Just imagine: placing your trade in the morning and watching it hit the target before noon. That's Holly’s precision – spotting and seizing the dip instantly!
Trade 2: JMIA – Rapid Rise
- Bought at $6.51, peaked at $7.00. 🌟
- Gain: $0.49 per share, a speedy 7.5% jump.
Think fast: buying low, selling high, and all within a few hours? That’s a day’s pay, secured early. Holly’s not just watching; she’s acting – fast and effectively.
💡 Why You Need Holly
Miss these? Holly AI is here so you won’t next time. Her algorithms don’t just predict; they perform. With real-time adjustments, she’s your eyes on the market, hands on the trades, and brain on the numbers.
Quick decisions lead to quick gains. Don’t wait – Get Holly Today!
🎯 Act Now or Miss Out
You're reading this because you want in on actions like these. Why settle for less?
Let Holly Guide You – Subscribe Here!
P.S .Remember, while trading can be exciting, it’s not without risks. Holly's here to guide, but your decisions define your path. Ready to trade smarter?
Profit Magnet: The Holly AI Trade That Pulled in Big Bucks!
Let's dive straight into the trade that lit up our screens and should have you thinking seriously about how having a virtual trading assistant could turbocharge your trading strategy.
Outset Medical, Inc. (OM) – A Spectacular 34% Surge!
Today, our beloved Holly AI spotted an exceptional long opportunity in OM, signaling an entry at $3.88. For those who followed, the reward was a staggering high of $5.22 within 45 Minutes of the Entry Signal. That’s a whopping 34.54% climb! 📈
👀 Keep Your Eyes on the Prize
With Holly’s AI-driven insights, spotting such opportunities becomes routine. Here’s what you get when you partner with Holly:
- Early Entry Signals: Jump on opportunities before the crowd catches on.
- Calculated Stop Losses: We keep risks checked, here Holly placed it at $3.42, making sure your hard-earned money is protected.
- Great Profit Potential: As seen today, the sky’s the limit!
💡 Experience Smart Trading Today 💡
PS: Trading is inherently risky and results can vary. Each trader should use their own due diligence before engaging in any trading activity. Our examples are based on real trades, but past performance is not always indicative of future results. Always trade wisely and within your means.
Friday Smart Picks: TI AI Guides on AXTI, NET and OMI’s Movements!
Every trading day brings its own set of challenges and opportunities, and once again, our Trade Ideas AI Holly spotted some slick moves. From rock-solid shorts to a standout long in AXTI, the insights were spot-on. Here’s a quick rundown on how we played the market today and squeezed out those gains. Let’s break it down!
Trade Breakdown 1: OMI
Entry Price: $20.84, Stop Price: $23.87, Day's Low: $19.00
📊 Profit Potential: From the entry to today's low, short sellers could have netted a $1.84/share or 8.8% gain! That's not just numbers; it's your hard-earned cash growing!
👉Start Trading With Holly AI in Your Corner!
Trade Breakdown 2: NET
Entry Price: $75.00, Stop Price: $78.92, Day's Low: $72.68
📊 Profit Potential: A solid $2.32/share gain or, in other words, 3.1% drop for those who acted swiftly on Holly’s signal. Every percent counts in this game!
Long Opportunity: AXTI
Entry Price: $3.47, Stop Price: $3.09, High of Day: $3.68
📊 Profit Potential: An impressive 6.1% rise from entry to exit, highlighting a robust gain on the day.
🌟 Why Holly AI is Your Must-Have Trading Partner
Every trader wishes for a reliable assistant who not only understands market patterns but also anticipates moves before they become obvious to everyone else. That’s what Holly AI brings to your trading desk — a blend of speed, accuracy, and predictive power that transforms opportunities into tangible profits.
👉 Join Us and Start Trading Smarter!
Remember, every trade carries risk, and it’s crucial to stay prepared. Use Holly to enhance your strategy, but always trade wisely. Here’s to making more educated and profitable decisions together!
7 Trades, 6 Wins: Dive into Today’s Top Trade Ideas AI Performers!
Today, we're giving you an exclusive backstage pass to see all of Holly's trades, not just the top performers. Here’s a rapid-fire showcase of how our Trade Ideas AI, Holly, nailed it with 6 out of 7 trades hitting the mark:
Today’s Holly AI Wins
- EBS: +27.16% 🚀 Peak Gain: 47.22%
- PBI: +8.18% 📈 Peak Gain: 10.27%
- ENVX: +5.7% ✨ Peak Gain: 6.24%
- ASPN: +4.59% 🌿 Peak Gain: 6.86%
- ACHC: +2.74% 🏥 Peak Gain**: 3.29%**
- QRVO: 🔽 The one that got away, but it’s not over!
Seeing is believing, and today Holly really showed off! If you want in on this kind of action daily, head here.
Trading is risky, and there are no sure bets, but with Holly AI, you've got top-tier analysis at your fingertips. Don’t miss out on her insights; let her help you spot the next big mover.
✨ Unlock Your Full Potential in Our Premium Circle!
P.S. Trade wisely! Every decision counts and it’s your strategy that complements Holly’s insights. Dive in prepared and never risk more than you can handle. Let's make those smart moves together!
DBRG & ILPT: Today’s AI Power Moves with Holly!
You know how fast the markets can move, but with Holly AI, our virtual trading assistant, you're always a step ahead. Let us dive right into the juicy details of today's two top trades.
🔥 Today's Hot Short: DBRG 🔥
Entry Time: 9:44 AM Entry Price: $15.17 Stop Price: $15.50 Low of Day: $13.79 Profit Potential: 💰 $1.38 per share 💸 (9.1% gain)
Here's the scoop: DBRG was teed up perfectly by Holly right before it took a nosedive. For our Premium members who followed the signal, they saw a drop that translated to a stunning 9.1% gain from our entry point. It's moves like these that show how the Trade Ideas AI isn't just playing the game; she's changing it.
🚀 Today's Top Long: ILPT 🚀
Entry Time: 9:45 AM Entry Price: $3.99 Stop Price: $3.68 High of Day: $4.24 Profit Potential: 💰 $0.25 per share 💸 (6.3% gain)
Next, ILPT showcased Holly's knack for spotting explosive breakouts. Entering at $3.99 with the price peaking at $4.24 offered a sweet 6.3% gain. Holly picked out this gem early in the session, proving yet again how having a sharp AI on your side means you're prepped and ready to capitalize on these spikes.
Why Holly AI?
Wondering how Holly finds these fantastic setups day after day? It's all about the power of machine learning combined with historical market data to sniff out the most profitable opportunities. More trades, more wins, and yes, more fun!
👉 Join Now 🎉
PS: Trading involves risks and it's not always a smooth ride, but with Holly, you've got the best co-pilot. Remember, the market waits for no one and each trade is your decision. Always do your own due diligence.
📈 WGS Up, 📉 POET Down, Profits All Around with Trade Ideas AI!
Let’s zoom through today’s standout Trade Ideas AI trades:
First Up, WGS: Profit Potential 21%💥
This gem popped up on Holly’s radar at $15.05 and soared to a high of $18.24 way before lunch time. That's a whopping 21% climb in less than two hours. If you had grabbed 100 shares, your portfolio could have seen a crisp $319 gain today. Imagine what that could do over a month or a year!
Next, POET: Profit Potential 16%💥
It was all about catching the perfect downward momentum here. Entering at $2.99, just before POET plunged to $2.51 shows a tactical short play, decreasing by 16%. It’s all about timing and Holly’s got it down to an art.
Ready to stop missing out? It’s time to let Holly help you spot and seize these opportunities.
👉 Unlock your trading potential with Holly today!
PS: Remember, while the allure of quick gains is tempting, trading involves risks. Each decision should be weighed carefully, and it’s crucial to never dive in without doing your homework. Holly’s here to add that expert layer of analysis, not replace it.
How We Surfed MULN’s 26% Rise & IBRX’s 14% Boost with Trade Ideas AI!
What a day on the charts, right? Let me cut straight to the chase with a couple of quick wins from today that I thought you'd appreciate.
MULN - Breakout Long - 26% Profit Potential
Time In: 11:05 AM Entry Price: $4.12 High of Day: $5.18 💥 Boom! That’s a 25.73% climb!
Jumped in as MULN was gearing up at $4.12 and rode that wave up to $5.18. The energy was electric, and watching that 25.73% jump was like seeing a perfect wave form right in front of you—total surfer's dream!
IBRX - On Support - 14% Profit Potential
Time In: 11:41 AM Entry Price: $8.33 High of Day: $9.47 🌟 Stellar 13.69% gain!
After a morning gap up and an energetic spike, IBRX pulled back, landing perfectly at the top of the gap. That's where Holly AI grabbed it at $8.33. Like catching the perfect tide, IBRX surged up again, all the way to $9.47. Riding that rebound offered a solid 13.69% gain—it was like hitting the sweet spot on a killer wave!
P.S. Remember, trading’s all about catching the right waves and knowing the ride can be wild. Always wear your risk management life jacket! Don’t forget, every trade is your call. Ride responsibly! 🏄♂️
From Insight to Income: TI AI Drives Profits with RERE & CUBI
Hope you’re all set for a quick rundown of today’s top picks from our AI, Holly! Here’s the scoop on a great long and a sly short that moved the needle today. 🎯
📈 RERE: A Sweet Long Lift!
Entry at $1.79 early this morning, and guess what? We saw it peak at $2.00! That's a nice 11.73% lift from our entry. If you were on this ride, you’d have grabbed a neat profit above the buzz of the morning trades. Holly spotted this breakout before it blasted off—timely, right?
📉 CUBI: Timing the Drop
Got in on CUBI at $46.41 and it dipped down to $45.00—not too shabby for a short play, huh? That’s a cool 3.04% gain for anyone who played the downside. Holly’s alerts aren’t just about riding the highs; we nail the drops too!
🎯 Target Your Trades! Optimize your entries and exits with Holly’s help!
Both trades today showed how we can handle the ups and downs in the market, maximizing gains and trimming losses. Whether you’re here for the highs or the lows, the Trade Ideas AI Holly’s got something for you.
🚀 Ready to Ride with Us? Get in on the Action!
P.S. Remember, the market waits for no one and each trade carries its own risks. Stay sharp, plan your moves, and let’s keep snagging those profits!
TI AI’s Pulse on the Market: Detecting the Short-Sell Advantage!
In today's volatile market, staying ahead means adjusting on the fly – and that's exactly what our Trade Ideas AI, Holly, demonstrates with unmatched precision. With a hefty lean towards short positions (6 shorts vs. 2 longs), Holly showcased her ability to read the room — or in this case, the market! Here's why this matters: Even if you're not taking every trade, Holly's bias alone offers a sneak peek into market sentiment.
Here are the top three short trades from today that you wouldn't have wanted to miss:
1. BRFH - Brewing Storms Pay Off! 🍻
- Entry Time: 10:32:59 AM
- Entry Price: $1.71
- Low of Day: $1.37
- Profit Potential: 19.88% 📉
Caught in a downward spiral, BRFH offered a cool 19.88% potential dip from entry to low. Holly spotted this before the storm fully brewed, proving her savvy in snagging profits from the pullback.
2. CDTX - Diving Deep for Dollars! 💸
- Entry Time: 10:30:20 AM
- Entry Price: $13.53
- Low of Day: $12.13
- Profit Potential: 10.35% 📉
CDTX showed signs of struggle early in the session, and Holly was right there to call it. A 10% drop provided a tidy opportunity for sharp traders to capitalize on its descent.
👉Join Us — Unleash Holly’s Potential Today!
3. DAWN - The Early Bird Gets the Worm! 🌅
- Entry Time: 9:42:12 AM
- Entry Price: $13.80
- Low of Day: $13.18
- Profit Potential: 4.49% 📉
DAWN plummeted, then steadily declined throughout the day and offered a smart snatch for short-sellers. Holly's early alert meant we were all over it!
Holly's Edge: Unemotional, Unbiased, Unbeatable
Today's dominance in short positions is a strategic detection of market moods. Holly adapts, predicts, and conquers, whether the market zigs or zags. She's your eyes on the ever-moving market prices, helping you make informed decisions with zero emotional baggage.
Ready to level up your game? Jump in now!
Note: Trading involves risk and is not suitable for everyone. While we strive to provide accurate and timely information, we remind our traders to approach every trade with caution and informed judgment. Happy trading, and remember, stay keen!
Catching the Downdraft: Trade Ideas AI’s Short-Selling Signals HELE & EDU!
Today’s trading session brought us a couple of fantastic short opportunities that I just have to share with you! Here’s a quick rundown of what went down and how you could have capitalized on these moves with Trade Ideas AI Holly.
HELE - Dropping $9/Share Like a Hot Potato!
🕒 Entry Time: 9:43 AM 💰 Entry Price: $96.58 🛑 Stop Price: $100.00 📉 Low of Day: $87.50
🔥 Potential Profit: $9 per share/9%
EDU - A Sharp $10/Share Slide You Had to See!
🕒 Entry Time: 9:41 AM 💰 Entry Price: $82.21 🛑 Stop Price: $85.00 📉 Low of Day: $72.47
🔥 Potential Profit: $10 per share/12%
Both of these trades showcase the power of our Virtual Trade Assistant, Holly. She’s your trading partner in this wild market jungle, guiding you through the thickest underbrush to find the trades that make others green with envy.
PS: Trading involves risks and it's not for the faint-hearted. As always, remember that each trade carries potential risks and it's important to trade smart. Holly helps in making informed decisions, but the final call is always yours. Happy trading, and let's keep those gains coming!
Timed to Perfection: TI AI Catching IBRX's Support Bounce!
When Low Means Go: The IBRX Tale
Here’s the deal: IBRX was hovering around its low point of the day, almost begging for attention. And guess who was watching? Yep, Holly AI! 👀
She called it - long on IBRX at $4.95 - right before it bounced off its support level. We're talking spot-on timing. It's like she's got a sixth sense for these things!
Why It Matters
Picking the low point isn't just cool; it's crucial. It means we maximized our upside potential, capturing a whopping 16.36% rise to the high of the day.
🌟 Unlock the Sixth Sense for Entries - Try Holly AI
The Lowdown on the Uptrend
The stock spiraled up to a high of $5.76 from our entry. If this doesn’t get you pumped about what strategic entries can do, I don’t know what will!
Keep It Risk-Managed
Remember, even with our laser precision, we always set a stop to keep risks tight - $4.33 was our line in the sand. Because even when we win, we stay humble and prepared.
🛡️ Stay Protected with Holly's Smart Stops
A Nudge Towards Greatness
IBRX was a star today, but it's just one of the many opportunities that our Premium Plan members get a front-row seat to. With tools that help find these perfect moments, who wouldn’t want to join the club?
PS: Trading's a thrill, but it’s not without its bumps. Always trade with the awareness that not every day will be an IBRX day, and never, ever chase a trade without a plan. Dive in with strategy, not just hope!
The Trade Ideas AI Experience with Holly
Let’s dive right into what makes Holly an invaluable asset in your trading toolkit.
🌟 Why Holly?
Think of Holly as your seasoned navigator through the stock market's ups and downs, always on the money, minus the emotional baggage. Every day, Holly analyzes the market using over 60 tailored algorithms, ensuring you're equipped with top-notch entry and exit strategies. All algorithms are updated every night as Holly learns how the market today affected the overall pattern recognition.
From precision-picked trades—anywhere between 5 to 25 a day—to post-market analysis while we sleep, Holly never stops optimizing for your next big win.
Today, Holly AI, so far, scored 5 wins out of 7 trades—superb performance for any trader! With Holly, you're tapping into top-tier trading strategies that deliver results.
🚀 How Does Holly Fit Into Your Trading Day?
- New to Trading? Holly’s like having a pro-trader whispering in your ear, showing you the ropes from what to buy to when to sell.
- Seasoned Trader? Enhance your strategies with insights and risk analysis straight from Holly's playbook.
- Swing Traders, Rejoice! Even though Holly wraps up daily, her picks might just be your next big swing. Check out the Holly Longterm Window for those gems.
🔍 Engage with Holly—Your Style:
- Hands-On: Follow Holly’s trades manually for a tailored trading experience.
- One-Click Trading: Fast-track your trades with a single click directly from the Holly Strategy Trades Window.
- From the Charts: See a setup you like on our charts? Grab it and make it yours.
🛠 Kickstart Your Holly Journey:
Jump right into action with this quick tutorial: Watch How to Trade with Holly
P.S. While Holly provides cutting-edge analysis, the thrill and decisions of trading rest in your hands. Use your insights wisely and trade with care!
77% Peak Gain and Counting – REAL's Remarkable Ride!
Remember when we spotlighted REAL as a top Trade Ideas AI call back on March 1st and it jumped 24% in a day? 🕵️ Check the Chart
If you jumped in with us at $2.32 back then, you'd still be smiling! 😊
Not only did REAL peak at a staggering $4.10, marking a jaw-dropping 77% gain, it's still going strong at $3.25. That’s a solid 39% increase from our entry point—still holding well above, making it a gem for both day traders and swing traders alike. 🕵️ Check the Chart
🌟 Why This Matters: Holly doesn’t just pick the fleeting winners; she spots the real gems that keep on giving. Whether you’re looking to grab quick gains or prefer riding the wave longer, Holly’s got your back.
REAL is a clear example of why keeping an eye on Holly’s picks beyond the initial buzz can really pay off.
🔥 Quick Tip: Always keep an eye on past picks; some of these stocks are the gifts that keep on giving!
👀 Want to see more trades like REAL? You’re just one click away from joining the action with Holly AI. Dive into everything we offer, from Holly AI to sophisticated backtesting features.
Don’t miss out! ➕Join Us!!
PS: Remember, trading involves risks and it’s all about making informed decisions. Our tips are here to guide you, but always review and make the call that fits your trading style.
Just One AI Play wins 34% in a Day: PAPL Drops from $2 to $1.23 after Sell Signal!
At 10:18 AM, today, while most traders were sipping their second cup of coffee, Holly flagged PAPL for a spectacular short. Trade Ideas AI, Holly, trains herself every night and watches the entire market when it is open, that is why ONLY THIS ONE TRADE made it through her analysis today. One trade and one win!
Quick Numbers
🎯 Entry Price: $2.00, 🛑 Stop Price: $2.25, 📉 Spectacular Low of Day: $1.23
Profit Talk
From our entry at $2.00 down to $1.23, that's a sweet 38.5% drop 💰. If you jumped in with us, you’re probably smiling all the way to the bank right now!
📈Check out Today’s Chart Here!
Why Holly Rocks
It’s not just about the numbers. It’s about feeling confident with those precision calls that only Holly seems to nail with uncanny accuracy. 🎯 Today was no exception. Spotting a topping formation early in the game, Holly gave the go-ahead, and bam — profit in the pocket.
👉 Want Holly to Be Your Trading Buddy? Click Here!
Gentle Reminder: As tempting as trading may seem, it’s important to acknowledge the risks. Make sure to conduct your own analysis and stay within your trading limits. Holly AI is here to help guide you, but the ultimate decisions are in your hands. Here's to making informed and safe trading choices!
TI AI Just Nailed an 8% Drop & a 50% Rise – EYPT & NN!
Let us show you once again, exactly why having an AI assistant like Holly can be your ace in the trading game. Whether you're a day trader or swing trader, the Trade Ideas AI will work for you!
📉 Trade 1: The Swift Short - 8% - EYPT
Entry Price: $19.01 | Stop Price: $20.80 | Low of Day: $17.43 Profit Potential: 💸 $1.58 per share/8.3%
This morning at 10:32 AM, Holly spotted a breakdown in EYPT and signaled a short. Those who jumped in at $19.01 saw the price plummet to a low of $17.43 by the afternoon. That’s a nifty 8.3% decline.
👀 See How Holly Caught This Drop!
🚀 Trade 2: The Multi-Day Climber - 50% - NN
Entry Price: $5.72 | Stop Price: $4.98 | Today's Price: $8.58 Profit Potential: 💸$2.86 per share/50%
Back on March 21st, Holly got wind of NN's potential before it blasted off. Buying in at $5.72 and watching it sprint to today’s price of $8.58, this trade has blossomed into a whopping 50% gain in just 20 days. Remember the Trade Ideas AI is trained on ALL TIME FRAMES. When it gets us into trades it has calculated that there is potential for BIG LONG TERM PROFITS. While of course that does not always happen, the numbers are there!
📈 Check the Growth Journey of NN Here!
🔥 Today’s Takeaway
Trading with Holly is about making smart, calculated moves that build your confidence and your portfolio. Whether it’s a quick short or a stunning multi-day rise, Holly’s here to help you navigate the complexities of the market with ease.
👉 Why Wait? Let Holly Guide Your Trades!
Friendly Reminder: While these trades can look tempting, always remember that trading involves risk. It's crucial to do your own analysis and trade within your comfort zone. Our AI Holly is here to assist, but the final call should always be yours. Here’s to trading smart and keeping it cool! 🍀
🔗 Ready to Start Trading with Holly? Join Us Now!
AI Access to Profit Potential!
We're bringing you a quick update powered by our very own Trade Ideas AI Holly. It is pretty amazing having THE ONE AND ONLY AI stock trading system in all of Fintech. Let’s see how Holly continues to spot not just daily winners, but also GIGANTIC multi-day movers!
ALXO 🌅 Sunrise Mover: Profit Potential 5%
- Entry: $15.68
- Stop: $14.60
- High of Day: $16.53 (Profit Potential)
- Gain: 💹 +5.41%
Want to see how we nailed it? 👉 Discover Here
RANI 🚀 Breakout Long: Profit Potential 11%
- Entry: $7.86
- Stop: $7.06
- High of Day: $8.75 (Profit Potential)
- Gain: 💹 +11.32%
Curious about our strategy? 👉 Learn More
WISA 💸 Spectacular Multi-Day Mover: Profit Potential 295%
Did you see WISA? Yes, the same stock that surged 210% yesterday, right after the Trade Ideas AI issued a BUY signal, moved even higher today, to $10.95! That’s a 295% Gain**💸**! This paid for many years of Premium Trade Ideas services. This is our technology at work. WISA wasn’t a one-hit wonder—it’s a testament to how Holly finds stocks that deliver consistently over days, not just hours. 👀 Check the Chart!
🌟 Why Holly AI?
Trading isn’t just about catching today’s gains—it’s about consistency and foresight. Holly analyzes patterns that others miss. Imagine having that kind of insight at your fingertips every trading day!
P.S. Remember, trading involves risks. It’s your money on the line, so always do your homework! While Holly offers exceptional insights, always trade with caution and consider each move thoughtfully. 🛡️
Trade Ideas AI Catches WISA for over 100% in ONE DAY!
Did you see WISA’s 210% Move today? From a mere $2.77 to a jaw-dropping $8.60 high, and guess what? Our Premium traders caught that wave at the perfect moment thanks to the Trade Ideas AI Holly.
You might wonder, "How's that even possible?" Well, it's all in the tech power of Holly AI, your ace for spotting the hottest stocks and biggest gainers in real-time.
Why settle for average when you can trade with a tool that spots opportunities like this? There’s nothing out there coming close to this kind of edge. And we’re just getting started.
Think this is a one-off? Think again. Our ✨ Premium Plan members get these insights daily.
🚀 Join the Premium Plan—More Trades, More Gains!
Please Note: Trading involves risk, including the potential loss of principal. Our insights are not investment advice. Always use your judgment and trade responsibly.
Trade Ideas AI Extended Plays: Shorts That Go the Distance Beyond One Day!
Let me share a couple of stunning recent short calls from Holly. These types of calls make Trade Ideas the #1 choice for astute self-directed investors. Not only did these trades do well on the signal day, but they kept sliding down giving ample opportunity to join the gains extravaganza.
🚀 CBRL - 20% Drop - $15 Profit Potential!
Entry: $75.88 📅 Feb 13 Now: $60.76
Holly swooped in on CBRL, signaling a perfect short as it peaked. If you had followed Holly’s signal and held on, you'd be staring at a $15 drop (nearly 20%) over several weeks, turning a modest move into a solid swing trade that padded wallets nicely.
🌪️ GRPN - 40% Drop - $6 Profit Potential!
Entry: $16.74 📅 Mar 15 Now: $10.15
When Holly tagged GRPN as a sell, who knew it would turn into a monumental $6 or 39% fall? Those who stuck with it have a hefty reason to smile, transforming a simple day trade into a grand slam swing position. Notice the four day window to join the party after the initial call!
👉 Explore Holly's GRPN Breakdown!
Please Note: While Holly and our tools aim to boost your trading game, remember that all trading carries risks. It’s like surfing—sometimes you catch a great wave, and other times, well, it’s a wipeout. Always use your noggin’ before diving in. Our insights provide a lens, not a crystal ball. Trade smart, and always at your own risk. No fortune-telling here, just cutting-edge tech helping you make informed decisions! 🌊
AI Holly’s Quick Gains Alert: Did You Miss This EZGO 33% Move?
Wonder how some traders seem to catch the best waves while others are left watching from the shore? Let me tell you about today's spotlight trade on EZGO – it’s a classic example of spotting opportunity where others see just another ticker.
This morning, our Trade Ideas AI, Holly, flagged EZGO at $2.86. Now, hold onto your hats, because not 10 minutes later, EZGO hit a whopping $3.80! 📈 That's a 33% surge! Imagine turning a quick move into a sizable profit – that's what Holly does daily.
👉 Experience Holly's Next Pick!
PS: Trading is thrilling, but it's not without its risks. While we strive for those exhilarating profit peaks, it’s important to manage expectations and invest wisely. Your capital is at risk, and while Holly aims to enhance your trading strategy, always trade with caution and according to your risk tolerance.
Trade Ideas AI Pays the RENT: 114% on RENT, 17% on HYMC
We’ve got something hot off the press you wouldn’t want to miss. Today, the Trade Ideas AI Holly, our ace in the hole, not only paid the rent but upgraded the apartment!
💰 RENT: Profit Potential 114%
Jumping in at $11.28, the stock peaked at a whopping $24.13. That’s a 114% increase from the entry! And if you're wondering about the cold, hard cash, that’s a gain of $6.33 per share. That’s your portfolio paying the rent in style! 👀Check the Chart
👉 Take your chance on market spins with Holly
💰 HYMC: Profit Potential 17%
Not stopping there, HYMC added its flair to the day’s wins. Entering at $3.90, it touched a high of $4.57. While it might seem modest next to RENT, an 17% increase in just a matter of minutes is nothing to blink at. That’s the kind of quick win that keeps the adrenaline pumping and the profits piling. 👀Check the Chart
👉 Aim for precision with Holly!
What’s the Secret? It’s all about timing and tech. Our Holly AI is on the frontline, crunching numbers, analyzing patterns, and executing trades that are set to pop.
If you’ve been waiting for a sign to join Holly this is it!
👉 Power up now with the Trade Ideas AI!
PS: As thrilling as these wins are, remember, trading involves risks. It's wise to approach every trade with caution, informed decisions, and never invest more than you can afford to lose.
TI AI Short Story: SGH's Fall, A Profit Call!
When the market dips, we don’t just survive; we thrive! And SGH's tumble? That was our playground today.
Holly, the Trade Ideas AI-powered trading engine, flagged SGH as a no-brainer short at $21.42 early today. By tea time? SGH nosedived to $19.21. That's a cool 10.3% profit 💵 for those following Holly’s lead. 👀 Check the Chart
👉 Tune into success with Holly’s guidance!
Bull or bear, Holly’s got us covered, spotting wins we’d likely miss.
Trading isn’t just about the highs. It’s about making the most of the lows too. Holly's here to show you how.
AI's Market Replay: Signals Spark Second Gains!
Feel like the market's got its own rhythm, and you're just a half-step behind? Well, here's the insider scoop—those original entry beats from Trade Ideas AI, they're kind of a big deal.
Holly's AI isn't a one-and-done gig. Those entry signals? They hit once, they can hit again—maybe even for a triple-header.
What we're saying is, keep your playlist updated. Holly’s past signals are like those classic vinyls—you know, the ones that sound better every time they spin. Check out some of these recent hits, the pattern is clear!
🎶 COCH
Holly's entry signal strummed a note that resonated well beyond its initial play. The point? Keep your eyes peeled whenever a stock strums that line again.
Feel the beat of profit potential! ➡️ Find your harmony
🎶 ATNM
Responded to Holly's opening chord with a rise, and a beautiful encore.
Tune in to Holly’s profit tune! ➡️ Amplify your trades
🎶 FIS
Rallied in key with Holly's tune.
Harmonize your portfolio! ➡️ Key into success
🎶 ACMR
Took the cue from Holly's entry and ascended. Look at that second verse!
Catch ACMR's next set! ➡️ Jazz up your strategy
🎶 SWBI
Followed Holly's tempo and stepped up twice thereafter.
🔔 Stay Alert for the Encore Moves!
Trading is about listening to the market's music, and Holly's signals are the notes to watch. You’ve already seen they can climb – now keep an eye on them for a potential repeat performance.
🎼 Ready to Jam with the Market? ➡️ Join the band
PS: Remember, though, this isn't a one-size-fits-all. Not every stock that dips back to an entry signal will rocket again. But with Holly, you've got a seasoned conductor leading the orchestra. So tune in, and let’s make some music.
AI Profit Power Plays: 65% in 35 minutes with ALCC, LIFW, AMRK
Imagine kicking off your day with a steaming cup of coffee in one hand and a winning stock pick in the other. That's exactly how our Trade Ideas AI, Holly, started the morning for our TI premium traders today.
ALCC - Profit Potential 13%
ALCC took off like a rocket at 9:40 AM, with an entry at $14.98. We soared to a high of $17.49, marking a stellar gain of 13%. 🕵️Check the Chart
Discover How Holly Finds These Gems 💫
LIFW - Profit Potential 65%
Then there's LIFW. Hold onto your hats! Our AI spotted the scent of accumulation and told Premium Subscribers to enter at $1.60 at 9:54 AM. After the signal, LIFW sprinted up to a high of $2.64. That’s a whopping 65% leap from the entry point in 35 minutes! 🕵️Check the Chart
AMRK - Profit Potential 6%
AMRK followed suit, not wanting to miss out on the fun. At 10:29 AM, from an entry of $37.23, we cruised to a high of $39.56, bagging a cool 6% increase. That’s a $2.24 gain per share, making it look like child's play. 🕵️Check the Chart
Why settle for average? Let's make every trade count, with gains that are milestones towards your financial freedom.
Trade bold, trade smart, and let’s make those numbers sing! 🎶
Please Note: While these wins are exciting, remember trading has its risks. Think of it as a balancing act—great rewards can come with great risks. Use your knowledge wisely, trade with a plan, and treat our insights as tools, not guarantees. Always approach the market with care and a critical mind.
TI AI Explosive Profits: Holly's March Signal Marvels!
In today's recap, we're spotlighting the firework show that Holly AI, our Virtual Trade Assistant, lit up this March with some truly stunning calls that are still blazing trails TODAY.
As we take a stroll, you'll see why keeping a vigilant eye on Holly's suggestions gives you an insider's edge no matter if you're a day trader or swing trader.
-
CZOO rocketed from $4.67 and is at $14.01 today. That's nearly 💥 200% gain, or $9.34 per share. Check the Chart
-
CRDF shot up from $2.26 and is at $6.24 today, soaring 💥 176%, boosting your wallet by $3.98 per share. Check the Chart
-
CXAI rose from $2.59 and is at $4.9 today, scoring an 💥 89% win, with $2.31 per share in your pocket. Check the Chart
-
MESO jumped from $2.98 and is at $5.57 today, up 💫 87%. That's $2.59 per share. Check the Chart
-
SIGA climbed from $5.57 and is at $9.05 today, gaining 💫 62%, adding $3.48 per share. Check the Chart
-
OUST went from $5.75 and is at $9.35 today, a 💫 62% rise, boosting shares by $3.60. Check the Chart
That's the power of having a one-of-a-kind AI-powered assistant like Holly at your beck and call. The catalysts triggering these BUY or SELL signals don't just pack up and go home after the bell rings. They build, they simmer, and, given time, they can catapult stocks to new heights over days or weeks.
🚀 See What Holly's Cooking Up Next!
Please note: Trading is an adventure filled with highs and lows. While we aim to provide you with the most accurate signals possible, remember that the market's volatility means there are no guarantees. Always trade wisely, knowing that while we strive for wins, losses are also part of the journey. Invest responsibly, and never put in more than you're prepared to lose.
AI Reversal Radar in Action: Holly calls LASE, SPIR & ATXS turns!
In the fast-paced world of trading, where the markets flip faster than a pancake on Sunday morning, you need that eagle-eyed sidekick. That's where Holly AI comes in, not just tracking the upswings but calling the downs before they hit! 🦅
LASE: Laser Photonics Corporation
Holly was cooler than the other side of the pillow when she signaled a short on LASE at $2.05. While it might've seemed bold at 10:58 AM on 3/22, she saw the signs many missed. The result? LASE dipped down to a low of $1.30. 👀 Check the Chart
Curb the Crash! → Let Holly Lead the Way!
SPIR: Spire Global, Inc.
Holly's algorithms were humming just right when she spotted SPIR teetering on the edge. Issuing a short at $13 on 3/21 was like seeing the matrix. As the clock ticked, SPIR wobbled and tumbled down to $11. 👀 Check the Chart
Navigate Market Storms! 🧭 → Set Sail with Holly!
ATXS: Astria Therapeutics, Inc.
And let's not forget ATXS. Holly's AI brain waves signaled a short at $14.75 on 3/25, pinpointing the peak of the mountain before the hike down to $12.62. 👀 Check the Chart
Take a Bow with Profits! 🎩 → Spotlight Your Success with Holly!
In the realm of trading, Holly's sell signals are like finding the exit in a maze, before the walls start moving. The thrill isn't just in the catch, but in letting go at the right moment - and Holly's your ace in the hole for that with a sharp eye for those pivotal market turns.
Ready to gain that market edge with Holly? She's part of our premium toolkit that's loaded with top-notch features designed to elevate your trading experience.
Join the Trading Elite! 🌟 → Go Premium, Go Pro!
Remember, folks, the market is a wild beast -- it can turn on a dime and bite. Trading is an art as much as it is a science, and it comes with its share of risks. Trade smart, trade with Holly's insights, but always trade on your own terms. 🎨📉
AI Power Plays in HYMC and SIGA: Quick Strikes & Long Runs
Talk about turbocharged trading! HYMC flew from $3.13 to $3.49 today, handing us an 11.5% gain. 🏝️ Fast, sleek, profitable - that's the Holly AI effect. Plus don't forget that these trades are OFTEN multi day runners. So this is NOT JUST a ONE and DONE, but an EYES on AI call.
👉 Boost Your Trades with Holly
Now, for the main event: SIGA 🚀. Holly AI gave her followers not one, not two, but three chances to capitalize on SIGA's explosive move. Here's how it unfolded:
-
March 12th: Holly signaled a BUY at $5.57, right before the climb.
-
March 13th: Another BUY signal at $6.31, as SIGA gained momentum.
-
March 18th: A final chance to jump in at $7.81, just before the surge to the peak.
Those who followed Holly from the start witnessed SIGA soar to $10, unlocking an 80% profit potential, or a whopping $4.43 per share!
👉 Ride the Next Wave with Holly
Holly's catering brilliantly to both day traders and swing traders, and keeping an eye on her past trades is the smart thing to do.
Keep winning, keep trading. With Holly, the horizon is just the beginning.
While we're all about chasing the green, remember that trading is a wave you ride at your own risk. There's always the potential for wipeouts, so surf smart, and never ride a wave larger than you can handle. Use Holly's insights as your sturdy surfboard, but always navigate with your own compass. 🌊✨
CXAI's Buy Signal Could've Been Yours with Holly!
Ever seen a stock turn into a rocketship? CXAI just did that in front of our Premium AI subscribers. But hold on because the footprints came EARLIER. On March 13th, Holly AI sniffed out a sleepy stock at $2.59. Fast-forward that day, and that snoozer sparked to $3.33 - up 28% in a day. 👀 Check the Chart
But wait, there's more! Today, Holly signaled BUY at $4.45, and CXAI blasted to $6.67. That's a jaw-dropping gain of 50% today! 👀 Check the Chart
And if that's not enough magic, here's yet another kicker: During these 13 days CXAI never even once dipped below Holly's initial stop loss at $2.04! Giving premium members a chance to bank 157% gain in less than two weeks.
Wouldn't it be a rush to spot the next CXAI before the crowd? With Holly AI, that's not just a dream - it's what Mondays look like. 🌕
Want in on the action? Grab your premium pass 🔑 to the inner circle where Holly AI awaits, along with the other sophisticated trading tools you deserve.
Step into the AI Circle - Your Next Trade Could Be Epic!
Trade smart, trade with Holly. 🤝
Always Remember: The market's a playground, but even the fun rides have rules. Trading's about thrills and skills---so while Holly's your savvy sidekick, your moves are yours alone. Be bold, but be wise. There's treasure out there, but no treasure map replaces your own savvy navigation. Remember your risk protection stops. Don't be afraid to try a trade more than once and most importantly, sail smart! 🏴☠️
AI Target Acquired: WNNR's Big Win & BRZE's Smart Short!
Today, I've got two scorching trades from our Virtual Trade Assistant, Holly, that have set my trading desks on fire! 🔥
WNNR - Long Gain Potential: 40%
Holly signaled a long at 9:47 AM, jumping from an entry at $13.20 up to $18.50. If you followed this trade, you'd have seen a 40% gain. Holly identified this breakout early, giving our premium members a significant advantage. 👉 Want in on the next WNNR?
BRZE - Short Gain Potential: $2.50/share
BRZE was another success, with Holly initiating a short at $47.27 at 9:48 AM, and it fell to $44.75. This move allowed us to earn $2.50 per share, a solid 5.3% profit. 👉 Ready to short like a pro?
Why grind through data daily when Holly can bring the best trades directly to you? Get premium, and let's make trading your success story. 👉 Jump on board!
Beyond the Close
Holly's knack for spotting winners doesn't stop at the daily close.
Remember yesterday's hot pick, OUST? It leaped from $5.75, and today, it reached new heights at $8.24! That's a 43% gain. 👀 Check the Chart
And let's not forget about MESO, our pick from March 26th, which rose from $2.98 to a peak of $5.37 today, achieving an 80% gain. 👀 Check the Chart
Holly's unique AI insight goes beyond just the day's trades; it identifies opportunities that develop over several days, making Holly's picks valuable additions to your watchlist.
The journey to your next big win starts with a click. 👉 Dive Into the Future!
Remember, every trade carries its own set of risks. It's the wild ride of the market! While we aim to identify great opportunities, successful trading requires caution, strategy, and your own judgment. Let's navigate the market together, with Holly guiding us to potential wins, but always stay vigilant.
Holly Heats up the Market with OUST & STKS Signals!
In today's financial rodeo, our Virtual Trading Assistant Holly spotted not one, but TWO trades that are hotter than a jalapeño in the Sahara. 🌶️
OUST - 25% Profit Potential
🔍 The Scoop: OUST made a majestic leap today! Entering at $5.75 with a safety net at $5.26, it soared to a high of $7.20. That's a potential gain of $1.45 per share or a 25.2% increase!
👉 Don't miss out on Holly's next find. Join the action now!
STKS - 8% Profit Potential
🔍 The Scoop: STKS, a smaller but mighty contender, made its move from $4.70 with a stop loss guarding at $4.50 and climbed to a high of $5.06. That's a tidy gain of $0.36 per share or a 7.66% uptick. A classic example of strength in the small cap arena!
👉 STKS is just a glimpse of what Holly can do. Catch the next rising star with Holly!
Ready to Ride with Holly?
Whether you're just dipping your toes or ready to catch the big waves, Holly's here to show you the ropes. Remember, every pro was once a beginner, and with Holly, you're never riding solo.
👉 Dive in today and discover the power of AI-driven trades.
There's always more to the market than meets the eye!
A word of caution: While today's trades have us grinning, remember, the market's waves can turn. Always trade wisely, keep emotions at bay, and remember, every trade carries risk.Trading is risky, and your capital is at risk. Always do your due diligence, and remember, Holly's insights are tools, not guarantees. Trade smart!
AI Profit Parade: Did MESO & NUVB March Without You?
Without our trusty sidekick Holly AI by your side, you might've missed out on an adrenaline-pumping journey today. Here's the lowdown...
MESO: +35% Profit Potential
Holly eyed MESO at $2.98, setting a stop at $2.68. The outcome? MESO raced to $4.02, marking a potential 35% profit. That buzz you're feeling? Pure opportunity!⚡
💡 Ensure you never miss out again!
NUVB: +14% Profit Potential
With confidence, our Virtual Trade Assistant signaled a buy at $2.60 with a stop at $2.38. NUVB rose to $2.97, offering a 14% gain chance.
💡 Be in the circle where the magic happens!
Today's wins with MESO and NUVB? Thrilling, yes, but they also pack a lesson. The market is always brimming with opportunity, and each day brings its own set of potential wins and lessons. Today's triumphs? Just the beginning. In trading, there's always a 'next time' and a new opportunity just around the corner. So chin up, prep up, and let's catch the next big wave together!
💡 Make the most out of every trading day. Our premium annual plan is your best bang for the buck.
Pssst, a little whisper for the wise: Trading's a beast of its own - unpredictable, wild, and full of surprises. Every click, buy, or sell? That's on you, captain. Navigate wisely, chart your course cautiously, and remember, Holly's here to guide, not decide. Trade smart, trade safe. ⚖️
Today's 37% Profit Potential: Grab Your Slice of the AI Pie
Cutting right to the chase - today was a goldmine if you knew where to look. We've pinpointed three Holly AI moves that stood out, stripped of the fluff, here's the raw deal:
IDN - The Mighty Mini: 💸 +17 Profit Potential
Took it at $3.64 and it didn't disappoint, peaking at $4.25. This little giant delivered a solid 16.8% profit potential. It's the small stocks that often pack the biggest punch.
📢 Ride the next mighty mini to profit with Trade Ideas AI!
LTRN - The Swift Short: 💸 + 10% Profit Potential
Jumped in short at $10.78 only to watch it plummet to a sweet low of $9.64. That's a clean 10.6% gain in our pocket.
📢 Ensure your portfolio is packed with swift shorts tomorrow!
GRWG - The Breakout Beauty: 💸 +10% Profit Potential
Grabbed it at $2.46, climbed to $2.72. Simple, yet effective, banking us a 10.6% increase.
📢 Watch your investments grow with Holly picks like GRWG.
In this game it's about making the smart moves before they become too obvious. Missed out today? Tomorrow's another day, and the Trade Ideas AI has many tricks up her sleeve.
Please note: Before you dive into those juicy Holly AI trade signals and chase those gains, remember, we're all about sharing insights, not financial advice. The stock market's a wild ride, full of ups and downs. While we strive to spot those golden opportunities, there's no magic crystal ball. Past performance? That's just history, not a future guarantee. Investing's risky, and it's all on you to make sure a trade fits your game plan and risk appetite. Don't bet the farm on a single move, and always have an exit strategy. In the end, it's your call, your money, and your responsibility. Let's keep our eyes peeled, use those stop-losses wisely, and trade smart.
Round Two Ready? Exclusive AI Comeback Calls for Swing Wins!
You probably know those "Wish I'd jumped on that!" moments far too well... Time to turn that around. Those missed shots? They're about to become your wins with our AI SuperPower Second Shot Playbook.
Imagine our Trade Ideas AI Holly spots a killer buy opportunity for our Premium Subscribers✨ , after a massive move, the dust settles, skepticism rises, and just as those stocks tiptoe back to their debut prices, boom - we're in prime position for Act II. It's like catching lightning in a bottle, twice.
⚡ Don't let lightning strike twice without you. See It in Action
Zoom in on RDNT and DWAC. These weren't one-and-done deals. After their initial run, they circled back to the signal price, setting the stage for an encore.
And when DWAC did its thing for the third time right after hitting the signal line? That was something to see.
So, here's a pro tip: Always keep a sharp eye on the AI Signals in the Money Window. When Holly's picks reset to their launch prices, you're front and center for the next big play.
🌟 Exclusive Sneak Peek: On the Radar for a Second Round
Today, we're lifting the veil just for you, offering a sneak peek usually kept under wraps for our Premium subscribers ✨.
👀BTAI, 👀EBS, 👀IOVA - Gearing up for another go? These contenders are currently pacing near their starting blocks, possibly primed for another run. It's time to give those charts a second look and fine-tune those price alerts.
⚡ Join the winners' circle with picks that pack a punch. Discover More
And while not all plays are created equal, we've got a knack for picking the ones with the juice worth the squeeze.
The stage is set, the lights are on, and your AI Superpower is waiting. Are You Encore Ready?
P.S. Who said you only get one shot? Let's prove them wrong.
Remember, all trading involves risks. Don't dive in without considering your experience and how much you're ready to risk. Investing more than you can afford to lose isn't a winning strategy. Trust your gut --- this isn't about giving financial advice.
Trade Ideas AI Magic: SPIR, XFOR & LASE's Profit Potions!
Holly's razor-sharp intuition has detected some glittering trading opportunities again! See for yourself why the Trade Ideas AI is more than just hype.
Spire Global - SPIR: Profit Potential 14%
From an entry at $13 to a low of $11.15, that's a plunge ripe with potential, making an impressive 14% splash. Check the Chart 👀
👉 Start with Holly today and make every trade count!
X4 Pharmaceuticals - XFOR: Profit Potential 13%
Took a daring leap from $1.16 to a high of $1.31. Despite the market's twists, it showcased a potential gain of 12.93%. Check the Chart 👀
👉 See What You're Missing - Join Holly!
Laser Photonics Corporation - LASE: Profit Potential 11 %
A bold move from $1.87 to peak at $2.08, flashing a solid 11% gain opportunity. Check the Chart 👀
These are beacons of what's possible when you've got Holly in your corner.
👉 Unlock Your Trading Superpowers
💡Always Remember: Trading's thrilling but comes with risks. Your moves, your future. Trade smart. This is not investment advice.
Holly's Hot Picks: 17% Short Win & 5% Long Gain!
Quick moment of your day? Holly, our A.I trading guru, has dug up a couple of standout trades I'd love to share with you:
STRC's Downward Dash - Percentage Gain Potential: 17%
★ Dived in at: $2.26.
★ Hit a low at: $1.87, locking in a sweet 17.26% gain for those who went short.
★ Check the Chart 👀
PWFL's Upward Surge - Percentage Gain Potential: 5%
★ Jumped in at: $4.39.
★ Rose to: $4.61, notching a nice 5% gain for those riding the wave up
★ Check the Chart 👀
👉 Ready to catch the next surge? Dive in with Holly!
Imagine having a sidekick who's all brains and no sleep, crunching numbers and patterns while you dream of your next big win. Holly's that buddy, scouting the market landscape to spot opportunities even before the morning coffee kicks in. ☕
👉 Looking for market action? Get Started with Holly!
Whether it's a short dive or a long climb, your Virtual Trade Assistant is there to highlight where the potential lies, making sure you're always in the loop. With AI-powered insight, trading feels less like a shot in the dark and more like a strategic game where you've got the upper hand.
👉 Want in on the action? Kickstart your Holly Journey!
Please Note: This is not investment advice. Trading involves risk and is not suitable for all investors.
The Market's No Cakewalk, But This Opportunity Is Real Sweet!
The stock market isn't a cakewalk, and we're all too familiar with that truth. But while the crowd fixates on the usual suspects like NVDA, TSLA, AMZN, MSFT, and META, we're digging up the gold they're walking right past. 🪓💰
Case in point: Our spotlight on ALPN from 1/24/2024. A 77% gain in just two months!
Heard of ALPN before, let alone peg it for a meteoric rise? Probably not. This isn't your garden-variety move; it's the kind that makes those industry titans look like they're standing still. And no, it's not one of those obscure, risky penny stocks. We're talking about a heavyweight with a 2 billion market cap in a sector that's SUPER HOT.
After Holly's Trade Signal at $22.88, ALPN's price was history - never to dip to that level again. That's the thrill of venturing where others don't dare. The right tool doesn't just add to your arsenal; it transforms your game.
So, what's it gonna be? Stick with the crowd or catch the next big wave with us?
The ball's in your court. Make it count!
Why Settle for Average When You Can Swing for the Fences with Holly AI?
Diving headfirst into the market maze without a map? Nah, that's not how we roll. With our trusty guide, Holly, the AI genius, we're treasure hunting. 🧭💎
But here's a twist not everyone sees coming: Holly's skills aren't confined to the fast-paced world of day trading. Oh no, she's also a maestro of the swing trade arena. Let me dish out some seriously juicy AI calls that blossomed into fantastic swing trades.
ALPN, the High-Flyer! 🛫
-
Entry Price: $22.88
-
Today's Price: $41.98
-
Profit: A whopping $19.10 per share! That's a sensational 83.42% increase! And it only took us 52 days to get there. Talk about hitting the jackpot!
VERA, the Stealth Climber! 🌱
-
Entry Price: $22.95
-
Today's Price: $43.03
-
Profit: Gained $27.83 per share, soaring 121% to $50.78, and today still sitting at an 87.49% uptick at day 53. Stealthy but mighty!
BOOT, the Dark Horse! 🐎
-
Entry Price: $78.11
-
Today's Price: $85.51
-
Profit: Earned $15.78 per share, with a hefty 20% leap to $93.89, and now, 46 days later, still up by 9.47%.
EWTX, the Underdog! 🚀
-
Entry Price: $12.07
-
Today's Price: $16.29
-
Profit: Bagged $8.62 per share, with a hefty 71% leap to $20.69, and now, 59 days later, still sitting at 34.96%. From zero to hero!
In trader speak, this is what we call "crushing it"! 🎤💥
Now, imagine waking up to trades like these. Not just good for a quick flip but for those sweet, sweet swing trades that add zeros to your account while you sleep. That's the magic of having Holly on your team.
So, next time you hear the bell, remember: Holly's got your back, spotting those hidden gems that turn "what ifs" into "what's next!"
Keep trading smart, not hard. Holly and I will be here, bringing you the next set of winners. 💸🌧️
The Fine Print (Because Even Treasure Maps Have Terms): 🧭 Before you set sail with Holly AI, your trusty compass in the treasure hunt for golden trades, let's talk brass tacks. The voyages we share are based on sophisticated AI analytics, but remember, every treasure hunt has its risks. The markets are as fickle as the wind, and even with Holly's keen eye, the treasure chest isn't guaranteed.
Our tales of high-flying stocks and stealthy climbs are genuine adventures we've embarked upon, but they're not infallible predictions of future bounty. Your trading journey is your own, and while we're here to guide and inspire, your decisions at sea are yours alone. Remember, the size of your sail (aka your investment) should never outweigh your ship's capacity (aka your risk tolerance).
Investing in the stock market involves risks, including the loss of principal. The adventures we recount are not a promise of fortune to come but rather a map to navigate potential opportunities. As with all treasure maps, interpretation, weather conditions (market conditions), and the readiness of your crew (your financial situation) all play a part in the journey.
So, here's to charting your course with wisdom, courage, and a bit of AI magic. May your trades be prosperous, and your seas be kind. But remember, the true treasure is in the journey, not just the destination.
GOEV & LTRN Profit Potential: Elevate or Hesitate?
Fact is, the journey through the markets is one filled with highs, lows, and those thrilling moments in between where everything just clicks. It's in those moments that legends are born, skills are HONED, and portfolios are transformed. Today, I want to share with you a real, tangible pathway to making those pulse-racing market moments more frequent and fruitful.
That pathway? It is a totally HUMAN approach to working with our one of a kind Trade Ideas AI. Check what Holly unlocked for our Premium members today:
🔥 GOEV's Glorious Breakout - 48% Profit Potential
Imagine launching into the market at 9:41 AM with GOEV at a modest $2.62, only to see it soar to a stratospheric high of $3.88. That's a jaw-dropping 48% climb in 15 minutes! 👀Check the Chart
But of course if you missed the initial spike there was a pullback in price. Many of our subscribers like to trade AI calls that way. They wait to see how the trade unfolds before jumping in. GOEV ended up pulling back to 15 cents above the initial entry and is now making an attempt at a second SUMMIT. While our Trade Ideas AI is a machine, you don't have to be a robot to trade with it.
👉 Unlock Your Trading Superpowers
🌅 LTRN's Sunrise Mover Magic - 6% Profit Potential
LTRN entered the arena at 10:08 AM, priced at $9.75. Like a champion, it raced to a high of $10.37, bagging a cool 6.36% increase. 👀Check the Chart
Let's make those trading dreams a reality!
How Trade Ideas AI Turned Groupon's Slide into Your Gain!
Hope you're strapped in because the Groupon Short we caught today was a wild ride, and it's not over yet!
The Trade Ideas AI flagged GRPN at precisely 9:42 AM EST for a short, whispering "this is the one" with an entry at $16.74. True to form, GRPN plummeted, hitting a low of $12.31 before you could even finish your lunch! That's a whopping 26% drop, giving our premium subscribers the opportunity to pocket a potential profit of over $4.40 per share. 👀Check the Chart
✨ Get exclusive access to our real-time alerts!
But hold onto your hats -- the day's still got hours to tick, and who knows what other morsels of profit Groupon might serve up?
✨ Unlock the potential of Trade Ideas AI now!
With Holly's non-emotional, back-tested, algorithmic insights, you're trading with tomorrow's tech today.
✨ Subscribe to our premium service now!
Remember, market conditions can change as fast as Groupon's price today. Always use stops, and never trade with money you can't afford to lose. Stay sharp! 🦅
Capitalize on Downtrends with Trade Ideas AI!
While we might get jittery, Holly's as cool as a cucumber. Unlike us mere mortals, Holly's not swayed by emotions or biases. Her mission? To spot the juiciest trading opportunities for you, whether they're soaring high or diving deep.
📉 Today's Spotlight: Stellar Short Trades!
SentinelOne Inc - S: +8% Profit Potential
Dived from an entry at $24.77 down to $22.80! >>> +8% Gain 👀Check the Chart
Limbach Holdings - LMB: +9% Profit Potential
Plunged from $43.47 to a cool $39.56! >>> +9% Gain 👀Check the Chart
👉 Jump on Board with Holly Now!
Why Holly A.I.?
Because she's a statistician at heart, finely tuned to spot the best trading opportunities for YOU. Whether it's going long or short, Holly brings her A-game every single day, ensuring you're equipped with top-notch trade signals. 📊
👉 Dive into Precision Trading with Holly
Important Reminder: All trading involves risk. It's possible to lose more than your initial investment. This message isn't investment advice; it's for educational purposes only. Always trade wisely and consider your risk tolerance.
From Sidelines to Profit Lines: AI Trades That Paid Off!
Quick update: Holly's AI smarts brought a win-win to the trading table today. Check these out:
CXAI - Quick 28% Rise
Saw CXAI at $2.59 early on? It soared to $3.33 by the end of day. Easy pickings? You bet. 👀Check the Chart
CLPT - Smooth 7% Gain
Holly eyed CLPT at $6.90; it didn't disappoint, hitting $7.38. Feeling good? We are. 👀Check the Chart
👉 Ready for the next sunrise mover? Holly's got you covered
Swing Trades? Nailed 'Em!
CRDF👀 & ASPN👀 were home runs with 158% and 37% gains respectively. Holly's not just a day-trader's dream - she's a swing trader's best friend. Her foresight is perfect for those playing the long game.
👉 Ready to swing for the fences? Tap into Holly's strategic foresight
These trades are real opportunities our AI Holly is spotting by cutting through the market's noise to hand over opportunities on a silver platter, making the complex world of stocks a bit more friendly, especially for the newcomers and the retail crowd.
Want in? Holly's ready to share her next move.
👉 Join the charge. Make those trades count
See How Trade Ideas AI Boosted Profits Today!
Ever feel like the stock market's a game rigged in favor of the big hedge funds and mysterious algos? 🤖💼 Well, guess what? Today, our Trade Ideas AI showed once again that it's possible to play and win on the same field!
🔥 Today's Hot Trades
ASRT - The Breakout Champion
✯ Entry: $1.06
✯ High of the Day: $1.21
✯ Profit Potential: +14% 💫
👉 Snatch your next breakout trade with AI
NAMS - The Nickelback Ninja
✯ Entry: $21.49
✯ High of the Day: $24.00
✯ Profit Potential: +11% 💫
👉 Discover ninja-like trades before anyone else
Why Trade Ideas AI?
In a world where the big players use every tool to their advantage, the Trade Ideas AI is your leveling field.
✯ Capture Gains 🎯 - Whether it's a breakout or a subtle shift, you're in on the action early.
✯ Fight the Giants 💪 - Your trades backed by AI can stand tall against hedge fund strategies.
✯ Lightbulb Moments💡 - Even on your busiest days, get clear signals that say, "It's time!"
👉 Take the leap. Trade smarter with Holly AI
Isn't it time to stop watching from the sidelines? 🤔 Join us! Let's turn those what-ifs into bankable profits.
Please note: While we strive to provide the best possible trade signals using Trade Ideas AI, it's important to remember that not all trades will be winners. The stock market is inherently unpredictable, and various factors can influence the outcome of any given trade. We recommend using these signals as part of a balanced and well-researched trading strategy. Always consider your risk tolerance and investment goals before making any trades. Past performance is not indicative of future results. Trade at your own risk.
VKTX's Wild Ride: TI AI Holly Predicted Every Twist & Turn!
Double Victory with VKTX! 🤑 Holly, the Trade Ideas AI, crushed it with VKTX -- not once, but twice! She called a flawless BUY at $28.26 and then, at the pinnacle, switched to a SHORT at $93.03. Talk about quant data crunching precision!
Surge to Profit📈 If you had jumped on Holly's VKTX BUY signal on February 8th like many of our Premium Subscribers, you'd have surfed from $28.26 to a $99.41 peak on February 28th. That's a $71.15 per share gain -- a colossal 251% increase! This is the TI Difference! 👀 Check the Chart
💥 Don't just dream -- get Holly's signals and make them real!
And Then... Plunge for More Gains 📉 When VKTX hit the top, Holly didn't miss a beat. Crunching numbers our AI thought too much too fast and signaled a reversal to the SHORT SIDE -- sharp, clear, and just in time. From $93.03 to today's $63.25, she nailed a potential $29.78 per share profit, another 32% for the savvy Trade Ideas Premium Subscriber. 👀 Check the Chart
💥 Act now -- Your next profit signal is waiting!
AI Trading Made Simple👋 New around here? Holly is like having a 1000 pairs of eyes on the stock, crunching data to unlock the hidden opportunities. No jargon, no fluff -- just solid, actionable calls.
💥 Get in on the action -- start trading with Holly's insights today!
Reality Check: Not every trade is a winner. Remember, trading is about playing the odds 🎲, not guarantees. All trades carry risk, and you should only trade with money you can afford to lose. Holly's signals are about statistical edge, not financial advice. Trade at your own risk, and always be prepared for the ups and downs.
Feel that FOMO tickle? 🤔 Take action with Holly -- your next big wave is coming.
Chart-Toppers: Trade Ideas AI Nails It with MNMD & BYRN!
Just a quick shout to share the exhilarating ride Holly took us on today.
MNMD catapulted from $8.83 to a high of $11.10. That's a 25% orbit jump 💸 and $2.27 per share increase!
BYRN? A smooth liftoff from $12.53 to $14.27, notching a solid 13% gain 💸 and $1.74 per share increase!
👉 Lock in Your Next Trade with Holly's picks!
If you had followed Holly's signals, you could've seen some serious green today. Holly's stop loss suggestions kept us safe, too -- like a financial seatbelt.
👉 Stay Safe and Profit with Holly's stop loss guidance!
Sneak a peek at these screenshots; the numbers are dancing right off the charts! 📊
👉 Gear Up for Tomorrow -- Holly insights waiting for you!
The magic? It's all in the AI from Trade Ideas. We've got the insights, the moves, and the community - all tuned into the same success frequency.
👉 Join the Trade Ideas AI Community and sync with success!
Please note that not all trades are winners, and trading involves significant risk. It's possible to lose money, and past performance is not indicative of future results. This message is not intended as investment advice. Trade at your own risk.
Perfect Picks from the TI AI! Check out Holly’s Harmony!
Ever watched a great band's encore performance and found it even more electrifying than the main act?
When you see Holly's AI signals dip back to the original entry price in the Signals in the Money Window, that's your front-row ticket to more potential profits. Keep a sharp eye on this list; it's where Holly's encore trades take the stage for a second profit performance!
Today, QBTS and LYFT are headlining this show.
QBTS
Originally signaled by Holly at $1.32, jammed its way up to a high note of $2.17. But every rockstar needs a breather. It dipped back to that $1.32 entry stage... only to leap up to $2.02 on its second wind! 👀 Check the Chart
🌟 Action Time: Don't just watch the comeback -- be a part of it!
LYFT
Cruised from our spotlight entry of $16.24, hit a high of $19.43, took a breather, and vroom -- it's back on the track heading for $19.12 and counting. 👀 Check the Chart
Now, pay attention because here's where you tune in for the profits: The Signals in the Money Window is a chart-topping list that shows you the Holly hits ranked by long-term profit percentage, dropping the mic from highest returns down to zero. But here's the twist -- it's those hits touching base again near their original entry price that are ready for their encore.
Stocks returning to their starting line are potentially signaling an "I'm not done yet" vibe, and might be ready for another rally.
🌟 Ready for liftoff? Those comebacks could mean big bucks! Join Holly!
So, keep your eyes on those Holly signals, especially the ones that swing back to start. They're not just reruns; they're your next potential profit hit.
Stay sharp, stay keen, and let's rock these comebacks for all they're worth!
The RVSN Rocket brought to you by Trade Ideas AI: Let's Chat Strategy!
Here's a quick and potent shot of trading espresso for you!
RVSN just soared from our Trade Ideas AI alert at $2.98 to a stratospheric high of $4.79, that's over 60% gain in a matter of minutes -- talk about explosive growth potential, right? 👀 Check the Chart.
But here's the twist: let's say you were late to the party. By the way, that happens to everyone. The stock's already sky-high, and you're wondering, "Have I missed it?"
Not on our watch!
Here's your next move: Don't chase, instead, wait for the pullback, lock in your buy with a stop, and aim for the stars. That's trading with brains and not just brawn. It's not about hopping on the rocket every single time; we all know that's NOT POSSIBLE, but with Trade Ideas you certainly can ride the next wave after the initial launch.
I've wrapped this all up in a 🎥 video🎥 for you. It's the next best thing to having me over for a coffee and charts session. So, clickety-click that link and let me guide you through the trade labyrinth like a pro.
Remember, that surfing the stock market waves of momentum isn't just about one killer trade; it's about a style. At Trade Ideas we arm you with the tactics to tackle any trade, any day, armed with Holly's wisdom and a dash of your own trading moxie. So let's not dwell on missed opportunities; instead, let's gear up, game plan in hand, for the next round.
And if you're new to this wild ride, take a spin with simulated trades. It's all the thrill, none of the spill, using Trade Ideas' state-of-the-art tech. Practice makes profits!
Start today and make every trade count!
OCEA Just Hit a New High! + CRDF & REAL Making Waves!
Buckle up because this ride just keeps ripping! Just when you thought the tide couldn't get any higher, OCEA, CRDF, and REAL have set new benchmark records in the Trade Ideas AI trading odyssey.
OCEA: The Big Kahuna Keeps Riding! 👀Check the Chart
Yesterday's 94% gain? Just the appetizer! From our original entry point at $2.45 on 3/4 to today's high of $7.79, we're talking about a profit potential of a whopping 218%! 🐬 Holly's not just working overtime; she's working double-time! Our Premium Subscribers are getting their yearly subscriptions paid for IN ONE DAY!
🏄♂️ Surf this gain! Catch the next one!
CRDF & REAL: The Tide is High with the Trade Ideas AI!
-
CRDF - 54% gain 🐬 Rocketed from $2.26 on 3/1 to a high of $3.85 👀Check the Chart
-
REAL - 52% profit 🐬 Leaped from $2.32 on 3/1 to $3.83 👀Check the Chart
🏄♂️ Catch this swell - join the ride!
Why am I sharing this? Because the Trade Ideas AI isn't just about the one-off wins. It's about the constant, edge-honing accuracy that turns trading from guesswork into precision.
Missed OCEA? Don't sweat it. The ocean's vast, and Holly's scouting the horizon for the next big wave. Don't be the one watching from the beach; grab your board, and let's dive into the opportunities together.
🏄♂️ Dive in and let's make waves together
As always, remember trading's like the ocean - is inherently unpredictable but thrilling. Holly's here to spot the waves, but riding them? That's on you. Trade smart, and ride these waves with the Trade Ideas AI . 🏄♂️
TI AI caught the surge in OCEA! Check out this Swell!
Holly, the Trade Ideas AI saw a statistical swell in OCEA, Ocean Biomedical Inc. approximately 13 minutes after the open. She alerted our Premium Subscribers that $2.45 was a Buy Signal price.
That swell turned into an ROI Tidal Wave as OCEA ran up to a dizzying high of $4.76 in a matter of hours, netting a cool 94% gain, all in just ONE DAY. Holly's day work! 🚀
The Entry in OCEA at 9:43 AM, was also anchored by a smart stop at $2.08 for risk control which is a critical part of stock market momentum surfing 👀 Catch the Wave on the Chart
Why am I hyped? Because it's not about one win; it's about the edge the Trade Ideas AI gives us daily. Today, OCEA. Tomorrow? The Next Big Point Break!
So, here's my nudge to you - isn't it time you joined the ranks of traders who not only dream of the big waves but actually ride them?
Don't let the next wave pass you by. Dive in, the water's fine, and the waves? They're just getting started.
Please Note: Trading involves significant risk and is not suitable for all investors. While the potential for profit is substantial, so is the potential for loss. Not all trades will result in winners. It's important to use your discretion and trade responsibly. Trade Ideas provides tools and information that can help guide your decisions, but it's up to you to manage your trades and the risks associated with them.
Getting High Returns with Trade Ideas AI
We have all sat at our desk, staring at our screen, wondering which stock is the one that is going to GO! That guessing game should be over! You my friend have access to a Secret Weapon that not only gives you the Get-IN calls but also tells you when to GET OUT if things don't go as planned.
🔑 Let's Stop Guessing and Start Trading
Welcome to a day in the life with Holly, the Trade Ideas AI that's changing the stock investing game for retail traders, especially helping the new active investor to this high-speed world of amazing possibilities in the stock market.
The Trade Ideas AI, Holly, doesn't just throw darts in the digital dark; she's a high-level quantitative card counter in the casino of the stock market.
🔑 Count Me In! I'm Gaining My Edge with Holly
Take a peek at some recent wins:
★ CLDX - 🌱 37% Leap 👀 Check the Chart!
★ EWTX - 🌱 71% Gain 👀 Check the Chart!
★ LXRX - 🌱 100% Climb 👀 Check the Chart!
🔑 Discover Winning Trades Today!
These aren't isolated incidents. They're part of a pattern that Holly has been nailing down, trade after trade. And while not every call is a home run, Holly's guidance on when to enter and where to place a stop loss, keeps your capital safe for the next big opportunity.
📺 Don't Miss Out: Watch My Video Walkthrough!
Curious to see Holly's magic in action? Click here to watch a video walkthrough of Holly's 22 top trades over the last 60 days and the incredible moves they've made.
This isn't about Holly being a fortune teller; it's about reading the market tape in a way that's usually out of reach for most of us. Holly's statistical engine cuts through the chaos, offering you a clearer path to potentially profitable trades.
Please note: The stock market isn't easy - if it were, everyone would be doing it. We're on an exciting journey with Holly, but it's important to remember that trading involves risks. Not all trades will be winners, and it's possible to lose money. Holly's suggestions are based on statistical analysis, not guarantees of future performance. Each trader's risk tolerance and strategy are unique. We encourage you to set stop losses according to your comfort level and not to invest money you cannot afford to lose. Your decisions should be made with a blend of human judgment and technological assistance. This is not investment advice but a tool to help you make more informed decisions.
Trade Ideas AI Holly Hits the Mark Again!
While you've been navigating market challenges, Holly has been crunching numbers, fine-tuning strategies, and handpicking the day's top trades. Let me break them down for you -- quick and easy, because I know your time is as precious as those trades!
CRDF 👀 Check the Chart\
★ Entry at $2.26 and soared to a high of $3.07.
★ That's a whopping 36% increase, translating to a juicy $0.81 gain per share\
🎯 Unlock Your Next Big Win with Holly!
REAL 👀 Check the Chart\
★ Jumped in at $2.32, hitting a high of $2.88.
★ A solid 24% jump, or $0.56 more in your pocket for each share.
★ 100 shares? That's a cool $56 gain just waiting to be claimed.\
🎯 See What You're Missing - Join Holly!
RDNT 👀 Check the Chart\
★ Starting at $43.09, peaking at $45.18.
★ Gain of 4.8% might seem smaller, but with a $2 increase per share, the numbers quickly add up.
★ On 100 shares, that's an additional $200 to your trading account.\
🎯 Outsmart the Market with Holly - Learn How!
Missed out on today's action? No worries. Holly's already gearing up for Monday, and you won't want to miss what's coming next.
🎯 Don't Miss Another Opportunity - Sign Up Now!
Important Note: While Holly delivers impressive insights, remember that not all trades will be winners. The information provided here is not investment advice but a tool to enhance your trading decisions. Your trades are your responsibility; it's your money at stake. Combining human insight with Holly's analytical power creates a formidable team, yet remember, trading involves risk. Always exercise discretion and consider your financial situation before making any trade. Together, human and machine offer the best chance for success in the dynamic world of trading.
Did You Miss Out on 265% Gain?
The Not-So-Secret Secret is Out!
The Trade Ideas AI is doing something INVESTORS have NEVER SEEN BEFORE. Just take a look at the Holly ADIL Buy Signal🎯 at $1.14 during the SO Time tournament, because it says it all. Trade Ideas AI is blazing a trail in Fintech! 👀Check the Chart
The Scoop: News broke that ADIL patented a breakthrough drug to battle addiction.
But here's the kicker -- this news surfaced AFTER our AI detected an unusual surge in volume and trading patterns, prompting the AI to issue a Buy Signal for ADIL at $1.14 on 2/28/2024.
Fast forward to today, and ADIL's price soared to $4.17, marking an impressive gain of over 265% -- and it is STILL GOING STRONG.
👉 Don't miss out on the next ADIL - Subscribe now!
While others are selling you SHOVELS to DIG for gold in the stock market, Trade Ideas AI is the goldmine you are looking for - delivering nuggets day after day.
👉 Dig less, profit more - Get started now!
Tired of missing out? Want to join the ranks of traders who get it right? Click here. It's your entry ticket to a movement that's changing the game for individual investors.
👉 Grab your edge now and don't miss another opportunity!
AI Smarts and Wins that make you go WOW!
Wrap-Up Time! 🏁 During our exhilarating SO-Time Tournament, the TI AI, Holly, once again showcased why we're the frontrunners in the subscription service fintech race.
We're all about hardcore AI smarts 🧠 and trading wins that make you go "Wow!" 🎉
Let's dive into the top hits the Trade Ideas AI powerhouse delivered this week:
🔥 Holly's Super System Calls (The Top Hits!):
★ ADIL (Buy): 151% in a day (2/28). Check the Chart 👀
★ CONL (Short): $5+/share in a day (2/28). Check the Chart 👀
★ URBN (Short): $3.80+/share in a day (2/28). Check the Chart 👀
★ JANX (Buy): $15+/share in a day (2/27). Check the Chart 👀
★ BFLY (Buy): 17% in a day (2/26). [Check the Chart 👀
★ DCBO (Buy): $3.20+/share in a day (2/23). Check the Chart 👀
★ EBS (Buy): 75% in a day (2/21). Check the Chart 👀
★ ...and that's just the top of the pops!\
🌠 Swing Trade Stars (Still Shining!):
★ VKTX: 250% since 2/8. Check the Chart 👀
★ VKTX: Exit Long and Get Short 15 points next day Check the Chart 👀
★ CLSK: 171% since 1/29. Check the Chart 👀
★ EBS: 95% since 2/21. Check the Chart 👀
★ OCUL: 87% since 2/9. Check the Chart 👀
★ JNX: $21+/share since 2/27. Check the Chart 👀
★ ...can't list them all!\
👉 Click. See. Believe. We find, you trade, we all win🏆. It's that simple.
While others might get caught up in the spectacle of marketing and pour fortunes into influencers and glitzy campaigns, we've been pouring our sweat into what truly matters -- AI firepower technology. After all it's not the flashiest billboard that counts but the solid results you can take to the bank. And on that front, Trade Ideas is second to none. Our commitment to innovation and performance has made us the fastest-growing fintech subscription service, a title we wear with pride.
Why Trade Ideas AI?
Because when it comes to crunching numbers, Holly goes full ballistic and no other service comes even close:
-
Stream faster than your shadow with our real-time idea & pattern recognition.
-
Buy and ShortSell directives from our AI Holly mean you're always on the smart statistics side of the trade.
-
With our pioneering Picture in Picture Charts, your intuition and our AI become an unbeatable duo.
Please Note: Not all trades are winners 🚫, that's just the nature of the stock market. The Trade Ideas AI, Holly, is not a crystal ball but a mathematical powerhouse in your hands. Success is about us + you working together, not blindly following. It's about making those smart plays with a bit of human intuition sprinkled in. Remember, Trade Ideas isn't investment advice; it's your whole investing game ELEVATED.
Trade Ideas AI Holly Calls the Reversal in VKTX?
You might recall our recent buzz about VKTX's epic ascent after Holly's perfect entry at $28.26 in early Feb? Well, the saga continues today, and it looks like a blockbuster! 🌟
As VKTX surged an eye-popping 125% yesterday and tacked on another 45% today, Holly's crunching some serious NUMBERS.
The TI AI switched statistical gears and is now playing the downside, locking in profits and shorting VKTX as it hits peak momentum. This isn't just a win; it's a double-win strategy, securing gains and then capitalizing on the pullback! It's called mean reversion and when you catch it MEANS ALOT!
Catch the Downswing with Holly 📉
This is what makes Holly the ULTIMATE AI trading assistant -- not just capturing the climb but also then saying take profits and switch directions. It's the card counting AI eye in the market storm, the edge every trader dreams of having.
Remember, markets ebb and flow, but with Holly, you're set for both tides. 🌊↔️🌊
This is not investment advice. Of course not every trade works so well. Do your due diligence and never follow blindly; Holly's is your AI super trading assistant, here to empower, not replace, your own trading prowess.
Don't Just Watch - Join Holly!
Trade Ideas AI Does it Again: Smashing Records Before Noon!
Hope you're strapped in because the Trade Ideas AI, Holly, has been surfing the stock market waves like a total pro today! We've got some thrilling rides to share with you! 🏄♂️💼
Today's Highlights - Not Even Noon and Check These Out!
★ 152% potential profit with ADIL! 🌟 Check the chart 👀
★ 11% gain could've been yours with ACMR! 💥 Check the chart 👀
★ 8% on a silver platter with URBN short! 🌊 Check the chart 👀
★ 19% slide captured with VANI! 📉 Check the chart 👀\
Why TI AI? Because not every wave is perfect, but Holly's got the surfboard to catch the winners. Remember, not all trades will bring home the trophy 🏆, but having Holly in your corner is like having a secret map to hidden treasures in the vast ocean of stocks.
Catch the Wave! Don't let another slide by
We're all about that edge - combining human intuition with Holly's machine-powered insights. Together, we're unstoppable. 💪👩💻
Watch my video more visuals. 🎥
Remember, trading is an art and a science. It's not about following blindly but about making informed decisions. Holly's here to illuminate the path, but the journey is yours to embark upon. Not investment advice. Your trades, your responsibility. 🛡️📚
Don't Miss Out! Haven't joined the Holly crew yet? Today's waves are just a taste of what you could be riding every day. Don't let another gem pass you by. 🌟🌊
Stay sharp, stay informed, and let Holly be your guide to navigating the thrilling highs and lows of the stock market.
Act Now! Don't miss out on these launches
Impossible to Mute: TI AI Trading System Brilliance Is Blaring!
Today, Trade Ideas AI trading system, Holly, was on fire again 🔥, and we can't keep quiet about it! Just by scanning this email, you'll get why Holly is the trading partner you've been searching for. Here's the quick scoop on her two best trades:
JANX Breakout - Entered at $37, soared to a high of $50. That's a jaw-dropping 35% profit potential! 💸
BBAI's Quick Leap - From an entry at $2.89 to $3.37 high. We're talking 16% profit potential in minutes! 🚀
👉 Dive into the action with Holly now and start catching these leaps!
Why Holly? Simply put, she finds these gems 💎, giving you the edge in a fast-paced market.
Remember: Trading involves risks. This isn't investment advice but a showcase of what's possible when human intuition meets Holly's precision. It's about partnership, where together, we aim for the stars.
Holly's waiting to team up. Are you in?
👉 Yes, I'm in! Show me how to team up with Holly.
From Quick Picks to Enormous Gains!
Ever wondered how some traders always seem to catch those elusive multi-day runners? 🤔✨ Well, Holly's AI Signals have been turning day trades into spectacular swing trades, and we've got the inside scoop just for you!
VKTX: A Stellar Journey 🌠
- Entry on 2/8: Grabbed at $28.26\
- Now soaring at $75.45 after 19 days!\
- Profit Potential: A whopping 166% 🚀\
- Holly's Magic: Turned a day trade into a gold mine!
Check the Chart 👀
CLSK: Powering Up ⚡
- Entry on 1/29: Picked at $8.25\
- Energized to $21.87 over 29 days!\
- Profit Potential: A powerful 165% 🔌\
- Energetic Growth: More than just a spark!
Check the Chart 👀
OCUL: Seeing the Future 🔮
- Entry on 2/9: Snagged at $5.62\
- Climbed to $9.92 in 18 days!\
- Profit Potential: An eye-popping 76% 💸\
- Visionary Pick: From a quick glance to a long look!
Check the Chart 👀
Human + Machine: Remember, Holly is a virtual trade assistant, not a fortune teller. 🤖💼 It's all about smart collaboration -using Holly's signals as a guide while applying your trading savvy. See what Holly sees - join today!
Risks? Absolutely. Trading involves risks and not every Holly tip is a winner. But with Holly's edge, you're equipped to make more informed decisions, potentially turning the tides in your favor.
So, ready to join the ranks of savvy traders who leverage Holly's insights for those longer-term gains?
Unlock Your Trading Potential with Holly and transform your game. 💥
Remember, no signal should be followed blindly. Always do your research! Not investment advice. 📚🔍
Catch Today's Big Winners with Holly! Quick Moves, Quicker Profits
Ready to amplify your trading success? Holly is your answer.
Here's the breakdown of today's action:
✨ ASPI: Leaped from $3.40 to a high of $3.85, scoring over 13% profit potential ✨.
✨ RCUS: From $18.11 to a high of $19.96, a +10% profit potential ✨.
✨ GSHD: From $73.02 down to a low of $67.08, that's +8% profit potential ✨.

Short, sharp, and straight to profit - that's Holly's mantra. Eager to join the winners? Let's roll with Holly
Remember, trading is the ultimate adventure. Today's wins underscore the potential, but with every high, there's risk. Holly is here to guide you through, but your journey is your own and every decision is ultimately yours. Trade smart with Holly
Start now and make the market work for you.
Please Note: This is not investment advice. Trading involves risk and is not suitable for all investors.
TI AI Serves up a 75% Winner in Just One Day!
Got a minute? That's all it takes to see how you could have tapped into immense profit potentials exceeding 75% today, guided by Holly, the Trade Ideas Artificial Intelligence. Here's the rundown of YOUR ADVANTAGE:
-
EBS: Unearthed as your potential goldmine, surging +75% to a peak of $3.25.
-
GLBE & CAVA: Identified as your astute shorts with a 4% drop each for gains.
-
WTTR: Pinpointed as a subtle opportunity, gently ascending +1% to $9.05.
Here's the Skinny: Yes, trading thrills with its risks, but who said you have to navigate it alone? Holly is your secret weapon in the fluid dance of the market, turning complex data into actionable, profitable insights.
Why Wait? Start making trades that others only dream of! Become a Holly Follower
Please Note: This is not investment advice. Trading involves risk and is not suitable for all investors.
Holly's Winning Ways with BTAI, DKNG and ROKU
Brace for impact! Holly's premium picks are the cannonballs in our arsenal, and they're hitting with such power, we're contemplating a price adjustment!
BTAI's Bullish Blast 🚀
Holly saw potential for a BIG REVERSAL and called it in BTAI. The Entry signal was at $2.39 and in just a few days it danced its way up to a high of $3.71, delivering a hearty +24.91% from our entry. Missed out? Don't let the next one fly by.
DKNG's Downward Dash 📉
Holly called a short entry in DKNG like Tom Brady throwing a perfect touchdown pass to a receiver. Just as our AI reads the numbers, DKNG fell and is racking up a sweet +21.55% gain. Entry signal was at $44.37 and it went to a sleek $41.70. With Holly we make the market's down turn your personal upside story.
ROKU's Rewarding Rout 🎯
And can we have a drum roll for ROKU, please? It plunged from $76.80 to $66.55, turning a perfect short into a +25.35% gain. With the Trade Ideas AI, you are NEVER in search of AMAZING statistical opportunities. Holly saw some trouble in streaming TV land and let our Premium Subscribers know that ROKU could potentially face further declines, offering a ripe opportunity for those looking to capitalize on market movements.
Short with Confidence with Holly
If this were Vegas, the casino would be paying for your luxury suite by now. But why dream of Vegas when you can live it in the market? Holly's your card counting high-roller table, and seats are limited.
So, hop on the Holly train before we have to up the ticket price!
Thrill Ride Alert: TDS, SDGR and RGNX - Fasten Your Seatbelts!
Today, Holly turned the stock market into her own personal roller coaster, and guess what? She's inviting YOU to ride shotgun. Buckle up; it's going to be a wild ride filled with twists, turns, and, most importantly, thrills! 🎢
First Stop: The Thrill of the Chase with TDS! 🌪️ (18.56% Profit Potential)
Did you ever imagine selling something you don't own could be so exciting? Holly did just that by short selling TDS at $16.97 and then, like a ninja in the night, buying it back at a lower price. Boom! A cool $271 in profit for 100 shares. Want to sneak up on your profits like Holly? Join the thrill seekers now!
Next Up: ROKU's Roller Coaster Drop! 🎢 (7.55% Profit Potential)
Imagine you're at the peak of the highest roller coaster, and then - whoosh - you're racing down! That's Holly with ROKU, short selling it at $76.8 and laughing all the way to the bank with a $371 profit for 100 shares. Ready to feel the rush? Dive into the action with Holly!
Soaring High with SDGR! 🚀 (4.67% Profit Potential)
Ever wanted to fly? Holly took SDGR on a sky-high adventure, buying low at $31.49 and soaring up to a $122 profit for 100 shares. Grab your ticket to the skies with Holly!
Glide with RGNX! 🌈 (4.36% Profit Potential)
With the grace of a glider, Holly caught RGNX at $19.48 and gently landed with an extra $46 for her 100 shares. Join Holly for a smooth ride to profit town!
Tiny Steps with RGTI! 🐜 (5.45% Profit Potential)
Even the smallest steps can lead to big adventures. Holly spotted RGTI at $1.65, took a tiny leap, and still made a profit. Make every move count with Holly!
Whether the market zigs or zags, Holly's got your back, turning potential pitfalls into profit peaks. 🌊🔝
Ready to turn the market's ebbs into your personal peaks?
Want the Secret Sauce to Tomorrow's Wins? Holly Spills the Beans!
Imagine if your trades had a secret sauce, a magic touch that turned today's moves into tomorrow's legends. 🎩✨ That's Holly for you - not just a day's wonder but a treasure map to multi-day fortunes.
This past week alone, we've seen Holly work her magic across the board:
-
QBTS not just leaped but soared from $1.32 to $1.93, boasting a hefty 46% gain in 3 days. Think superhero, cape and all! 🦸♂️
-
BTAI bloomed from Holly's entry signal on the 13th at $2.39 to $3.14, more than just spring flowers - a 31% profit bloom.
-
INBS danced from $3.98 on the 9th to $5.06, owning the floor with a 27% rhythm of gains.
-
And PLTR, it didn't just fly; it rocketed from $20.79 to $25.23, a solid $4, 7-day journey to the stars.
And guess what? These are just the highlights. The past 7 days have been packed with success stories too numerous to list here. Holly isn't just playing the day game; it's weaving futures, one trade at a time.
Why stick to the ordinary when Holly's ready to guide you through the markets' hidden paths, unveiling opportunities that others only dream of?
Ready to ✨ Discover Holly's Secret Sauce? ✨
PLCE, QBTS, RGTI: The Triple Crown of Trading Wins!
We're only halfway through the trading day, and just like your favorite barista knows your order, Holly knows your trades. Here's the quick brew on today's midday market moves:
☕ PLCE
A smooth blend, in at $14.02 and percolated up to a $16.84 high. A rich and satisfying $2.66 gain per share so far, with extra foam!
🍵 QBTS
Steeped from $1.32, and what a steep climb it was, to a refreshing high of $1.50. That's a full-bodied flavor of a more than 13% potential gain!
🍹 RGTI
Stirred up from $1.38 and gently stirred to a $1.53 high. A subtle yet satisfying 10.14% potential gain from entry to the current high, like the perfect sip of summer.
It's a triple treat, a hat trick of trading triumphs.
🎥 Visualize the Victory in this Video 🎥
So, are you in, or are you out? Because in the world of trading, hesitation is the heaviest anchor.


