Show AI Trades
The trades of Holly will not only be presented to you in the AI Strategy Trades Window but also on the charts.
To enable this feature, right-click into your Chart, select Properties, and then Show AI Trades.
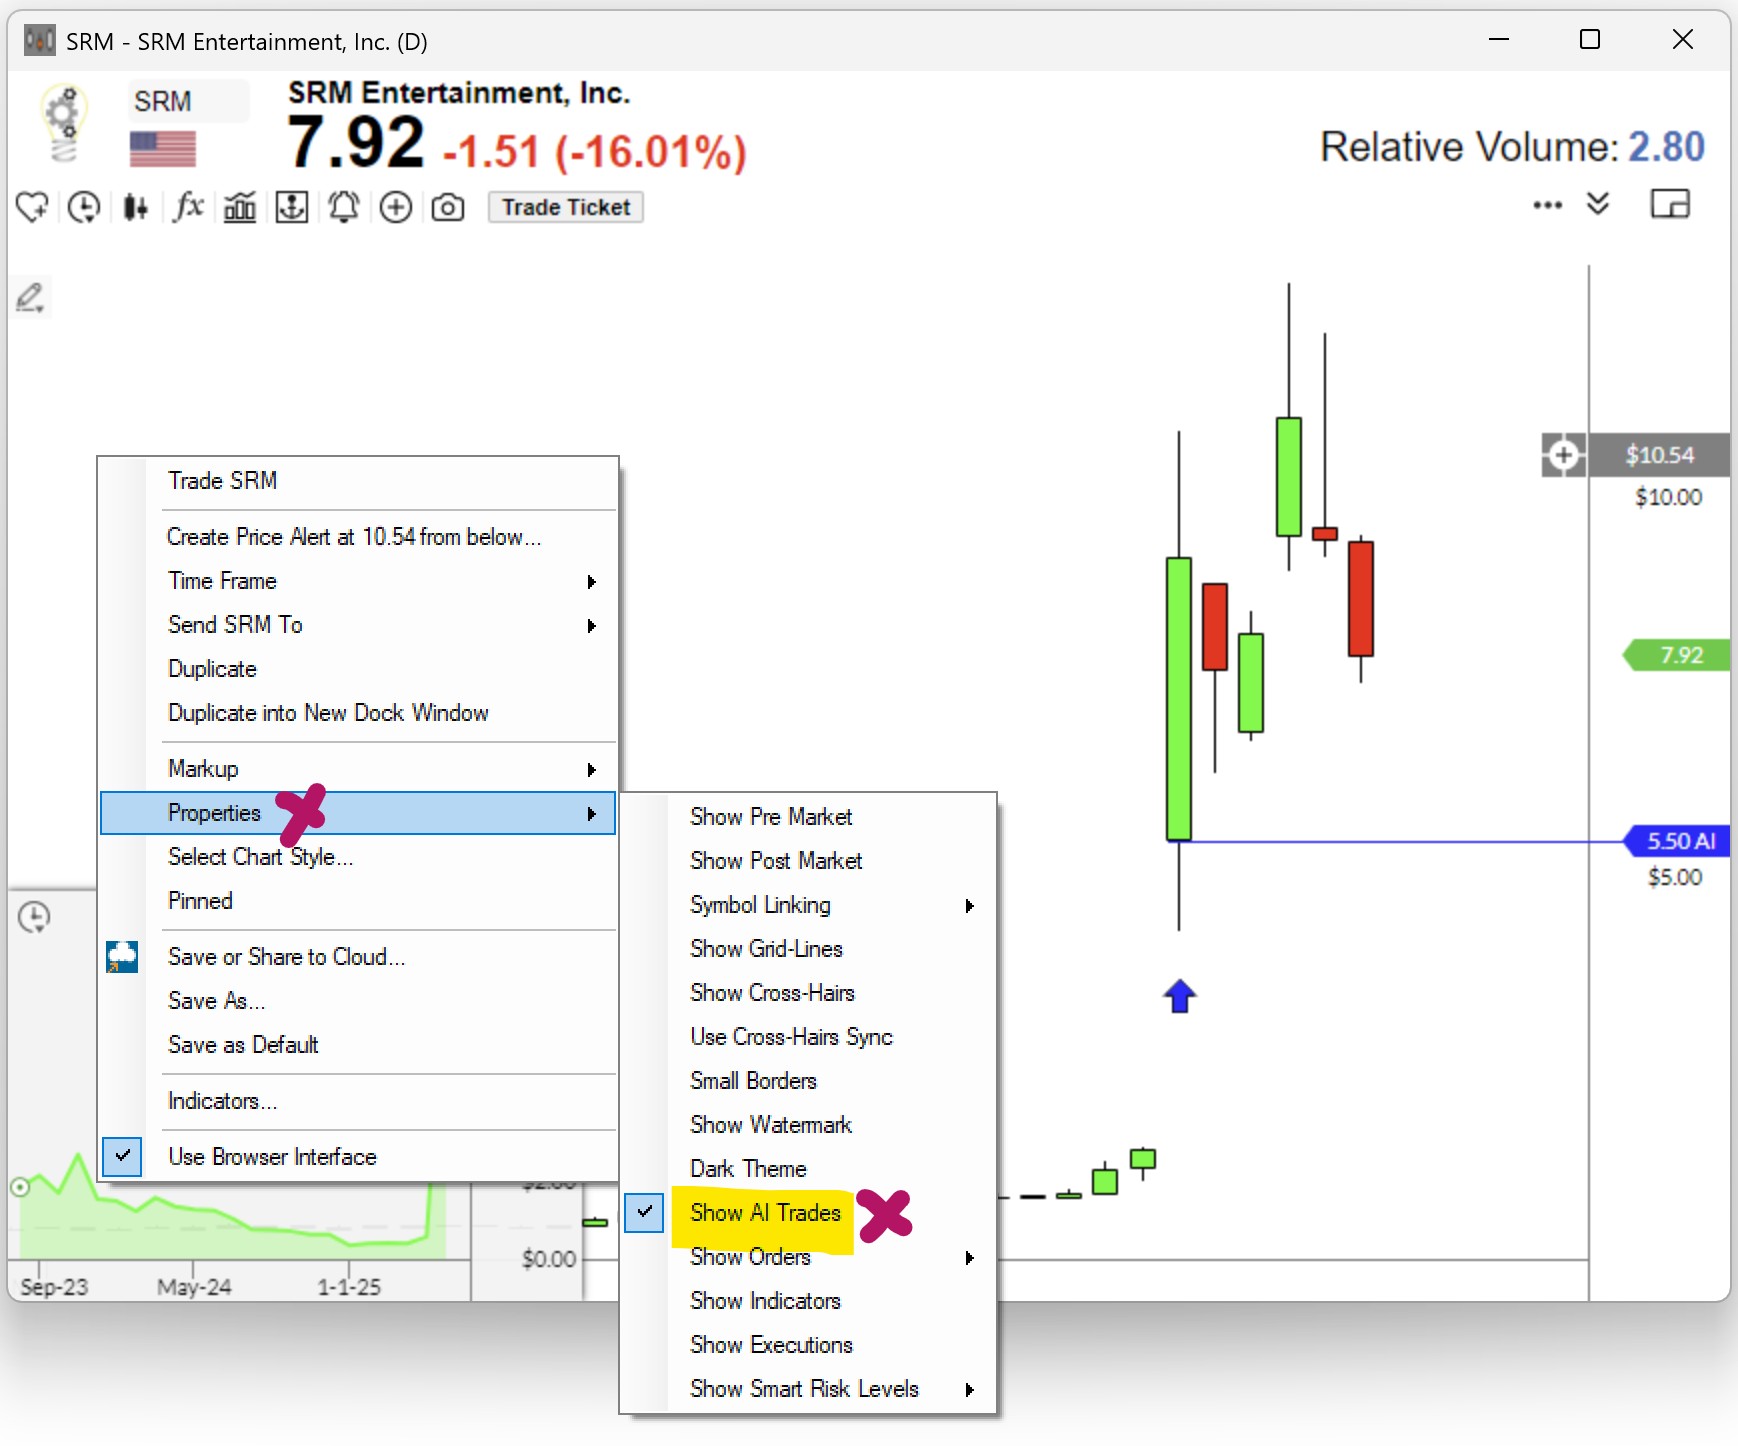
The AI trades will be displayed in a quick and easy-to-grasp visual format:
-
An upward-pointing arrow indicates the entry bar of a Long Trade.
-
A downward-pointing arrow indicates the entry bar of a Short Trade.
-
The blue line represents Holly's Entry Price.
-
A red line indicates the Stop Price.
Holly Visuals on Charts: