Holly AI History & Performance
The History Feature allows you to analyze Holly’s past trades. You can select specific days or a time period.
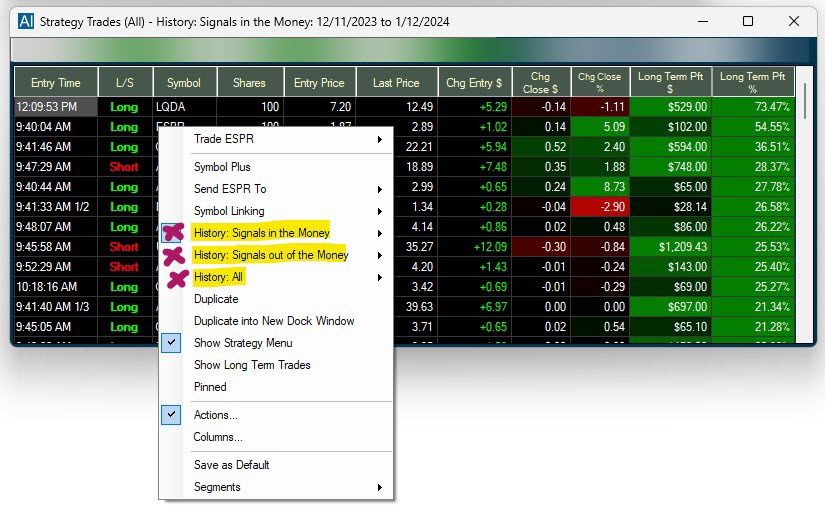
To access the function, right-click into the AI Strategy Trades Window and select one of the following three options:
- History: Signals in the Money
The Signals in the Money Window allows you to see Holly’s past trades for the chosen time period ranked by long-term profit in percent with the highest return at the top and ending at 0%.
- History: Signals out of the Money
The Signals out of the Money Window allows you to see Holly’s past trades for the chosen time period ranked by long-term profit in percent starting at 0% and descending into negative values.
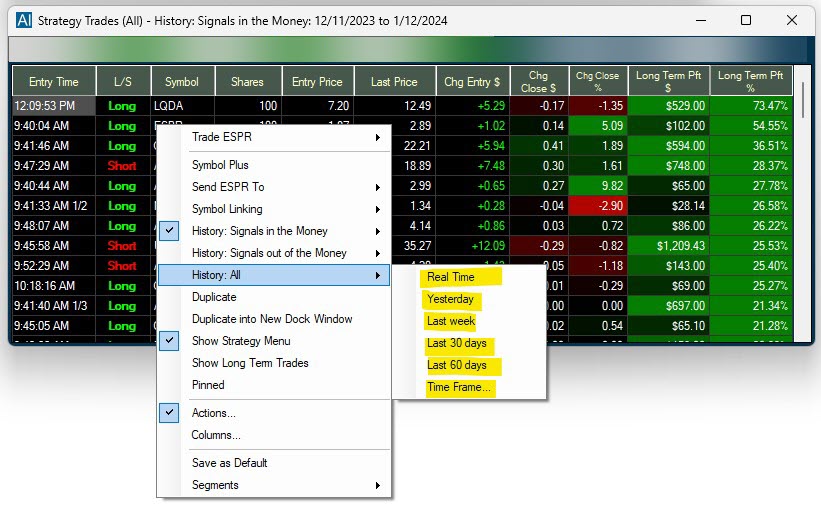
- History: All
The All History Window allows you to see all Holly’s past trades for the chosen time period ranked by long-term profit in percent starting at the highest percentage return and ending at the lowest percentage return.
Each option allows you to refine the results by selecting specific days or a time period for your review.
You can sort the output of these History Windows by specific columns.
To transfer the column entries into a spreadsheet, highlight the rows either by clicking and holding down your left mouse key while moving over the rows or by pressing the Control and A key on your keyboard. To copy your selection, press the Control and C key on your PC’s keyboard. Finally, press the Control and V key to paste the selected rows into your spreadsheet.
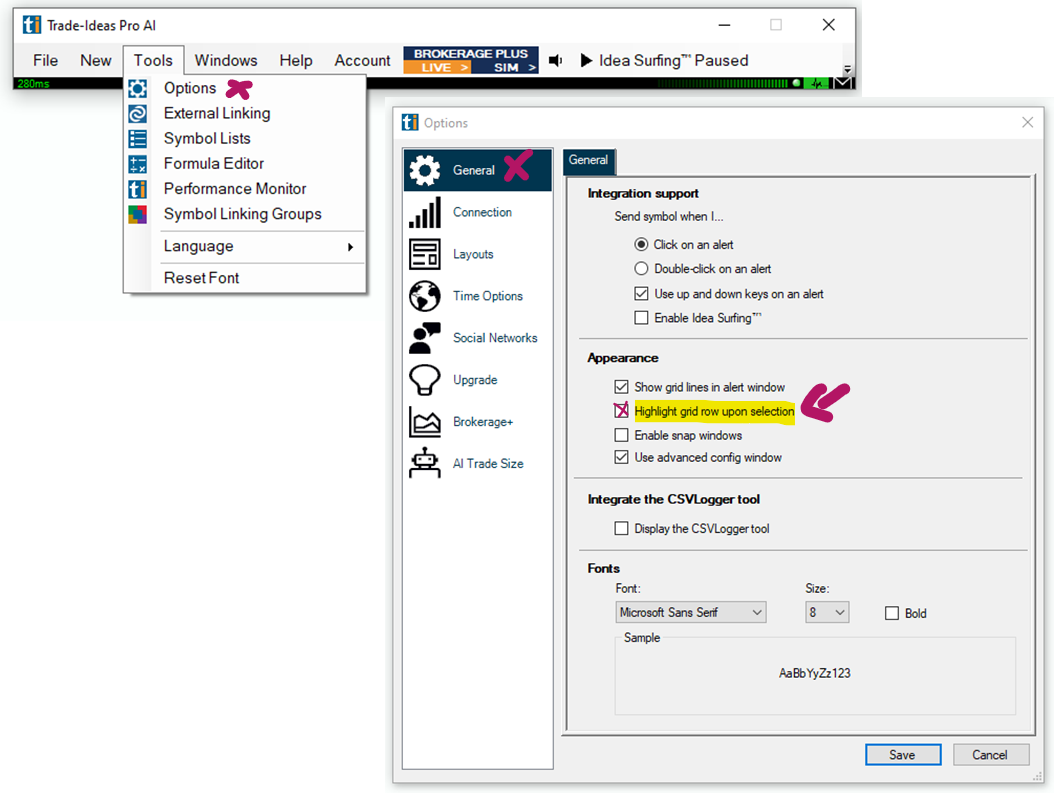
Go to the Toolbar, select Options, Layouts, and then Highlight grid row upon selection to highlight entire rows with one mouse click. If this setting is disabled, you can highlight single columns.
To see some of Holly AI's great past trades have a look at our Holly Records Page