Premium AI Longterm Strategy Trades Window
Holly exits all her trades at the end of each trading day. However, the trade catalysts don’t simply expire when the stock market closes. Some of these triggers offer the potential to catapult a stock over the course of several days or weeks in the direction of the day’s trading signal.
The AI Longterm Strategy Trades Window enables you to see these trades.
Traders can now benefit from Holly’s carefully selected trades beyond the initial trading day, and easily track them.
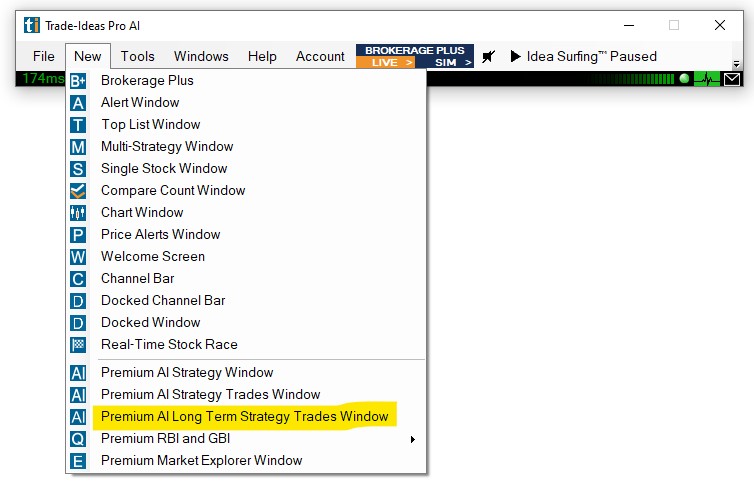
To load this window, go to the Toolbar, open the File Tab and select Premium AI Longterm Strategy Trades Window:
All stocks listed in the Long Term Strategy Trades Window fit one of the following criteria:
-
When the original trade was a Long Trade, they are either making new highs or are moving from red to green.
-
When the original trade was Short Trade, they are either making new lows or are moving from green to red .
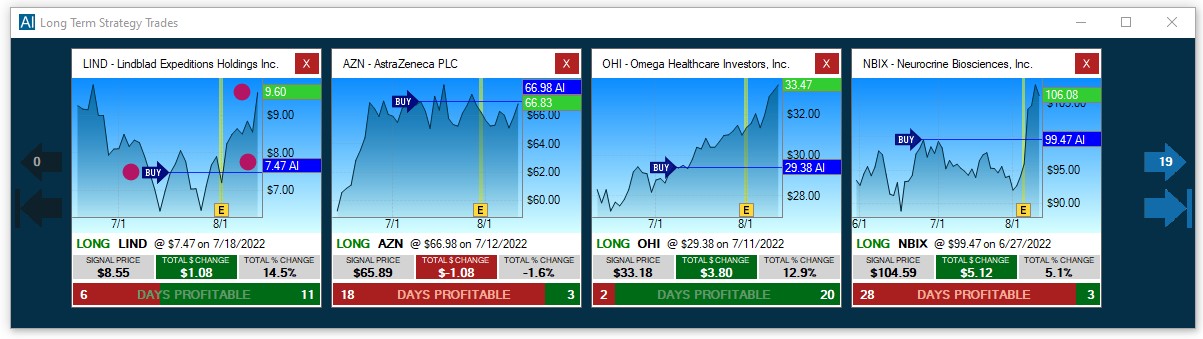
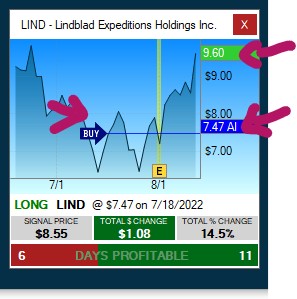
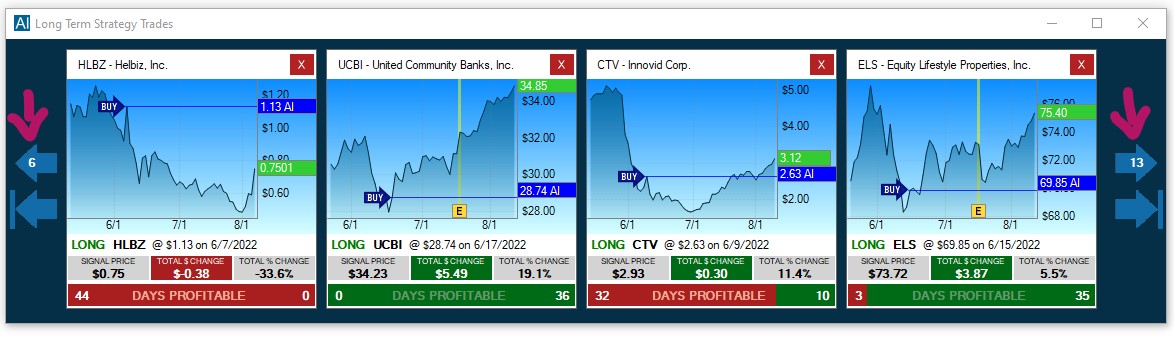
Each thumbnail chart relays the following info:
-
The Direction of the Trade (Buy/Sell)
-
The Original Entry Price
-
The Current Price of the Stock
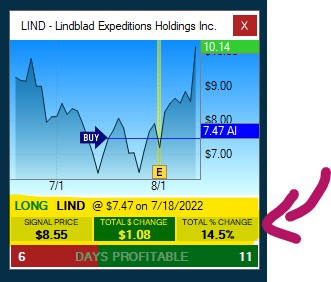
Below each thumbnail chart you will find the following info:
-
The Direction of the Original Holly AI Trade (Long or Short)
-
The Original Entry Price
-
The Date of the Original Trade
-
The Signal Price, which is the price that triggered the stock being added to the Longterm Holly AI Strategy Trades List
-
The Total Change in $, which is the difference in dollar between the Original Entry Price and the Signal Price
-
The Total Change in %, which is the difference in percent between the Original Entry Price and the Signal Price
-
The Total Number of Profitable Days counted from the Original Entry Date
By default, the thumbnail charts are sorted by Signal Time, from left to right.
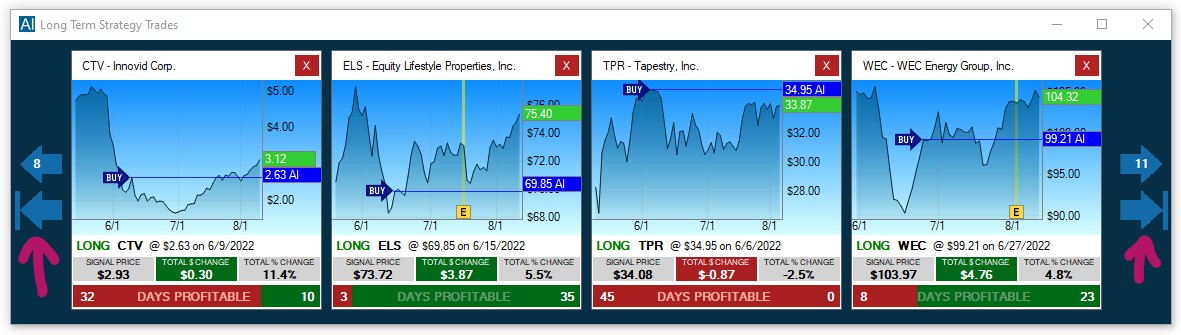
Clicking the top arrows on the left and right-hand side enables you to move through the list.
The total number of stocks on the list as well as the current position are displayed on these arrows.
A click on the bottom arrow on the right-hand side will bring you to the last stocks on the list, a click on the bottom arrow on the left-hand side will bring you back to the first entries.
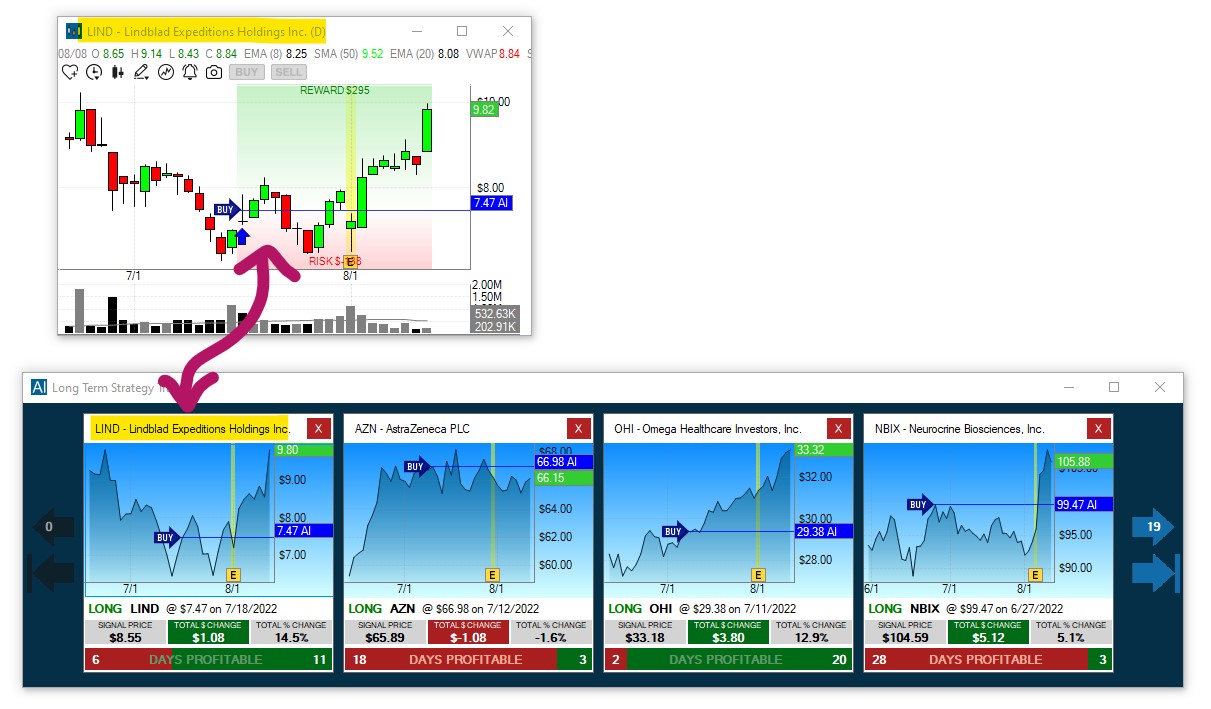
A click on the thumbnail header will load the stock in any symbol-linked chart
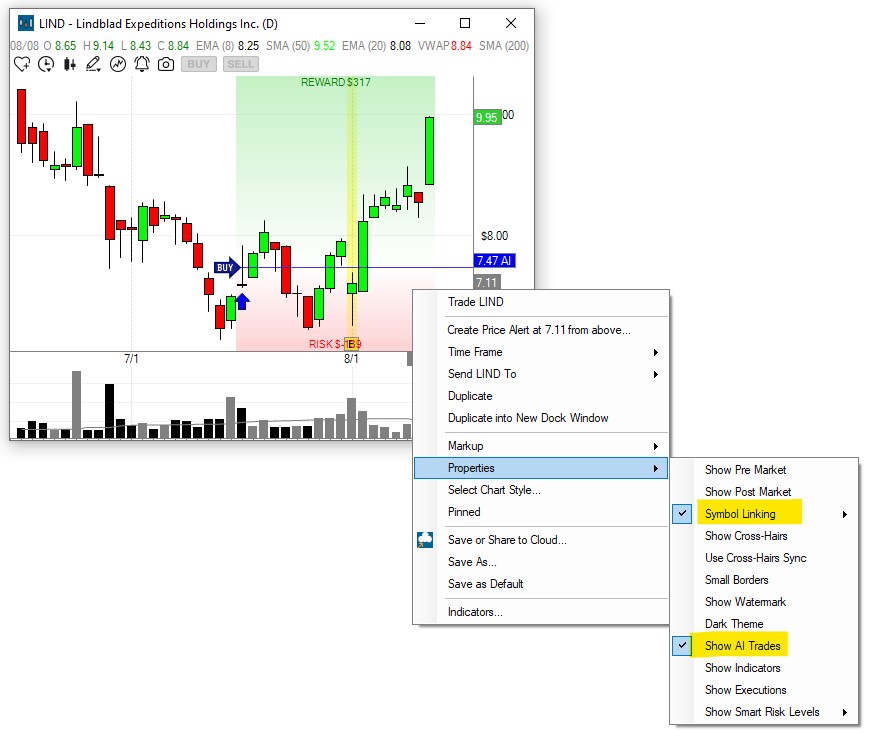
To see Holly AI Trade details in your chart, right-click into the chart, select Properties and then Show AI Trades
To see all longterm Holly AI trades in grid view, right-click into the Long Term Strategy Trades Window and select Show Data Grid.
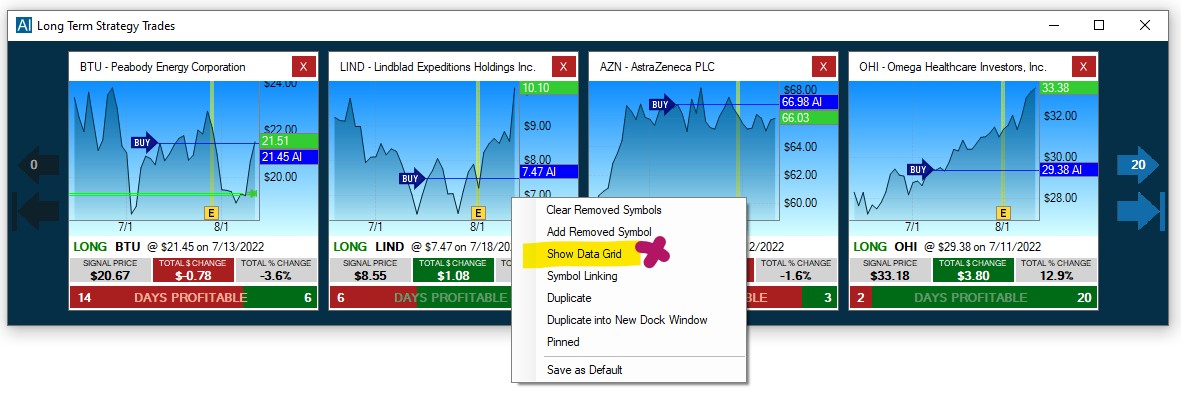
This will open the Long Term Strategy Trades Data Grid
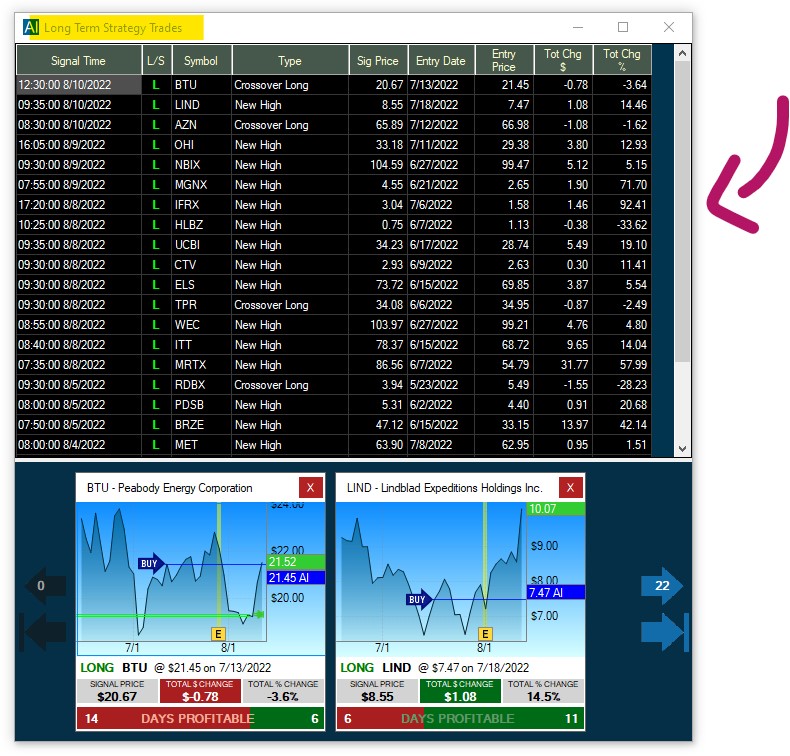
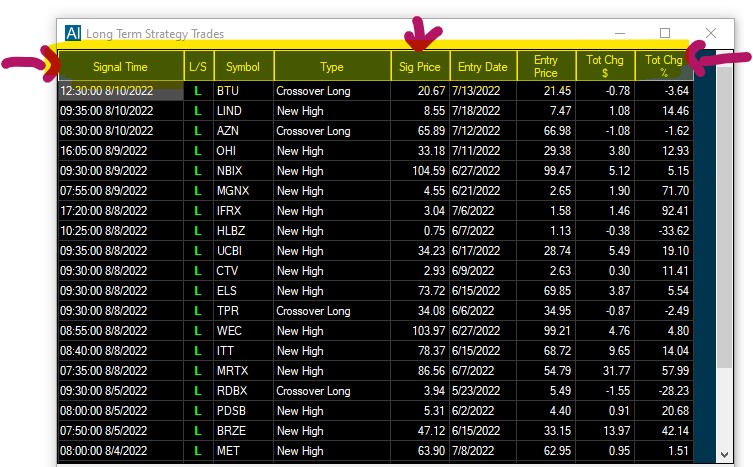
By default, the thumbnail charts are sorted by Signal Time Descending from left to right.
A double-click on a data grid colum header will change the sort order of the thumbnails accordingly.
To remove stocks from the list, simply click on the X in the top right-hand corner of the thumbnail chart.
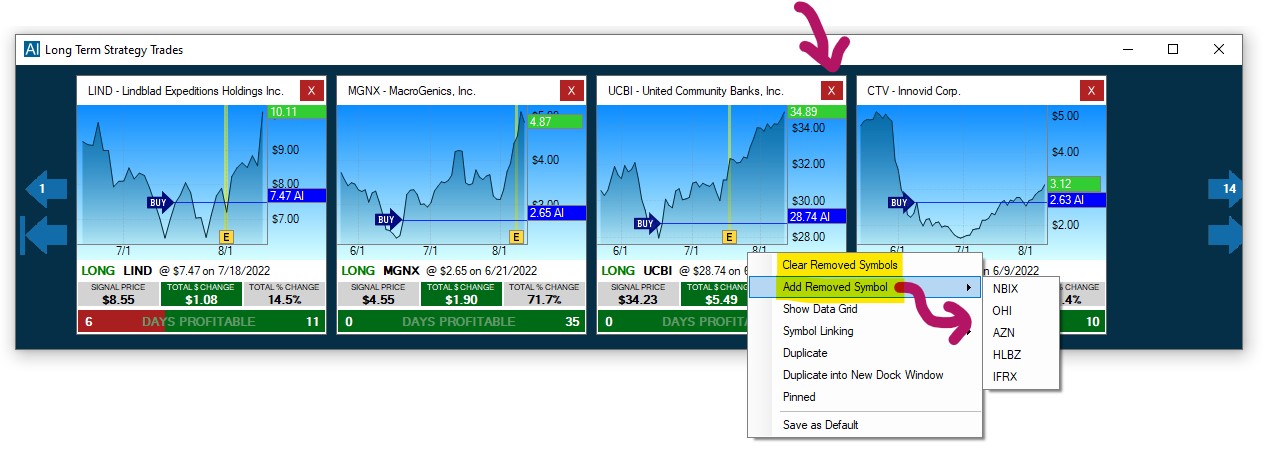
To reverse the symbol removal, right-click into the window and select, Clear Removed Symbols.
To add indivudal removed symbols back to the list, select Add Removed Symbols, then select the specific symbol(s) from the dropdown.