AI Profit & Loss Explained
The AI Windows give you a clear and detailed insight into the Profit & Loss Holly generates.
The Profit & Loss is always based on two settings:
-
The AI Risk Mode (Aggressive, Moderate, Conservative)
-
The AI Risk Size (Toolbar > Tools > Options > AI Risk Size)
AI Strategy Window
- P&L Graph
The Profit & Loss Graph displays the Total Profit & Loss based on AI Risk Mode & Risk Size.
You can toggle between the different Risk Modes.
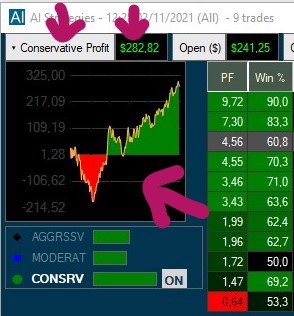
You can choose to show or hide the Profit & Loss Graph. Simply right-click into the AI Strategy Window and check or uncheck Show Profit & Loss Graph.
- P&L Columns
The Profit & Loss Columns display the Profit & Loss per AI Strategy based on AI Risk Mode & AI Risk Size. That’s why you always see three different columns, namely aggressive, moderate and conservative.
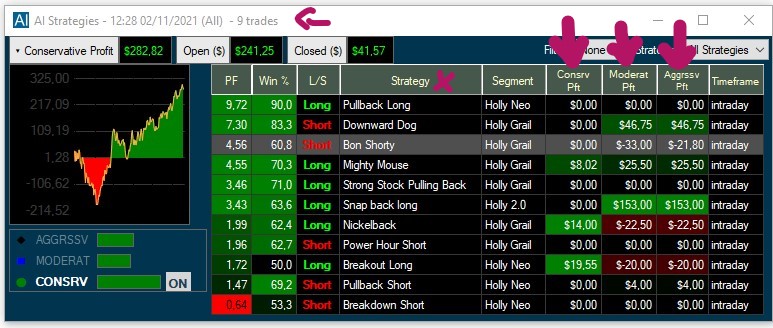
You can adjust the Risk Size by heading to the Toolbar. Open the Tools Tab, then select Options, and AI Risk Size.
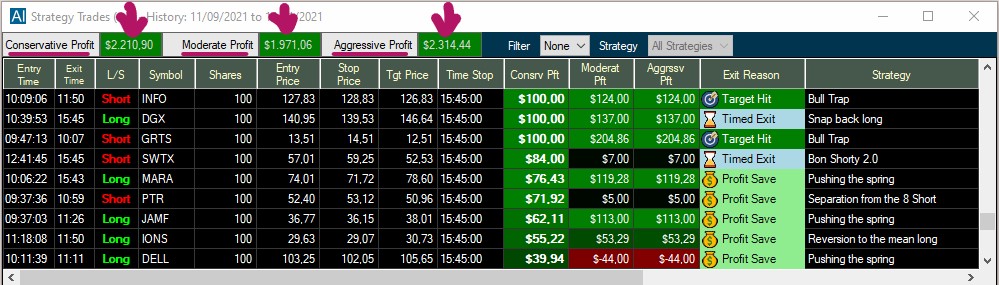
AI Strategy Trades Window
- P&L Columns
The Profit & Loss Columns display the Profit & Loss per AI Trade (based on AI Risk Mode & AI Risk Size).
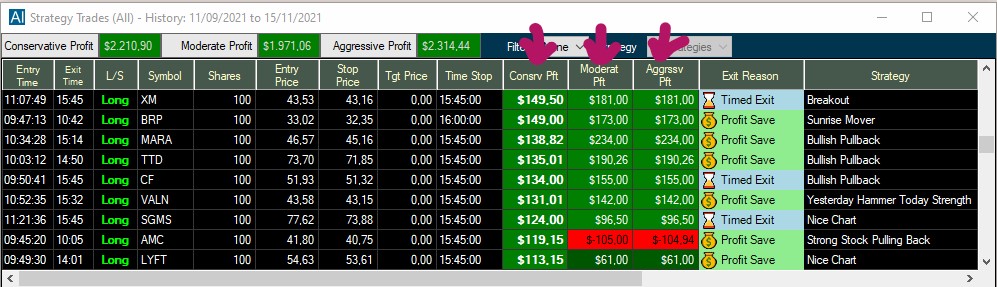
- Strategy Menu
The Strategy Menu on the top left-hand side displays the Total Profit & Loss based on the AI Risk Mode & Risk Size.
Brokerage Plus
- Positions Tab
The Positions Tab columns display the Profit & Loss per Trade
- Positions Tab Graph
The Positions Tab Graph displays the Total Trading Profit & Loss of all Trades
Please note, all your personal trades will be listed in the Positions Tab of Brokerage Plus, not only the Holly Picks you follow, but also all other trades that you have manually entered, or initiated via right-click from our charts and scans.