
When Does Earnings Season Start? A Q3 Guide for Active Traders
When Does Earnings Season Start? A Q3 Guide for Active Traders

Earnings season can turn a normal watchlist into dozens of stocks moving before the opening bell. For active traders, the problem is not finding companies that reported. It is deciding which moves have enough volume, liquidity, and structure to deserve attention.
If you are wondering when does earnings season start, when Q3 gets busy, or how to turn a crowded earnings calendar into a focused trading watchlist, this guide walks through the process from report timing to post-earnings price action.
Find Earnings Movers Without Watching Every Stock
Use real-time scanning to narrow a busy market into the earnings-driven stocks that match the price, volume, and movement you want to monitor.
| Quick answer: When does Q3 earnings season start?Q3 earnings season typically starts in early to mid-October, after the July-to-September quarter ends. Major U.S. banks often mark the unofficial beginning, while reporting activity usually peaks in late October and early November. |
Q3 itself covers July through September for calendar-year companies, but those results are reported afterward. CME Group notes that the second week of October commonly marks the start of the main reporting cycle, with major banks among the first large companies to report.
When Does Earnings Season Start Each Quarter?
The main U.S. earnings seasons generally begin in January, April, July, and October. Each reporting period follows the end of the previous fiscal quarter, although individual companies can report earlier or later based on their fiscal calendars.
A simple way to think about the cycle is:
| Results being reported | Quarter generally covered | Typical reporting season |
| Q4 results | October–December | January–February |
| Q1 results | January–March | April–May |
| Q2 results | April–June | July–August |
| Q3 results | July–September | October–November |
The SEC helps explain why reports appear after the quarter closes. Under current SEC Form 10-Q rules, large accelerated and accelerated filers generally have 40 days after quarter-end to file, while other registrants generally have 45 days. An earnings release can arrive before the formal 10-Q filing.
For traders, the practical point is simpler: preparation should start before the busiest reporting weeks, not after the market is already full of earnings gaps.
How Long Does Earnings Season Last?
Earnings season usually lasts about six weeks, but most major reports are concentrated within a two- to three-week peak period. Activity then tapers as smaller companies and off-calendar reporters release results.
When Does Earnings Season End?
Earnings season has no official end date. For Q3, the busiest reporting period usually winds down in November, although companies with different fiscal calendars may continue reporting later.
What Do the Q3 Earnings Season Dates Look Like?
The exact Q3 earnings season dates change every year, but the sequence is fairly consistent: early reporters appear first, large banks help start the main cycle, large-cap reporting accelerates, and later reporters extend activity through November.
A practical Q3 timeline looks like this:
| Period | Typical activity | What active traders can prepare for |
| Early October | Early and off-calendar reporters | Build watchlists and verify upcoming dates |
| Mid-October | Major financial companies | Bank gaps and related sector movement |
| Late October | Heavy large-cap reporting | More premarket and after-hours movers |
| Early November | Continued tech, consumer, industrial, and healthcare reports | Continuation, reversal, and sector setups |
| Mid-to-late November | Later reporters and retailers | Selective setups and second-day moves |
This is a planning framework, not a fixed schedule. Individual reporting dates can change, and companies with different fiscal years do not follow the calendar-year pattern.
How Should Traders Use a Q3 Earnings Season Calendar?
A Q3 earnings season calendar should help you plan which stocks require attention, not become your entire watchlist. Confirm the report date and time, then filter companies by liquidity, expected catalyst, price movement, and relevance to your strategy.
One calendar can also disagree with another because some dates are estimates based on previous reporting patterns rather than formally announced dates.
Before trading around a report, confirm:
- The earnings date
- Whether the release is confirmed or estimated
- Whether it is before market open or after market close
- The earnings-call time
- Any recent change to the reporting schedule
A company’s investor-relations page and SEC filings should take priority when you need confirmation. The SEC’s EDGAR database provides access to public-company quarterly, annual, and current filings.
For day-to-day scanning, an Earnings Date filter can also help separate stocks approaching an earnings report from those that have recently reported.
Before Market Open vs. After Market Close
Before-market-open reports give traders time to evaluate the earnings gap during premarket, while after-market-close reports create an initial evening reaction that can change significantly before the next regular session begins.
For a before-market-open (BMO) report, focus on:
- Premarket volume
- Gap size
- Premarket high and low
- Spread and liquidity
- Nearby daily levels
For an after-market-close (AMC) report, the first reaction is only part of the story. Guidance, an earnings call, analyst commentary, or changing liquidity can alter the move before the next opening bell.
That is also why extended-hours moves require extra caution. FINRA highlights lower liquidity, higher volatility, changing prices, and wider spreads among the risks of trading outside regular hours.
Should Active Traders Trade Before Earnings or After the Report?
Trading before earnings means accepting the risk of a sharp move before you know the results. Waiting until after the report lets traders evaluate the actual gap, volume, liquidity, and price structure before deciding whether a setup is worth trading.
Holding through earnings can expose a position to a large overnight gap. If the stock opens far from the previous close, an existing stop may execute at a very different price than expected.
Extended-hours trading gives earlier access to the reaction, but liquidity is often thinner and spreads can be wider. The initial move may also change after traders process guidance and earnings-call commentary.
By the regular-session open, traders usually have more information to work with. Instead of predicting whether earnings will beat estimates, they can ask a more practical question:
Is the market holding the new post-earnings price, or rejecting it?
For active traders, that shift from predicting the event to evaluating the reaction can make the setup easier to define and manage.
What Actually Drives a Stock’s Post-Earnings Reaction?
A stock’s reaction depends on more than whether EPS beat or missed estimates. Revenue, forward guidance, margins, expectations, prior price movement, and broader market conditions can all influence what happens after the report.
Results Versus Expectations
Markets respond to the difference between the reported numbers and what traders expected.
A company can beat EPS estimates and still fall if revenue disappoints, an important operating metric weakens, or expectations were already much higher.
Forward Guidance
Guidance can have more influence than the quarter that just ended because it changes expectations for future performance.
Traders may pay particular attention to:
- Revenue outlook
- Earnings guidance
- Margins
- Demand trends
- Customer or subscriber growth
Price Action Before Earnings
A strong pre-earnings rally can raise expectations. If much of the good news is already reflected in the stock price, even a solid report may fail to generate further upside.
This is why the chart before the announcement matters as much as the headline afterward.
Sector and Market Reaction
A major report can also move competitors, suppliers, and related sector stocks.
For active traders, these sympathy moves are worth monitoring because the cleanest post-earnings setup may sometimes appear in a related stock rather than the company that reported.
Why Can a Stock Fall After Beating Earnings?
A stock can fall after an earnings beat when guidance disappoints, margins weaken, expectations were higher than published estimates, or the positive result was already reflected in the price. The market trades the full message, not one EPS number.
Other possible reasons include:
- Revenue missed while EPS beat
- An important business metric slowed
- Management lowered its outlook
- The stock rallied sharply before the report
- Earnings-call commentary changed sentiment
- Buyers failed to support the initial gap
This is why “beat = bullish” and “miss = bearish” are unreliable shortcuts.
For an active trader, the price reaction is information. If a stock cannot hold a positive earnings gap despite apparently strong numbers, that failure may be more useful than the headline itself.
How Can Traders Narrow an Earnings Calendar Into a Focused Watchlist?
A useful earnings watchlist prioritizes confirmed catalysts, liquidity, meaningful gaps, unusual participation, manageable spreads, and clear price levels. The goal is to reduce dozens of reports to a small group of tradeable stocks.
A five-minute scan can be more useful than manually opening 50 charts.
1. Confirm the Catalyst
Start by confirming that earnings or guidance is actually driving the move. A stock can have multiple news events on the same day, and misunderstanding the catalyst can lead to a poor read of the reaction.
Check the release itself before deciding what the market is responding to.
2. Check Liquidity
Liquidity determines whether a chart setup can realistically be traded. Strong percentage movement means little if the spread is wide, volume is thin, or entering and exiting the position creates excessive slippage.
Look at:
- Average trading activity
- Current volume
- Bid-ask spread
- Price
- Premarket participation
Thin names may look impressive on a percentage-gainer list while offering poor execution.
3. Measure the Gap in Context
Gap percentage is useful, but it does not tell you whether a move is unusual for that specific stock. Comparing the gap with the stock’s normal volatility can help separate routine movement from a genuine repricing event.
A 4% gap in a normally quiet large-cap stock may be more significant than a 7% gap in a stock that regularly makes large daily moves.
For more detail on separating tradeable gaps from noisy movers, this gap-scanner framework covers gap size, volume, catalysts, liquidity, continuation, and fade conditions.
4. Check Relative Volume
Relative volume helps answer whether the market is paying unusual attention to the stock right now. After earnings, strong participation can make a price move more meaningful than the same move occurring on ordinary activity.
The useful comparison is not simply today’s partial volume versus a normal full trading day.
Trade Ideas’ Relative Volume filter compares activity with typical volume around the same time of day, helping traders judge whether current participation is unusually high.
5. Check Price Location
Price location tells you whether the earnings move is breaking an important area or simply moving inside an existing range. A gap into major resistance is a different setup from a gap into open space.
Mark:
- Previous close
- Prior-day high and low
- Premarket high and low
- Major daily support and resistance
- Recent consolidation areas
A Practical Earnings Watchlist Filter
| Factor | Question to ask |
| Catalyst | Did the company actually report earnings or change guidance? |
| Liquidity | Can I enter and exit without unreasonable slippage? |
| Gap | Is the move meaningful for this stock? |
| Relative volume | Is participation unusually strong? |
| Location | Is price interacting with an important level? |
| Spread | Is execution risk manageable? |
A stock does not become a good setup simply because it passes every filter. The filters decide what deserves attention. Price action decides what happens next.
How Can the Earnings Reaction Scorecard Help Evaluate a Mover?
The Earnings Reaction Scorecard helps traders judge whether a post-earnings move has real structure behind it. It focuses on five factors: gap significance, participation, price location, acceptance, and follow-through.
1. Gap Significance
Start by asking whether the gap is meaningful for that specific stock.
A 5% move may be significant for a normally quiet stock but routine for a highly volatile one. Compare the gap with recent price behavior and check whether it is pushing beyond an important daily range or level.
2. Participation
A strong move usually deserves more attention when volume expands with it.
Relative volume can help show whether traders are actively participating in the earnings reaction or whether the move is happening on limited activity. More importantly, watch whether that participation continues after the initial burst.
3. Price Location
Where the stock lands matters as much as how far it moves.
Key reference points include the previous close, prior-day range, premarket high and low, and major daily support or resistance. These levels help show whether the gap is breaking into new territory or running directly into an obstacle.
4. Acceptance
Acceptance tells you whether the market is willing to hold the new post-earnings price.
If a gap-up stays above a breakout level and buyers defend pullbacks, the move may be gaining acceptance. If price quickly falls back into the previous range, the original reaction may be weakening.
5. Follow-through
The final question is whether buying or selling pressure continues after the first move.
Look for sustained volume, controlled pullbacks, opening-range holds or breaks, VWAP reactions, and clean retests of premarket levels.
The scorecard is not meant to predict the next move. It gives traders a consistent way to decide whether an earnings reaction deserves further attention or is simply short-lived volatility.
What Post-Earnings Setups Should Active Traders Watch?
Post-earnings setups are less about the headline and more about what price does next. The key question is whether the initial gap is being accepted, rejected, or reorganized into a new trading range.
| Setup | What it looks like | What strengthens it |
| Earnings gap continuation | Price holds the gap and keeps moving in the original direction | Strong relative volume, controlled pullbacks, and support above key premarket or opening levels |
| Failed gap-up | A positive gap loses momentum and falls back toward the prior range | Rejection near the highs, loss of premarket support, and failed attempts to reclaim resistance |
| Failed gap-down | A negative gap cannot hold lower prices and begins recovering | Rejection of the lows, reclaim of premarket levels, and stronger buying volume |
| Opening-range breakout | Price settles after the open, then breaks the early range | Clear range formation, volume expansion, manageable spreads, and room before the next major level |
| Second-day continuation | The stock holds most of day one’s earnings move and stays active into the next session | Strong day-one close, retained gap, continued volume, and well-defined support or resistance |
How to Read These Setups
The setup name is only the starting point. What matters is whether price confirms the idea.
A gap-up, for example, is not automatically bullish. If buyers cannot hold the new price area and the stock slips back into the previous day’s range, the same gap can quickly turn into a failed-gap setup.
The same applies to a gap-down. If sellers lose control and price begins reclaiming important premarket levels, the better opportunity may be in the reversal rather than further downside.
Opening-range and second-day setups are useful for traders who prefer more structure. Instead of reacting to the first burst of volatility, they allow time for support, resistance, and participation to become clearer.
A practical premarket stock-scanner workflow can help narrow the initial list of earnings movers before these setups are evaluated on the chart.
The important point is not to force a stock into one of these patterns. If the move lacks volume, structure, or clear invalidation, it may be better treated as noise than as a setup.
Which Levels Should Traders Mark Before the Opening Bell?
The most useful earnings levels are those that show where buyers or sellers previously reacted: the previous close, prior-day extremes, after-hours and premarket ranges, major daily levels, the opening price, and intraday reference points such as VWAP.
A practical chart can include:
| Level | Why it matters |
| Previous close | Shows whether the earnings gap is holding or filling |
| Prior-day high/low | Defines the previous regular-session range |
| After-hours high/low | Shows the first earnings reaction |
| Premarket high/low | Defines the overnight reaction before the open |
| Major daily level | Adds longer-term price context |
| Opening price | Helps judge early acceptance or rejection |
| Opening range | Defines early regular-session structure |
| VWAP | Helps track intraday position relative to traded volume |
Do not turn every line into an entry signal.
For example, the premarket high becomes useful because it gives the trader a clear reference point. Whether a break is worth trading still depends on volume, spread, nearby resistance, and follow-through.
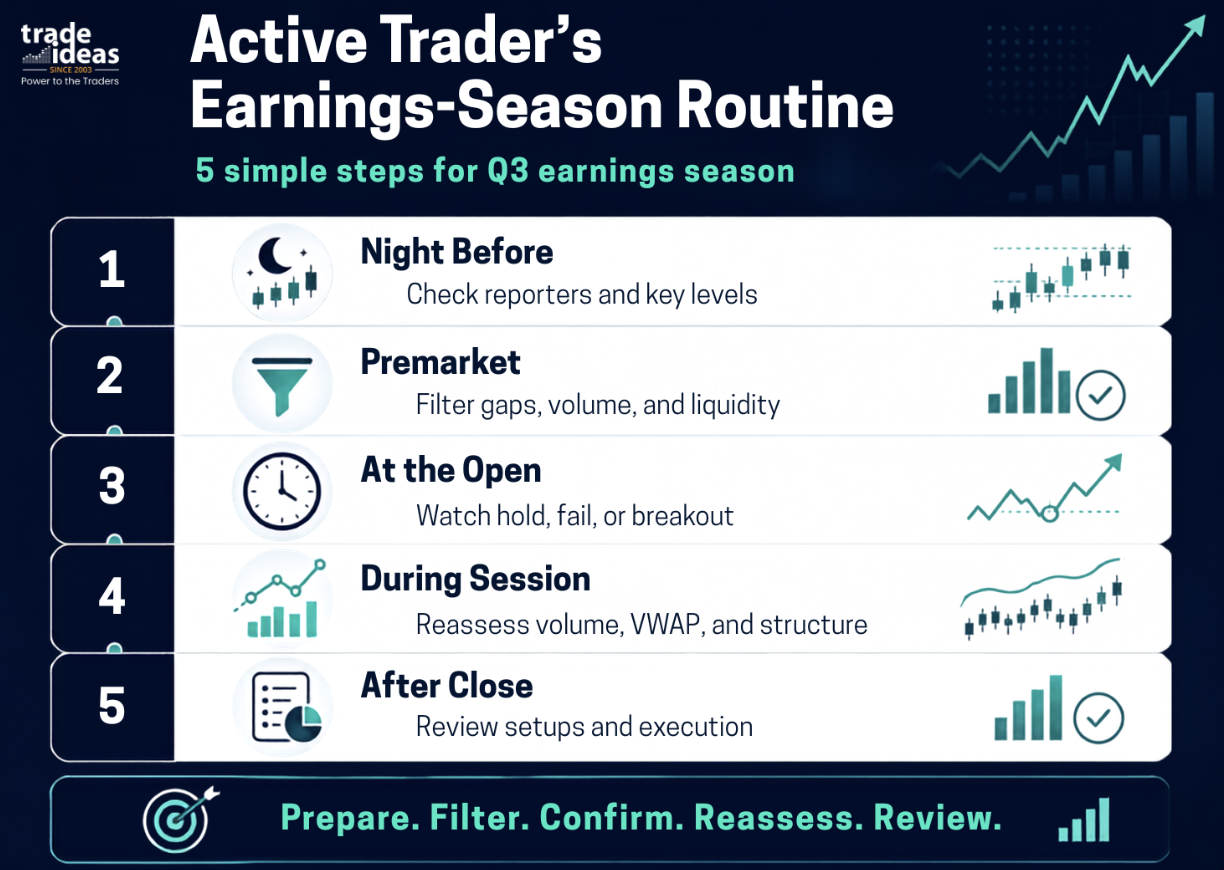
What Should an Active Trader’s Earnings-Season Routine Look Like?
A strong earnings-season routine should narrow decisions as the day progresses: prepare before the report, reduce the watchlist in premarket, wait for price structure at the open, and review what actually worked afterward.
How Can Stock Scanning Support an Earnings-Season Workflow?
Real-time scanning can reduce the manual work of tracking hundreds of stocks by filtering for earnings timing, gaps, volume, price, and intraday movement. The scanner finds candidates; the trader still decides whether the setup and risk make sense.
A practical earnings scan might combine:
- Recent earnings date
- Minimum stock price
- Minimum average volume
- Minimum gap percentage or volatility-adjusted gap
- Elevated relative volume
- Position within the premarket range
- Maximum acceptable spread
Trade Ideas supports these types of filters across its real-time stock-scanning environment, including earnings timing, relative volume, gaps, premarket position, average volume, spread, and price.
Example: Post-Earnings Momentum Scan
A post-earnings momentum scan should look for stocks where the catalyst has produced both meaningful price displacement and strong participation. Its job is to surface candidates for further analysis, not automatically generate an entry.
Possible starting conditions:
- Recent earnings report
- Meaningful positive or negative gap
- Elevated relative volume
- Sufficient average liquidity
- Price outside or near the edge of the previous day’s range
- Manageable spread
The thresholds should match the trader’s universe. A large-cap trader and a small-cap momentum trader should not automatically use identical settings.
Example: Failed Earnings Gap Scan
A failed-gap scan looks for stocks whose initial earnings reaction is losing acceptance. The relevant signal is not simply that the stock gapped; price must begin moving back through levels that supported the original reaction.
Possible conditions include:
- Recent earnings event
- Meaningful opening gap
- Strong current volume
- Price moving back toward the prior range
- Loss or reclaim of an important premarket level
The scanner creates the shortlist. The chart provides the context.
What Risks Matter Most During Earnings Season?
Earnings-driven stocks can move faster and trade less predictably than they do on a normal session. Active traders should pay particular attention to these risks:
- Overnight gap risk: A stock can open far above or below the previous close after an earnings release, leaving little chance to exit near the planned price.
- Wider bid-ask spreads: Fast-moving earnings stocks can have larger spreads, increasing the cost of entering and exiting a position.
- Slippage: Orders may fill at a worse price than expected when price is moving quickly or liquidity is limited.
- Thin extended-hours liquidity: Premarket and after-hours trading can have fewer participants, making large moves less reliable and execution more difficult.
- Sharp reversals: The first earnings reaction can reverse as traders digest guidance, management commentary, or the earnings call.
- Trading halts: Extreme volatility can trigger temporary halts, preventing traders from entering or exiting until trading resumes.
- False breakouts: High volatility can push price through an important level briefly before it quickly reverses.
- Chasing extended moves: A large earnings gap can create pressure to enter late, leaving poor risk-to-reward if the move is already stretched.
- Sector-wide reactions: A major company’s report can move competitors and related stocks, causing positions to react even when those companies did not report.
The takeaway is simple: more volatility does not automatically mean a better setup. Liquidity, execution quality, price structure, and a clear invalidation level should still determine whether an earnings mover is worth trading.
Q3 Earnings-Season Checklist for Active Traders
A simple earnings-season checklist can keep preparation focused on three things: confirming the event, evaluating the reaction, and defining the trade before taking risk.
Before the Report
- Confirm the earnings date and release time
- Check whether the date is confirmed or estimated
- Review previous earnings reactions
- Mark important daily levels
- Identify relevant sector peers
After the Report
- Review the results and forward guidance
- Measure the earnings gap
- Check liquidity and relative volume
- Mark after-hours and premarket highs and lows
- Evaluate the move using the Earnings Reaction Scorecard
Before Entering
- Identify the setup
- Define what confirms it
- Set a clear invalidation level
- Check the spread and execution risk
- Define the maximum acceptable loss
If those points are not clear, the stock may belong on the watchlist rather than in a trade.
Conclusion: Use Earnings Season to Narrow Decisions, Not Create More Noise
Q3 earnings season generally begins in October, but knowing the calendar is only the starting point. Active traders still need to identify which reports create tradeable movement and which stocks have enough liquidity, participation, and structure to justify attention.
A repeatable process makes that easier.
Confirm the catalyst. Measure the gap in context. Check relative volume. Mark meaningful levels. Then watch whether the market accepts or rejects the new post-earnings price.
Most importantly, do not assume every earnings mover needs to become a trade.
The goal is to move from a crowded earnings calendar to a short list of stocks where the catalyst, liquidity, volume, price action, and risk all line up with your strategy.
Put Your Earnings Watchlist Into Action
Scan the market in real time for the gaps, volume, and price movement that fit the way you trade.
Frequently Asked Questions
What is an earnings pre-announcement?
An earnings pre-announcement is an update released before the scheduled earnings report that changes or clarifies expectations for revenue, profit, guidance, or another important metric. It can move a stock immediately and change the setup before the official report arrives.
What is a whisper number in earnings?
A whisper number is an unofficial earnings expectation that may differ from the published analyst consensus. Traders sometimes use it to explain why a company can beat the official estimate yet still disappoint a market that expected an even stronger result.
Can a company change its earnings date after announcing it?
Yes. Companies can reschedule earnings releases or conference calls, although confirmed dates are generally more reliable than estimated calendar dates. Traders should recheck the company’s investor-relations page as the report approaches instead of relying on an old watchlist entry.
Do ETFs have an earnings season?
ETFs do not report quarterly operating earnings like individual companies because they hold portfolios of securities rather than operate as businesses. However, an ETF can move sharply when several large holdings report, making sector and index ETFs useful for tracking broader earnings reactions.
What is post-earnings announcement drift?
Post-earnings announcement drift, often called PEAD, describes the tendency for some stocks to continue moving in the direction of an earnings surprise after the initial reaction. It is a researched market phenomenon, but it does not occur after every report.