
15-Minute Chart Trading Strategy: How to Use the 10 SMA and 130 SMA
15-Minute Chart Trading Strategy: How to Use the 10 SMA and 130 SMA
A 15-minute chart trading strategy does not need dozens of indicators to provide useful market context. For active traders, combining a short-term and longer-term simple moving average can create a cleaner way to assess momentum, trend direction, and potential areas of support or resistance.
One practical setup uses the 10 SMA and 130 SMA on a 15-minute chart. The 10-period SMA reacts more quickly to recent price movement, while the 130-period SMA provides a broader view of the short-term trend.
Before using any moving average strategy, traders should understand how price structure, volume, trends, and support and resistance work together.
| Quick Answer: How Does the 10 SMA and 130 SMA Strategy Work?On a 15-minute chart, the 10 SMA reflects approximately 2.5 hours of recent price activity, while the 130 SMA represents about five regular U.S. trading sessions. Traders can compare price with both averages to evaluate momentum, trend direction, and potential dynamic support or resistance. |
| Find the setup before analyzing the chart. Real-time stock scanners |
How Does a 15-Minute Chart Work for Day Trading?
A 15-minute chart divides market activity into 15-minute intervals. Each candlestick typically represents the open, high, low, and close during that period.
The NYSE core trading session runs from 9:30 a.m. to 4:00 p.m. ET, giving traders 6.5 hours of regular-session price activity each trading day. A standard U.S. stock market session lasts 6.5 hours. That produces approximately:
6.5 hours × 4 candles per hour = 26 fifteen-minute candles
This gives traders more intraday detail than an hourly or daily chart while filtering some of the rapid fluctuations visible on one-minute and five-minute charts.
A 15-minute day trading chart can help traders monitor:
- Intraday trends
- Momentum
- Pullbacks
- Breakouts
- Price action
- Support and resistance
- Volume confirmation
There is no universally best timeframe for day trading. Shorter charts provide faster signals but can create more noise, while longer timeframes offer greater context but react more slowly.
The 15-minute timeframe can provide a useful middle ground for traders who want to follow intraday price action without reacting to every minor fluctuation.
What Do the 10 SMA and 130 SMA Show?
A simple moving average, or SMA, calculates the average closing price over a specified number of chart periods.
A simple moving average gives equal weighting to each period in the calculation. Shorter SMAs generally respond faster to price movement, while longer SMAs create a smoother view of the underlying trend.
What Is the 10 SMA?
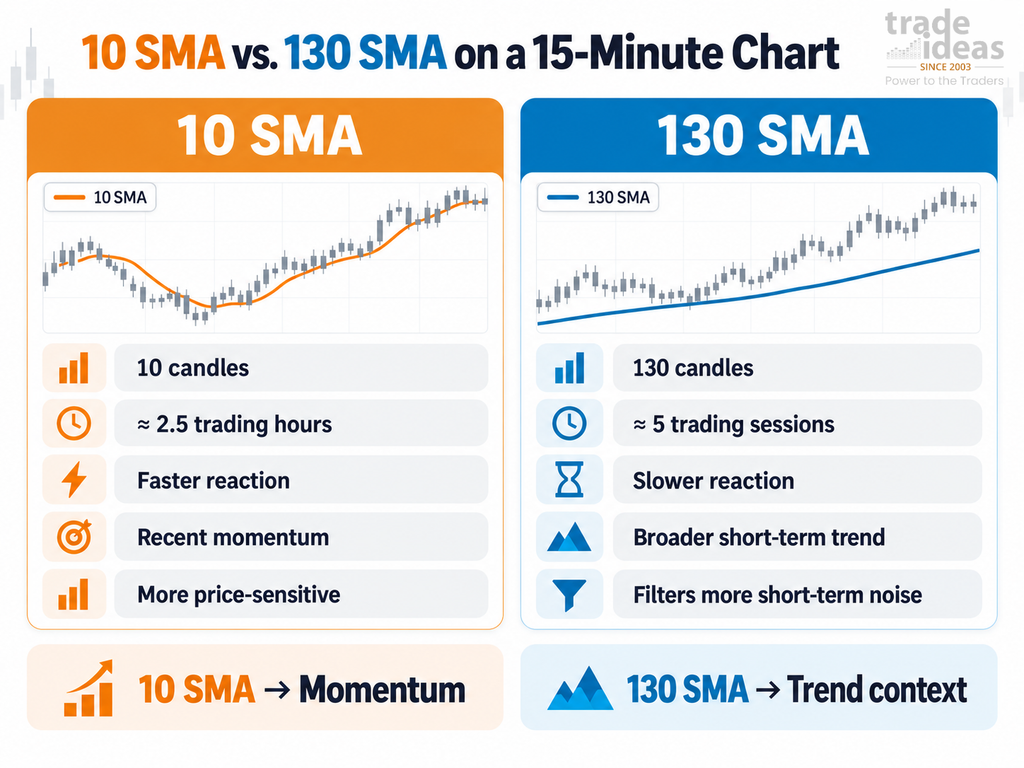
The 10 SMA calculates the average closing price of the previous 10 candles.
On a 15-minute chart:
10 periods × 15 minutes = 150 minutes
That equals approximately 2.5 hours of trading activity.
Because it contains fewer periods, the 10 SMA reacts relatively quickly to changes in price. Traders can use it as a short-term momentum reference.
For example, price holding above a rising 10 SMA may indicate stronger short-term momentum than price repeatedly crossing above and below a flat average.
What Is the 130 SMA?
The 130 SMA offers broader context.
There are approximately 26 fifteen-minute candles during a regular U.S. trading session.
Therefore:
26 candles × 5 sessions = 130 candles
The 130 SMA on a regular-session 15-minute chart represents approximately five trading sessions, or 32.5 market hours.
This distinction is important: the 10 SMA is a 10-period moving average, not a 10-day moving average.
Moving averages are lagging indicators. They summarize historical price behavior rather than predict future prices.
Reading the 10 SMA and 130 SMA on a 15-Minute Chart
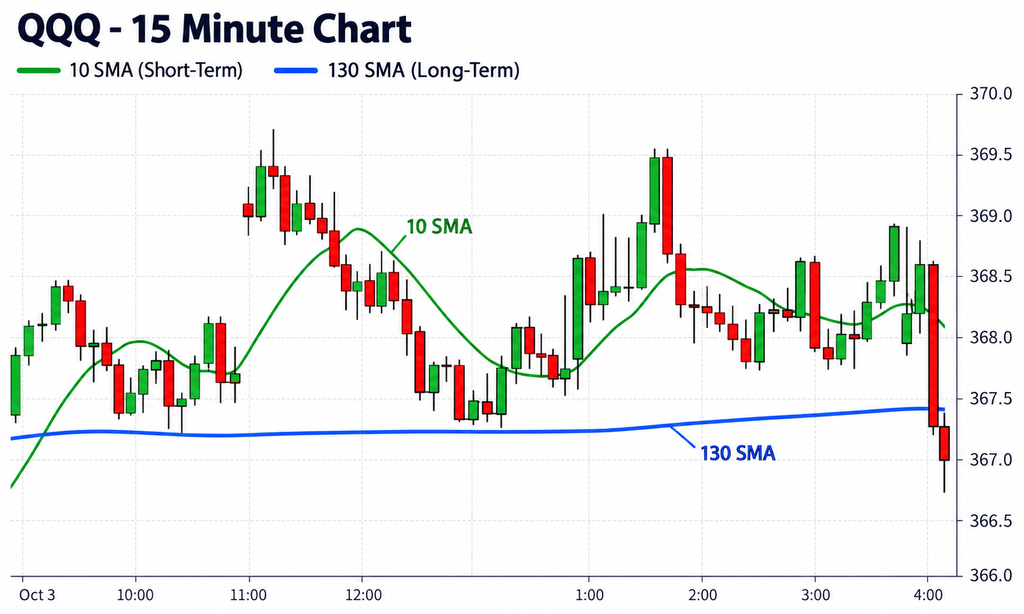
The chart above uses the Nasdaq-100 ETF (QQQ) to show how the 10 SMA and 130 SMA behave on a 15-minute timeframe.
The green 10 SMA follows recent price movement more closely and represents approximately 2.5 hours of trading activity. This makes it useful for observing short-term momentum and changes in intraday direction.
The blue 130 SMA moves more gradually because it represents approximately five regular U.S. trading sessions on a 15-minute chart. Traders can use it as a broader trend reference and monitor how price reacts when approaching or moving through the average.
In this example, price eventually moves below the 130 SMA after spending much of the session above it. Rather than treating the break as an automatic sell signal, traders can use it as an indication that the previous support area has weakened and then look to price structure, volume, and momentum for additional confirmation.
Key takeaway: The 10 SMA helps track recent momentum, while the 130 SMA provides broader short-term trend context. Using both together can make a 15-minute chart easier to interpret without overcrowding it with indicators.
How to Use the 10 SMA and 130 SMA Trading Strategy
The objective of this SMA trading strategy is not to buy or sell automatically whenever price crosses a moving average.
Instead, the two averages provide a framework for reading the chart.
1. Identify the Broader Trend
Start with the 130 SMA.
Price consistently trading above a rising 130 SMA may indicate stronger short-term trend conditions. Price remaining below a declining 130 SMA may signal weaker conditions.
Then look at the actual price structure.
Is the stock producing higher highs and higher lows? Or are lower highs and lower lows developing?
2. Use the 10 SMA to Track Momentum
The 10 SMA provides a faster view of current price behavior.
During an established uptrend, a controlled pullback toward a rising 10 SMA may show whether buyers remain active.
During a downtrend, a recovery toward a declining 10 SMA may help traders evaluate whether sellers still control the shorter-term move.
The SMA touch itself should not be treated as an automatic entry.
3. Watch for Moving Average Support and Resistance
Moving averages can sometimes behave as dynamic support and resistance because their values continuously change as new prices enter the calculation.
During an uptrend, price may repeatedly react around a rising moving average.
During a downtrend, rallies may struggle around a declining average.
But an SMA is better viewed as an area of interest, not an exact level where price must reverse.
Moving averages can also produce misleading signals in sideways or choppy markets, which is why they are better evaluated alongside price structure, volume, and broader market context.
Bullish 15-Minute Chart Example
Consider a stock trading above a rising 130 SMA.
The 10 SMA is also rising, but price temporarily pulls back toward it.
Rather than entering solely because price touches the average, look for additional confirmation:
- Price remains above the 130 SMA
- Higher lows remain intact
- The pullback holds around support
- The 10 SMA continues rising
- Volume increases as momentum returns
- Price challenges or breaks a recent intraday high
The combination provides more context than a moving average crossover alone.
Bearish 15-Minute Chart Example
Now reverse the conditions.
Price remains below a declining 130 SMA while the 10 SMA also slopes lower. A short recovery pushes price toward the faster average but fails to form a meaningful higher high.
If resistance develops and selling pressure returns, the moving averages can help confirm the broader bearish context.
The averages did not predict the decline. They helped organize the price information already visible on the chart.
How to Confirm an Intraday Trading Setup
A moving average strategy for day trading becomes stronger when the trader considers more than the two indicators.
Check Price Structure
Moving averages should make sense relative to the underlying chart.
Higher highs and higher lows typically support bullish trend analysis, while lower highs and lower lows provide bearish context.
Check Volume
Volume shows whether participation supports the move.
A breakout accompanied by increased volume provides different information from a brief price move occurring with weak participation.
Check Key Price Levels
Look for previous intraday highs, lows, consolidation zones, and areas where price repeatedly reacted.
A moving average lining up with an established price level may be more meaningful than an isolated SMA touch.
Different technical signals can provide stronger context when evaluated together rather than in isolation. Trend, momentum, breakouts, volume, and moving averages can each contribute different information to the setup.
How Should Traders Manage Risk on a 15-Minute Setup?
No 15-minute trading strategy eliminates market risk.
Before considering a position, define what would invalidate the original setup. This might be a break below support, failure to maintain the expected price structure, or another clearly established technical condition.
Risk planning can include:
- Entry criteria
- Invalidation level
- Stop placement
- Position size
- Liquidity
- Volatility
- Maximum acceptable loss
- Expected reward relative to risk
This is particularly important with day trading. FINRA’s 2024 review of day-trading requirements highlights that day trading can involve substantial risk and may not be appropriate for investors with limited resources, trading experience, or risk tolerance. FINRA also notes that day trading on margin can result in losses beyond an investor’s initial investment, reinforcing the importance of disciplined risk management, appropriate position sizing, and realistic expectations.
What Does Research Say About 15-Minute Technical Trading?
Researchers have evaluated moving-average and other technical trading rules across different markets and timeframes, but no research establishes a single best moving average for a 15-minute chart.
One published study specifically examined whether trading frequency matters for intraday technical strategies and evaluated moving-average and RSI rules at multiple frequencies, including 15-minute intervals. Its results varied by rule, parameters, and market tested.
For traders, that supports testing a trading idea rather than assuming one SMA combination will work consistently in every condition.
How Scanning and Backtesting Fit Into the Trading Workflow
Even a well-defined intraday trading strategy has a practical challenge: finding stocks worth reviewing.
Manually opening hundreds of charts to look for momentum, unusual volume, or technical setups can be inefficient. A stock scanner can continuously monitor the market and surface stocks matching predefined conditions, allowing traders to focus their chart analysis on a smaller group of candidates.
A simple workflow is:
Scan the market → Shortlist stocks → Open the 15-minute chart → Review the 10 SMA and 130 SMA → Confirm price action and volume → Define risk
Strategies should also be evaluated beyond a handful of favorable chart examples. Backtesting tools can help traders test defined rules against historical market data and review metrics such as win rate, profit factor, average winners and losers, and equity-curve behavior.
Backtesting cannot guarantee future performance, but it can show how consistently a defined strategy behaved under past market conditions.
Final Thoughts
A useful 15-minute chart trading strategy should make the chart easier to interpret, not more complicated.
The 10 SMA provides a fast view of recent momentum, while the 130 SMA adds broader short-term trend context. Together, they can help traders evaluate pullbacks, trend direction, and potential moving average support and resistance.
Their value comes from combining them with price action, volume, market structure, confirmation, and risk management rather than treating either indicator as an automatic trading signal.
Make the process repeatable. Combining market scanning, 15-minute chart analysis, confirmation, risk planning, and backtesting can help traders spend less time searching symbol by symbol and more time evaluating setups against consistent criteria.
FAQs About the 15-Minute Chart Trading Strategy
Is a 15-minute chart good for day trading?
A 15-minute chart can be useful for day trading because it provides enough detail to identify intraday trends, pullbacks, and key price levels while filtering some of the noise found on shorter charts. Its suitability depends on the trader’s strategy, holding period, and risk tolerance.
What is the best moving average for a 15-minute chart?
There is no universally best moving average for a 15-minute chart. Shorter averages react faster to price changes, while longer averages provide smoother trend context. Traders should choose moving-average periods according to whether they are tracking momentum, pullbacks, or broader intraday trends.
Is EMA or SMA better for a 15-minute chart?
Neither EMA nor SMA is automatically better. An EMA gives greater weight to recent prices and therefore reacts faster, while an SMA weights each period equally and generally moves more smoothly. The better choice depends on how quickly a trader wants the indicator to respond to price changes.
Do moving averages work in sideways markets?
Moving averages are generally less reliable in sideways markets because price can repeatedly cross above and below them without establishing a clear trend. These frequent crossings can create false signals or whipsaws, making price structure, volume, support and resistance, and broader market conditions especially important.
How many candles are in a 15-minute trading day?
For U.S. stocks, a regular trading session lasts 6.5 hours, which equals about 26 fifteen-minute candles. This calculation helps traders understand how moving averages such as the 130 SMA relate to several days of intraday price activity.