
Best Low-Float Stock Screeners in 2026: AI-Assisted Tools for Momentum Traders
Best Low-Float Stock Screeners in 2026: AI-Assisted Tools for Momentum Traders

Low-float stocks can go from quiet to extremely active in minutes. The challenge is not finding stocks with a small float; it is separating the ones attracting meaningful demand from hundreds of thin, inactive names.
A useful low-float stocks screener should do more than filter by share count. Momentum traders need float data alongside volume, relative volume, price movement, liquidity, catalysts, and real-time triggers.
This guide compares five screeners suited to that workflow, explains where each fits, and shows how to build scans that surface activity instead of noise.
Best Low-Float Stock Screeners at a Glance
| Screener | Best For | Float Filtering | Real-Time Scanning | AI Assistance | Standout Strength |
| Trade Ideas | Active momentum traders | Yes | Yes | Yes | Real-time alerts combined with configurable scanning and AI signals |
| Scanz | Low-float and premarket scanning | Yes | Yes | Limited | Fast multi-filter scanning built around active trading |
| TradingView | Chart-first traders | Yes | Yes | Yes | Screening integrated closely with technical charts |
| TrendSpider | Technical and strategy-driven scanning | Fundamental criteria available | Yes | Yes | Multi-factor and AI-built technical scans |
| Finviz | Straightforward browser-based screening | Yes | Limited compared with streaming scanners | No core AI screening workflow | Simple float, volume, relative-volume, and technical filters |
There is no single scanner configuration that suits every momentum trader. The practical difference comes down to whether you need a static candidate list, continuously updating alerts, detailed chart analysis, or AI-assisted opportunity discovery.
What Makes a Good Low-Float Screener for Momentum Trading?
Float tells you how many shares are available for public trading. It does not tell you whether traders currently care about the stock.
That distinction matters.
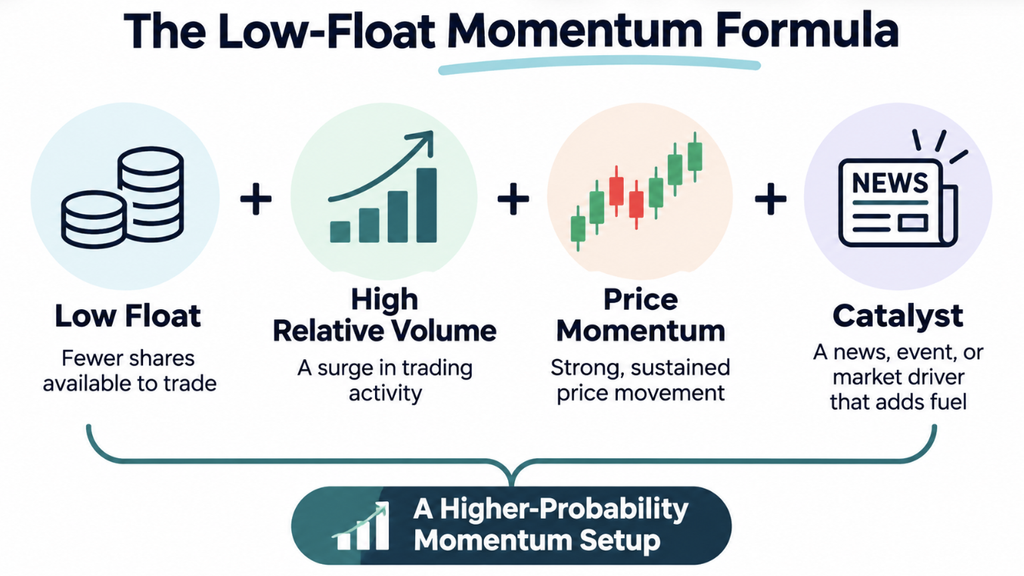
A stock’s public float represents the shares available for trading, excluding restricted shares and certain closely held positions. However, a smaller stock float alone does not indicate a momentum opportunity. Traders also need to consider volume, liquidity, price movement, and potential catalysts to identify stocks showing meaningful market activity.
A strong low float screener should therefore help evaluate several conditions together.
Reliable Float Data
A low-float strategy starts with the correct metric.
Shares outstanding represent the company’s issued shares held by shareholders. Public float attempts to measure the portion that can actually trade freely in the open market.
The difference can be substantial.
Float estimates can also differ among data providers because holdings change and providers may classify restricted or closely held shares differently. For strategies where a few million shares can materially change the setup, data quality and update frequency matter.
Volume and Relative Volume
Low float creates the supply condition. Volume shows whether demand is appearing.
A stock with a 4 million-share float and almost no current trading activity may offer little to a momentum trader. A stock with the same float trading several times its normal volume presents a very different situation.
That is why searches for high-volume, low-float stocks are more actionable than simply filtering for the smallest floats available.
Price and Momentum Conditions
Useful filters can include:
- percentage change
- gap percentage
- new highs
- opening-range breaks
- VWAP relationships
- price acceleration
- intraday breakouts
- proximity to premarket highs
These help distinguish a stock that merely has a low float from one experiencing active price discovery.
Liquidity and Spread
Low float does not automatically mean good liquidity.
Thin order books may produce wide spreads, sudden gaps, slippage, and difficult exits. The SEC notes that securities with low trading volume can experience large percentage price changes from relatively modest trades, one reason smaller and microcap securities can carry elevated risk.
For momentum traders, volume and spread belong beside float—not after it.
Real-Time Alerts
A conventional screener answers:
Which stocks meet these conditions now?
A scanner adds another layer:
Tell me when a stock starts meeting these conditions.
For fast-moving low-float names, that difference can be significant. A low float scanner that continuously monitors changing conditions can identify volume expansion or technical triggers without repeatedly refreshing a static results table.
Best Low-Float Stock Screeners in 2026
1. Trade Ideas — Real-Time and AI-Assisted Momentum Scanning
Best suited for: Active traders who want granular rule-based scanning alongside AI-generated opportunity discovery.
Trade Ideas approaches scanning as a real-time workflow rather than a one-time database query. Traders can combine stock characteristics and live market behavior across customizable scanners, screeners, charts, alerts, and watchlists.
Current Core plans include real-time data, customizable scans and screeners, price alerts, paper trading, and more than 500 available data points across alerts and filters. Apex adds AI signals, backtesting, smart risk levels, additional strategy windows, and automated trading capabilities.
For low-float momentum trading, the useful part is not float filtering by itself. It is the ability to combine a float universe with live conditions such as unusual activity, price movement, new highs, or other measurable events.
A trader might start with:
- a defined maximum float;
- minimum price and volume requirements;
- elevated relative volume;
- meaningful percentage movement;
- a technical or price trigger.
That creates a much narrower list than sorting the market by float alone.
Trade Ideas’ scanner-first watchlist workflow follows a similar principle: define measurable criteria first, reduce the market to a focused candidate list, then review the chart and catalyst before making a trading decision.
Holly AI provides a second discovery layer. Rather than replacing manual scanner rules, AI-generated signals can surface strategy-driven opportunities that traders may not already have specified themselves.
Where it fits: Traders who value real-time event detection and want custom scanners, AI signals, testing, chart review, and execution tools within one environment.
| Find the Move Without Watching Every TickerTurn your float, volume, and momentum criteria into a live scanning workflow instead of manually searching for active names.Start Free With Trade Ideas |
2. Scanz — Fast Multi-Filter Scanning for Active Traders
Best suited for: Traders whose workflow centers heavily on premarket movers, float, volume, and short-term momentum.
Scanz offers a real-time scanner with more than 65 filters spanning price, volume, momentum, float size, technical conditions, and other data. Its documentation says scanner results update every 500 milliseconds.
That combination makes it particularly relevant to traders who already know the low-float setup they want to find.
A scan might combine:
- float below a chosen threshold;
- minimum relative volume;
- premarket percentage change;
- price range;
- current volume.
This structure is useful because it avoids treating low float as the signal itself.
Where it fits: Traders who want a fast, dedicated scanning environment and regularly build precise multi-condition momentum scans.
Limitation to consider: Traders who specifically want an integrated AI signal layer should compare that requirement separately from Scanz’s rule-based scanning strengths.
3. TradingView — Strong for Screening and Chart-Based Confirmation
Best suited for: Traders who want screening to transition directly into detailed chart analysis.
TradingView’s Stock Screener supports market, fundamental, technical, volume, gap, and performance criteria. It also provides free-float data, relative volume, extended-hours information, customizable screens, and chart-based workflows.
For low-float traders, this makes TradingView useful when identifying the stock is only the beginning of the process.
You could screen a float range and then use the platform’s charting environment to inspect:
- intraday structure;
- resistance levels;
- volume behavior;
- moving averages;
- VWAP or custom indicators;
- previous highs and lows.
TradingView has also introduced an AI Screener in public beta that converts natural-language requests into screener filters, columns, and sorting.
Where it fits: Traders who spend significant time validating screened candidates through charts and technical indicators.
Limitation to consider: A trader looking primarily for a dedicated streaming momentum-alert environment may prefer a scanner designed specifically around event-driven discovery.
4. TrendSpider — AI-Built and Multi-Factor Technical Scanning
Best suited for: Traders who want to encode more complex technical conditions or combine multiple timeframes.
TrendSpider’s Market Scanner supports price, indicators, chart and candlestick patterns, fundamental data, relative performance, news, earnings, and other conditions. More than 70 built-in scans are available, and users can create scanners through either a point-and-click editor or natural-language AI.
Its biggest relevance to low-float momentum traders comes after the initial universe is established.
For example, a trader could look for candidates that also show:
- a volume surge;
- a breakout pattern;
- a defined indicator condition;
- relevant news;
- alignment across multiple timeframes.
TrendSpider can also turn scan results into dynamic watchlists and use extended-hours data.
Where it fits: Technically oriented traders who prioritize pattern recognition, multi-factor conditions, AI-assisted scanner creation, and multi-timeframe analysis.
Limitation to consider: Traders should verify that the exact float dataset and thresholds they require are supported in their intended workflow before choosing it primarily for low-float discovery.
5. Finviz — Straightforward Low-Float Filtering in the Browser
Best suited for: Traders who want a simple way to narrow the market before doing deeper analysis elsewhere.
Finviz provides dedicated Float filtering alongside average volume, current volume, relative volume, price, gaps, volatility, technical signals, and other criteria.
That makes it practical for straightforward searches such as:
- low float;
- minimum current volume;
- high relative volume;
- defined price range;
- positive percentage change.
Its interface is relatively easy to understand, making it useful for traders who do not need an elaborate scanning environment.
Where it fits: Building quick candidate lists and performing initial market filtering.
Limitation to consider: Traders whose strategy depends on continuous event-driven scanning, highly configurable alerts, or an integrated AI opportunity engine may need a more specialized platform.
Low-Float Stock Screener Comparison
The best tool depends less on the number of features advertised and more on the workflow you need to execute.
| Need | Trade Ideas | Scanz | TradingView | TrendSpider | Finviz |
| Float-based filtering | Strong | Strong | Strong | Verify exact workflow | Strong |
| Volume/RVOL analysis | Strong | Strong | Strong | Strong | Strong |
| Real-time momentum discovery | Strong | Strong | Strong | Strong | More screening-oriented |
| Premarket workflow | Strong | Strong | Strong | Supported | Available |
| Advanced charting | Strong | Moderate | Strong | Strong | Moderate |
| AI-assisted discovery/building | Strong | Limited | Available | Strong | Limited |
| Backtesting/strategy testing | Available | More limited | Strategy-dependent | Available | Not a core strength |
| Best fit | Active scanning + AI | Dedicated active scanning | Chart-first traders | Technical automation | Quick browser screening |
The table should be treated as a workflow comparison, not a substitute for checking current plan-specific functionality before subscribing.
How to Build a Low-Float Momentum Scanner
A useful scan is built in layers. Starting with every low-float stock and then trying to inspect each chart defeats the purpose of using a scanner.
1. Define the Float Range
There is no universal number at which a stock officially becomes “low float.”
Momentum traders may screen below:
- 20 million shares;
- 10 million shares;
- 5 million shares;
- or even lower for highly specialized strategies.
A tighter threshold creates a smaller universe but may also expose the trader to thinner liquidity and sharper volatility.
The objective is not to find the lowest float possible. It is to establish a tradable universe that fits the strategy.
2. Remove Inactive Stocks With Volume Filters
This is where the scan starts becoming useful.
Suppose two companies both have a 7 million-share float.
Stock A has traded 30,000 shares today.
Stock B has traded 2 million shares and is running far above its typical activity.
Their float is identical, but their relevance to a momentum trader is not.
Set a minimum liquidity threshold appropriate for the stocks and position sizes you trade.
3. Add Relative Volume
Absolute volume tells you how many shares traded. Relative volume provides context by comparing that activity with what is normal for the stock.
This can help a trader distinguish ordinary trading from unusual participation.
It is also why a low float high volume scanner can be more useful than a float-only screen: it asks whether limited share supply and abnormal trading demand are appearing together.
4. Add a Price or Momentum Condition
Next, determine what the stock needs to be doing.
Possible filters include:
- up a minimum percentage;
- gapping above the previous close;
- approaching or breaking the premarket high;
- making a new intraday high;
- crossing above resistance;
- reclaiming VWAP;
- accelerating over a defined interval.
The exact trigger should reflect the setup being traded.
5. Check the Catalyst and Structure
Numbers can identify abnormal activity. They cannot explain all of it.
Earnings, regulatory news, financing, clinical results, contracts, mergers, analyst actions, or sector developments can all change how traders interpret a move.
Trade Ideas’ breakdown of volatile premarket scanner conditions emphasizes the same combination of relative volume, catalysts, low float, and technical levels rather than relying on one input.
The chart still matters too. A stock pressing through a meaningful level presents different conditions from one already far above every nearby reference point.
Three Low-Float Scanner Setups Worth Testing
These are starting frameworks, not automatic entry signals. Thresholds should be adapted to the trader’s strategy, risk tolerance, and market conditions.
Low Float + High Relative Volume
Purpose: Find low-supply stocks receiving substantially more participation than usual.
Possible structure:
- float below your chosen threshold;
- minimum stock price;
- minimum current volume;
- elevated relative volume;
- positive intraday change.
This scan can be useful for finding activity early without limiting the search to stocks already at the top of the gainers list.
Low Float + Premarket Gap + Volume
Purpose: Build a focused premarket watchlist.
Possible structure:
- defined maximum float;
- minimum premarket gap;
- minimum premarket volume;
- acceptable price range;
- catalyst review.
The output should be treated as a watchlist. After the open, some gappers continue while others immediately lose participation.
Low Float + Breakout Trigger
Purpose: Wait for structure instead of chasing every percentage mover.
Possible structure:
- low float;
- sufficient relative volume;
- price near a key high;
- breakout or new-high trigger;
- acceptable spread and liquidity.
This configuration moves the scanner closer to event detection: the stock does not appear simply because it is low float; it appears when a technical condition joins the float-and-volume setup.
Why Low Float Alone Is a Weak Momentum Signal
A small public float can make a stock more sensitive to shifts in supply and demand. It does not tell you which direction the stock will move—or whether meaningful demand exists at all.
Low float by itself cannot confirm:
- increasing participation;
- a catalyst;
- directional momentum;
- adequate liquidity;
- technical structure;
- acceptable spread;
- whether the move is already extended.
FINRA similarly warns that low-priced and thinly traded stocks may be vulnerable to manipulation, limited public information, and abrupt price changes.
For a momentum workflow, float should therefore be treated as one layer of the setup.
Float defines supply. Volume demonstrates participation. Price action shows what that participation is doing.
Low Float vs. Shares Outstanding
These metrics are related but not interchangeable.
Shares outstanding represent the company’s issued shares held by shareholders.
Public float attempts to measure the shares actually available for public trading after excluding restricted shares and certain closely held positions.
Consider a company with:
- 50 million shares outstanding;
- 35 million shares held by insiders or otherwise restricted;
- 15 million shares available to the public.
Its shares outstanding are 50 million, but its float is approximately 15 million under that simplified example.
This distinction becomes important when scanner platforms label fields differently. A “shares” filter is not automatically a float filter.
When float is central to a strategy, confirm exactly what the platform measures rather than assuming similarly named fields represent the same dataset.
Static Low-Float Screener vs. Real-Time Low-Float Scanner
The terms are often used interchangeably, but the distinction is useful.
A traditional screener might answer:
Which stocks currently have fewer than 10 million shares in float, trade between $2 and $20, and have relative volume above 2?
That produces a list.
A real-time scanner can instead monitor the market and alert when a qualifying stock breaks its premarket high, experiences a volume surge, or reaches another defined condition.
For momentum trading, both can have a role.
Use the screener to define the universe.
Use the scanner to detect change inside that universe.
Then use charts, news, liquidity, and risk parameters to determine whether the alert deserves further attention.
How AI Is Changing Low-Float Scanning in 2026
Traditional scanners are deterministic.
You tell them:
Float below X + relative volume above Y + price change above Z.
They return matching stocks.
AI-assisted tools add another layer. Depending on the platform, AI can help translate natural-language ideas into scanner conditions, evaluate strategy-driven setups, prioritize opportunities, or reduce the time spent manually configuring complex criteria.
The key distinction is that AI does not make float, volume, liquidity, or price structure irrelevant.
It still needs market data.
Trade Ideas, for example, combines traditional customizable scanners with AI-generated trading signals rather than requiring traders to choose one approach. Its current feature set also includes historical scanning and backtesting tools for evaluating defined strategies.
This hybrid model can be useful because traders sometimes know exactly what they want to scan for—and sometimes want another system to surface conditions they did not explicitly request.
A practical 2026 workflow can therefore look like:
Rule-based scan → AI-assisted discovery → chart/catalyst review → risk decision
rather than:
AI signal → automatic assumption that the trade is valid.
Turn Scanner Results Into a Focused Watchlist
The scanner’s job is to reduce the universe, not fill the screen with dozens of blinking symbols.
Once candidates appear, ask:
- Why is this stock moving?
- Is volume meaningfully abnormal?
- Is the spread workable?
- Is the chart structure clear?
- Where would the setup become invalid?
- Has the stock already extended far beyond the level that produced the alert?
A focused list of three to five relevant candidates can be more manageable than trying to monitor every low-float mover simultaneously.
Traders using Trade Ideas can connect this process with real-time scans, alerts, watchlists, charts, and trading tools instead of repeatedly rebuilding the same search during the session.
| Build a Scanner Around Your Setup, Not the HypeCombine real-time market data with customizable scanning—and add AI signals or backtesting when your workflow requires them.Compare Trade Ideas Plans |
Common Low-Float Screening Mistakes
Screening Only by Float
A tiny float without volume may simply produce a thin, inactive stock. Add participation and liquidity criteria before assuming it belongs on the watchlist.
Confusing Float With Shares Outstanding
Always check which dataset the scanner uses. The difference can materially change which symbols pass a strict float threshold.
Ignoring the Spread
A strong-looking percentage move does not guarantee clean execution. Wide bid-ask spreads can materially alter entry prices, exits, stops, and realized risk.
Adding Too Many Filters
More precision is not always better.
If ten overlapping conditions produce no results, the scanner is not necessarily protecting you from bad trades; it may simply be overfitted.
Start with the conditions that define the setup, then add filters only when they remove a specific type of unwanted result.
Treating Scanner Alerts as Buy Signals
A scanner tells you that defined conditions occurred.
It does not know whether the spread suddenly widened, the catalyst changed, the breakout failed, or the trade exceeds your planned risk.
Use the scanner for discovery. Keep the trade decision separate.
Choosing the Right Low-Float Stock Screener
Choose based on the part of the workflow you need to improve.
If the priority is real-time, highly customizable scanning with an additional AI discovery layer, Trade Ideas fits that workflow closely.
If you primarily want fast rule-based float and momentum filters, Scanz deserves consideration.
If chart analysis is central to every screening decision, TradingView provides a strong screening-to-chart workflow.
If you want to create complex technical scans with AI and multi-timeframe conditions, TrendSpider is built around that type of automation.
If you mainly need a straightforward browser-based screen for float, volume, relative volume, and price, Finviz keeps the process simple.
The bigger decision, however, is not which platform has the longest feature list. It is whether the scanner can consistently reduce the market to candidates that match the setup you actually trade.
Conclusion: Screen for Participation, Not Just a Small Float
A low float identifies limited tradable supply. It does not identify momentum by itself.
The more useful scanning process combines float with volume, relative volume, price action, liquidity, and a defined trigger. That turns a broad low-float list into a smaller group of stocks showing conditions relevant to active trading.
AI-assisted platforms can further reduce manual work by helping create scans or surface strategy-driven opportunities, but the final assessment still depends on chart structure, catalysts, execution conditions, and risk.
For momentum traders, the best scanner is therefore the one that helps answer a more useful question than “Which stocks have a low float?”
It should help answer:
“Which low-float stocks are becoming unusually active right now, and why are they worth examining?”
Frequently Asked Questions
Can a stock’s float change after I add it to my watchlist?
Yes. Offerings, insider sales, lockup expirations, buybacks, conversions, and other corporate actions can change the tradable share count. If float materially affects your setup, verify current data rather than relying indefinitely on an old watchlist value.
Where can traders verify a company’s float independently?
Check recent SEC filings such as 10-Ks, 10-Qs, registration statements, and prospectuses alongside reputable market-data sources. Filings may provide share and ownership information, although calculating true tradable float can require interpreting restricted and closely held positions.
Does high short interest make a low-float stock more likely to squeeze?
Not automatically. Short interest can add buying pressure when short sellers cover, but a squeeze still depends on factors such as demand, liquidity, borrow availability, catalysts, price action, and how much short positioning actually exists relative to tradable shares.
Why do reverse splits appear frequently among low-float momentum stocks?
A reverse split reduces the number of shares outstanding while proportionally increasing the share price. It can leave a company with fewer tradable shares, but traders should also investigate the company’s financing history and any subsequent share issuance.
Why can trading be halted in a fast-moving low-float stock?
U.S. exchanges can trigger volatility pauses when price moves outside specified bands, while regulatory or news-pending halts may occur for other reasons. A halt can materially change execution because the reopening price may differ sharply from the pre-halt price.