
What Causes Market Volatility? Key Trends Every Active Trader Should Watch
What Causes Market Volatility? Key Trends Every Active Trader Should Watch
A quiet market can turn fast. A stock gaps on earnings, an inflation report changes rate expectations, or breaking news suddenly sends an entire sector moving. For active traders, knowing that volatility increased is only the beginning.
The real questions are: What caused the move? Is it market-wide or stock-specific? Is participation supporting it? And has the risk changed?
This guide explains what causes market volatility, how to recognize meaningful changes in trading conditions, and which signals can help active traders separate structured movement from noise.
Find the Stocks Showing Unusual Activity
When markets start moving quickly, real-time scanning can help narrow thousands of stocks to the ones matching your volume, momentum, price, and liquidity criteria.
What Causes Market Volatility?
| Quick answer:Market volatility increases when new information, changing expectations, or imbalances between buyers and sellers cause prices to move faster or further than usual. Economic data, Fed decisions, earnings, geopolitical events, sentiment, liquidity, and positioning can all contribute. |
But listing the causes doesn’t fully explain why volatility happens.
Think of the market as a continuous auction. Buyers have a price they are willing to pay, sellers have a price they will accept, and both sides constantly reassess those prices as conditions change.
When participants broadly agree about an asset’s value and outlook, price can move relatively smoothly. When uncertainty increases, those opinions spread further apart. Traders reposition, orders hit the market faster, and prices may need to travel further to find the next willing buyer or seller.
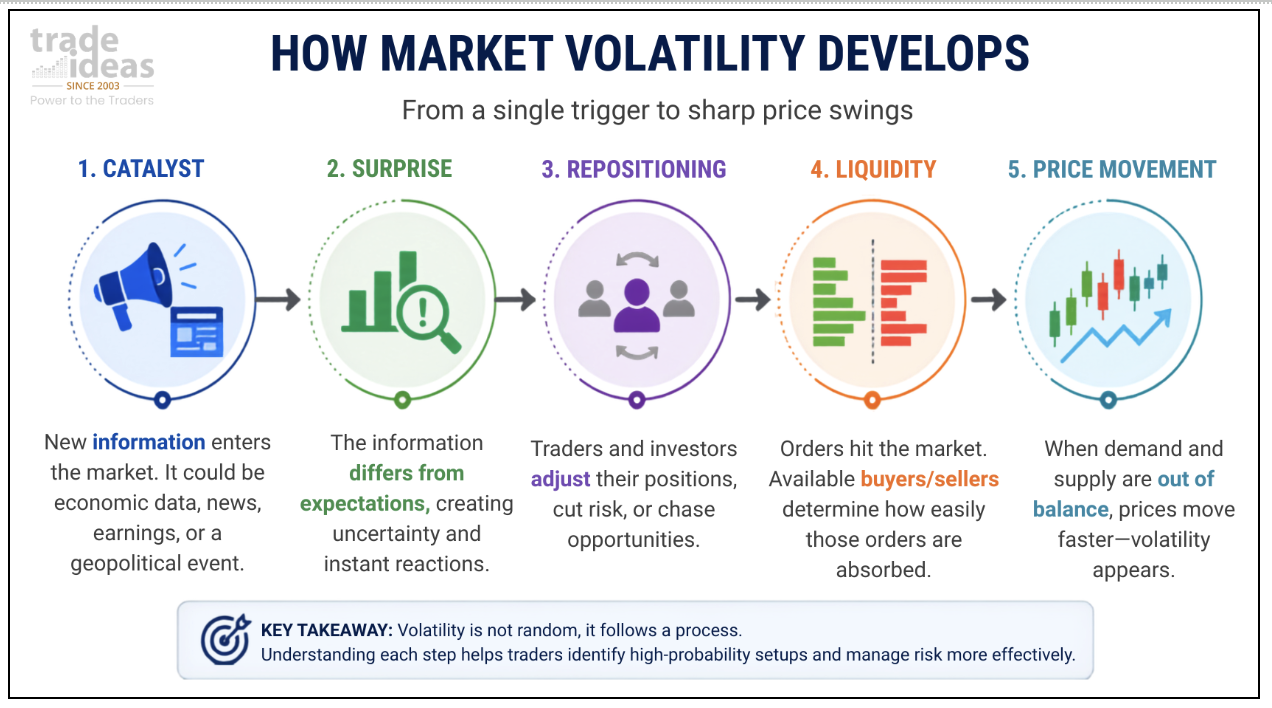
A useful way to think about the process is:
Catalyst → Surprise → Repositioning → Liquidity → Price movement
Why Do Some Market Events Cause Bigger Moves Than Others?
The size of a market reaction often depends less on whether news sounds good or bad and more on how different the outcome is from what traders expected. The greater the surprise, the more aggressively positions may need to be repriced.
Consider earnings.
Suppose analysts expect a company to report earnings per share of $1.20 and it reports $1.30. That appears positive.
But if traders had pushed the stock higher expecting an unofficial result closer to $1.40, the stock could still fall. The reported number was good in isolation but disappointing relative to what the market had priced in.
The same principle applies to inflation data, employment reports and Fed decisions.
Markets respond to the difference between expectations and reality.
This is why an economic report that looks significant can produce almost no reaction when the number is close to expectations, while a modest surprise can trigger a large move if positioning was heavily tilted toward another outcome.
For an active trader, the practical question is therefore not simply:
“Was the news positive or negative?”
It is:
“What did the market expect, and how different was the actual outcome?”
Catalysts vs. Amplifiers: What Actually Creates a Volatility Spike?
A volatility catalyst introduces information that can change price expectations, while an amplifier determines how aggressively traders react. Earnings or CPI may start the move, but thin liquidity, crowded positions, leverage, short covering, or hedging flows can make it larger.
Typical catalysts include inflation and employment data, Federal Reserve decisions, corporate earnings and guidance, regulatory announcements, mergers and acquisitions, geopolitical developments, and unexpected company news.
Amplifiers work differently.
Imagine a company releases unexpectedly strong news. Traders rush to buy, but relatively few sellers are willing to transact near the previous price. Buyers then have to bid increasingly higher to find supply.
Now add short sellers covering positions and momentum traders entering as the move accelerates. What began as a news reaction can quickly become a much larger repricing.
The distinction matters because the headline alone rarely explains the full move.
An active trader should look for both:
What changed?
And what is making the reaction unusually strong?
This is also why liquidity deserves much more attention in conversations about what causes stock market volatility. A market with deep liquidity can absorb significant buying and selling with limited price disruption. Thin liquidity cannot.
Scheduled vs. Unscheduled Volatility: Can Traders Prepare for It?
Some volatility can be anticipated because traders know when major economic reports, Fed decisions, or earnings are scheduled. Unexpected corporate, geopolitical, or regulatory news cannot be timed, so traders must detect the resulting change in market behavior as it develops.
Scheduled catalysts give active traders one advantage: the timing is known even when the outcome isn’t.
The U.S. Bureau of Labor Statistics publishes a calendar for releases such as CPI, PPI and the Employment Situation. Many of these major reports are released at specific scheduled times, allowing traders to know when market sensitivity may increase.
The Federal Reserve likewise publishes its FOMC calendar and policy communications in advance.
Earnings dates provide another form of scheduled event risk. Traders may not know whether a company will beat expectations, miss them, or change guidance, but they know that new information is coming.
Unscheduled volatility is different.
A CEO resignation, unexpected regulatory decision, takeover report, geopolitical development or breaking company announcement can arrive without warning.
That creates a useful distinction:
Scheduled volatility can be prepared for. Unscheduled volatility has to be detected.
The goal is not to predict every move. It is to understand whether the environment has changed enough that your usual assumptions about volume, price range, liquidity or risk may no longer hold.
Is the Volatility Market-Wide, Sector-Specific, or Stock-Specific?
Volatility does not always affect the entire market equally. A macroeconomic surprise can move major indexes, an industry development can concentrate activity in one sector, and earnings or company news can make a single stock highly volatile while the broader market stays calm.
For active traders, this distinction is crucial.
If the S&P 500, Nasdaq and most sectors are moving sharply together, the driver is likely broad. Interest-rate expectations, inflation, economic data or geopolitical risk may be influencing the overall market.
At other times, the major indexes may appear relatively calm while one industry is moving aggressively.
Oil prices might shift energy stocks. A regulatory decision may affect biotech. A semiconductor announcement can move chipmakers while defensive sectors barely respond.
Then there is stock-specific volatility.
An earnings surprise, guidance revision, acquisition, analyst action, management change or product announcement can make one stock behave very differently from its peers.
A simple comparison helps:
Stock → Sector → Broader market
If a stock is up 5%, that number alone tells you very little.
If the stock is up 5% while its sector is up 4.5%, the move may primarily reflect sector strength.
If the stock is up 5% while its sector is flat and the overall market is down, its relative strength becomes much more interesting.
This is one reason active traders often combine price movement with sector context and relative performance when looking for momentum stocks rather than relying on percentage change alone.
How Can Active Traders Tell When Volatility Is Increasing?
Traders can monitor volatility through a combination of VIX, relative volume, price-range expansion, gaps, market breadth, price acceleration, and liquidity. No single indicator gives the full picture, so the strongest read usually comes from several signals confirming the same change.
The VIX is useful for broad-market context.
Cboe defines the VIX as a real-time estimate of expected S&P 500 volatility over roughly the next 30 days, calculated from SPX option prices. It is forward-looking rather than a measure of what prices already did.
But the VIX does not tell you everything happening inside individual stocks.
For active traders, several additional market volatility indicators matter.
- Relative volume (RVOL) asks whether a stock is trading more actively than normal. A stock trading two or three times its usual volume may signal that significantly more participants are involved.
- Range expansion asks whether the stock is traveling further than normal. ATR, or Average True Range, is one common way traders put recent price ranges into context.
- Gaps can reveal rapid repricing. A stock opening substantially above or below its previous close suggests that new information changed the price participants were willing to accept.
- Market breadth shows how widely participation is spread. A rising index supported by hundreds of advancing stocks says something different from the same index gain driven by a handful of large companies.
- Price acceleration shows whether movement is strengthening rather than merely remaining volatile.
- And bid-ask spreads help reveal liquidity conditions. A fast-moving stock with a very wide spread may offer plenty of movement but poor execution quality.
Together, these signals answer a more useful question than “Is volatility high?”
They help answer:
Where is volatility increasing, and what is supporting the move?
The Volatility Signal Stack: How Can Traders Evaluate a Fast-Moving Stock?
The Volatility Signal Stack evaluates a fast-moving stock through eight layers: catalyst, surprise, market context, relative volume, price acceleration, relative strength, liquidity, and risk. Its purpose is to structure analysis, not to turn volatility itself into a buy or sell signal.
Think through the stack in order.
| Layer | Question to ask |
| Catalyst | What changed, and why are traders paying attention? |
| Surprise | Was the new information materially different from expectations? |
| Market context | Is this market-wide, sector-driven, or stock-specific? |
| Relative volume | Is participation unusually high for this stock and time of day? |
| Price acceleration | Is movement gaining strength or fading after the initial reaction? |
| Relative strength/weakness | Is the stock behaving differently from its sector and broader market? |
| Liquidity | Can the position reasonably be entered and exited without excessive spread or slippage? |
| Risk | Has the stock’s range changed enough to alter stop distance or position risk? |
Not every layer needs to be extreme.
The point is to stop treating “stock moving fast” as a complete trading thesis.
A 10% gap in a thin stock without clear liquidity or follow-through may be far harder to trade than a smaller move supported by sustained participation and an identifiable catalyst.
The stack turns the question from:
“Is this stock volatile?”
into:
“What is supporting this volatility, and does the structure fit my setup?”
Tradable Volatility vs. Random Noise: What’s the Difference?
More volatility does not automatically create a better trading opportunity. Structured volatility tends to have an identifiable catalyst, participation, relative strength or weakness, liquidity, and follow-through. Chaotic volatility is more likely to feature thin trading, wide spreads, reversals, and poor execution.
| More structured movement | More chaotic movement |
| Clear catalyst | No obvious reason for activity |
| Elevated relative volume | Inconsistent or thin volume |
| Directional follow-through | Constant reversals |
| Relative strength or weakness | Little differentiation from market noise |
| Reasonable liquidity | Wide or unstable spreads |
| Visible price levels | Erratic jumps |
| More manageable execution | Higher slippage risk |
There is no perfect dividing line.
A stock can shift from orderly momentum to chaotic movement within minutes. A breakout can fail. Liquidity can disappear. A trend can reverse.
That is why active traders need to keep evaluating the move instead of assuming that the conditions present at entry will remain unchanged.
Volatility creates movement. It does not create certainty.
How Should Risk Management Change When Volatility Expands?
When volatility expands, traders should reassess position size, stop distance, liquidity, and total dollar risk together. Using the same trade size and tight stop from a quiet market can materially change the risk profile when normal intraday ranges become much wider.
Suppose a stock normally fluctuates $0.50 around an entry before a setup develops.
A $0.30 stop might leave very little room even under normal conditions.
Now suppose the stock’s typical intraday movement expands dramatically. Keeping that same stop could mean ordinary price noise repeatedly forces the trader out.
Simply widening the stop is not automatically the answer either.
A wider stop with the same number of shares means more dollars are now at risk.
So the relationship should be considered together:
Expected movement → stop location → position size → total risk
Execution also matters more during fast markets.
The price visible when an order is submitted may not be the price ultimately received. Wider spreads and quickly disappearing liquidity can increase slippage.
For active traders, trading in volatile markets therefore requires more than finding bigger movers. The underlying execution conditions have to remain acceptable as well.
VIX vs. Implied Volatility vs. Realized Volatility: What’s the Difference?
VIX, implied volatility, realized volatility, and ATR describe different aspects of market movement. VIX reflects expected S&P 500 volatility, implied volatility comes from options pricing, realized volatility measures past price variation, and ATR describes recent trading ranges. None predicts direction.
| Measure | What it helps describe |
| VIX | Expected 30-day S&P 500 volatility derived from SPX options |
| Implied volatility | Volatility implied by an option’s market price |
| Realized volatility | How much an asset actually moved over a past period |
| ATR | The typical price range over a selected lookback period |
Cboe specifically describes VIX as a non-directional measure of expected S&P 500 movement.
That distinction is easy to overlook.
A high volatility reading does not mean the market is expected to fall. It means the expected range of movement has increased.
For an individual stock, implied and realized volatility may provide more specific context than a broad-market index.
What Volatility Trends Should Active Traders Watch?
Active traders should pay attention to faster event-driven repricing, growing short-dated options activity, automated reactions to new information, sector-level divergence, and relative rather than absolute movement. These trends affect where volatility appears and how quickly trading conditions can change.
1. Event-driven repricing can happen very quickly
Economic data, earnings and policy announcements can cause markets to reassess price almost immediately.
The important change for an active trader is not that events suddenly matter—they always have.
It is the need to distinguish the initial headline reaction from sustained movement.
A first spike can disappear quickly. A move supported by continued participation, relative strength and liquidity may develop differently.
That makes confirmation increasingly important.
2. Ultra-short-dated options are becoming harder to ignore
Short-dated options have become a significant part of index trading activity.
Cboe reported that SPX zero-days-to-expiry, or 0DTE, options averaged 2.3 million contracts per day in 2025, representing 59% of total SPX options volume. In June 2026, monthly average daily volume reached a record 3.3 million contracts.
That does not mean 0DTE options automatically cause market volatility.
Their relevance is more nuanced. Options positioning and dealer hedging flows can interact with intraday price movement depending on the structure of positioning at the time.
For active traders, the useful takeaway is simply that modern intraday market structure includes substantial very-short-dated derivatives activity.
3. Automated trading can accelerate reactions
Algorithms can process market data, execute predefined instructions, and react to changes far faster than a person manually placing orders.
That does not mean algorithms are the root cause of every fast move.
The catalyst can still be economic data, earnings, news or another change in expectations.
Automation can affect how quickly that information travels through prices and related securities.
For traders, this makes real-time monitoring especially valuable around high-impact events.
4. Index volatility can hide what is happening underneath
The S&P 500 does not need to be swinging wildly for active traders to find substantial movement.
Volatility may be concentrated in semiconductors, biotech, small caps, energy names or a group of earnings stocks while the broad indexes remain relatively stable.
This means the question:
“Is the market volatile?”
may be less useful than:
“Where is unusual activity occurring right now?”
5. Relative activity gives movement context
A 4% move is not equally unusual for every stock.
For a historically stable large-cap stock, it might represent a major change.
For a stock that routinely moves 8% in a session, it may be ordinary.
The same is true of volume.
Two million shares may be enormous participation for one stock and insignificant for another.
That is why metrics such as RVOL, relative strength and range compared with normal behavior often provide more useful information than raw numbers alone.
How Can Active Traders Find Where Unusual Market Activity Is Developing?
Active traders can narrow the market by scanning for conditions such as unusual relative volume, price gaps, momentum, new highs or lows, liquidity, and range expansion. Scanners surface candidates; traders still need to evaluate the catalyst, chart, execution, and risk.
Manually checking thousands of charts is not realistic during a fast session.
A scanner solves a narrower problem: Where should I look?
It can continuously apply predefined conditions across the market and surface stocks as those conditions appear.
That may include a stock suddenly trading at several times normal relative volume, making a new intraday high, gapping after news, or showing momentum while the broader market weakens.
Trade Ideas describes this same distinction in its guide to stock scanners for active traders: scanners monitor the market continuously and surface securities meeting predefined conditions rather than requiring traders to search individual charts manually.
The scanner should not make the final decision.
It shortens the search.
A useful workflow is:
Scan → investigate catalyst → compare market/sector → check volume and price structure → evaluate liquidity → define risk → trade or pass
The last option matters.
A good scanner should help traders find more candidates worth evaluating, not pressure them into trading every alert.
What Is a Quick Volatility Check Before Trading a Fast-Moving Stock?
Before trading a fast-moving stock, check what caused the move, whether the news was expected, where the movement is concentrated, whether volume confirms participation, whether price has follow-through, whether liquidity remains adequate, and whether your planned risk still fits.
A practical 60-second check is:
- What changed? Identify the catalyst rather than assuming every price spike has the same meaning.
- Was it expected? Compare the event with what traders appeared to have priced in.
- Is the market moving too? Compare the stock with its sector and major indexes.
- Is participation unusual? Check relative volume rather than raw volume alone.
- Is there follow-through? Determine whether momentum continues beyond the initial reaction.
- Is the stock liquid enough? Check spread and execution conditions.
- Has the normal range expanded? Revisit stop distance and position risk.
- Where is the setup invalidated? Know what would make the original trade idea wrong.
A fast-moving stock can fail this checklist even if it is one of the biggest percentage movers of the day.
Passing on poor volatility is still a trading decision.
What Should Traders Review After a Volatile Session?
After a volatile session, traders should review process rather than P&L alone. Useful questions include whether the setup matched the plan, what market condition existed, how execution changed, whether planned risk was respected, and which setups improved or deteriorated.
A winning trade can still contain a bad decision.
A losing trade can still reflect disciplined execution.
That distinction becomes particularly important during volatile conditions because randomness and larger ranges can make individual outcomes look more meaningful than they really are.
Review whether the move had a real catalyst and whether volume confirmed the setup. Compare the stock with its sector and the overall market. Look at whether slippage was materially worse than expected.
Then compare planned risk with actual risk.
If the trader repeatedly widened stops, increased position size, chased extended moves or ignored liquidity as markets accelerated, the performance issue may be execution rather than the strategy itself.
Over several sessions, look for patterns.
Does one setup perform better during high-RVOL conditions? Do results deteriorate during two-way volatility? Does execution worsen at the open? Are losses concentrated in thin stocks?
The point of a trading review is not simply to determine whether the market was difficult.
It is to learn which market conditions fit the strategy and which expose weaknesses in it.
Final Thoughts: Don’t Just Ask Whether the Market Is Volatile
Understanding volatility is most useful when it leads to better questions: what caused the move, how surprising was the catalyst, where is activity concentrated, is participation confirming it, is liquidity adequate, and has the risk changed?
That is the practical answer to what causes market volatility.
New information changes expectations. Traders reposition. Liquidity determines how easily the market absorbs those orders. Volume, momentum, positioning and market structure can then strengthen or weaken the resulting move.
For active traders, volatility itself is not enough.
The goal is to recognize when market conditions have changed, find where meaningful activity is concentrated, and decide whether the move has enough structure to fit a defined trading plan.
When it does not, passing is a valid decision.
When it does, the trader should still know the catalyst, understand the context, check the liquidity, and define the risk before acting.
Volatility is movement. Context is what makes that movement useful.
Turn Market Movement Into a Focused Watchlist
Use real-time market scanning to narrow fast-moving conditions to stocks that match the volume, price, momentum, and liquidity criteria you actually trade.
Frequently Asked Questions
Does high trading volume mean a stock is a good volatility setup?
No. High trading volume only shows increased participation; it does not confirm that a stock has a quality trading setup. Traders should also evaluate the catalyst, price direction, follow-through, liquidity, and relative strength before considering a volatile move actionable.
A stock can trade several times its normal volume and still produce weak price action if it lacks direction, liquidity, or a clear reason for the move. The combination of volume, price behavior, and market context provides a more complete picture.
Does volatility mean the stock market is going down?
No. Volatility measures the size and speed of price movement, not whether prices move higher or lower. Stocks can experience volatility during strong rallies, sharp declines, or periods of rapid movement in both directions.
For active traders, the important question is not whether volatility is high or low. It is whether the current movement matches the trading strategy being used and whether the risk is manageable.
Is high volatility good or bad for active traders?
High volatility can create more trading opportunities because prices move further and faster, but it also increases risk through wider spreads, slippage, faster reversals, and larger price swings. Volatility is useful only when traders can manage the conditions it creates.
A volatile stock may offer momentum opportunities, but traders should evaluate whether the move has structure, liquidity, and a clear setup rather than assuming every large move is worth trading.
What time of day is the stock market usually most volatile?
The opening and closing portions of the trading session often see heavier activity because overnight information is being repriced near the open and institutional orders may concentrate near the close. Individual stocks can still become volatile at any time after news.
What is considered high volatility for a stock?
There is no universal percentage that defines high volatility. A better approach compares a stock’s current range and movement with its own historical behavior. ATR, realized volatility, relative volume, and typical percentage movement can provide useful context.
Can a stock be highly volatile when the VIX is low?
Yes. VIX estimates expected volatility for the S&P 500, not every individual stock. Earnings, takeover news, regulatory decisions, product announcements, or sector-specific catalysts can create significant stock-level volatility even when broad-market volatility remains relatively subdued.
Why does volatility tend to rise when markets fall?
Sharp declines often create greater uncertainty, faster repositioning, demand for protection, leverage reductions, and forced selling. These reactions can increase both realized and implied volatility, although volatility can also increase during strong upside moves and is not inherently bearish.
What is the difference between volatility and beta?
Volatility measures how much an asset’s own price varies, while beta measures how sensitive its returns have historically been relative to a benchmark such as the market. A stock can therefore have high volatility without necessarily having an equally high beta.