How Active Traders Use a Day Trading Scanner in Summer
How Active Traders Use a Day Trading Scanner in Summer
Summer trading can make a day trading scanner feel noisier than usual. Some days produce fewer clean setups, while other days show plenty of alerts that fade after the open, lose volume, or move without a clear catalyst. That creates a real problem for active traders: the scanner may show movement, but not every mover deserves attention.
This article focuses on how to read scanner alerts during summer conditions, using volume, liquidity, catalysts, and post-open confirmation to separate cleaner setups from low-quality noise. Here’s what the data shows.
What Is a Day Trading Scanner in Summer, and Why Does It Matter?
A day trading scanner does not change during the summer. The market environment does.
Holiday weeks, thinner participation, and uneven sector activity can make scanner alerts less reliable than they appear at first glance. A stock that gaps before the open may struggle to attract follow-through once regular trading begins, while a smaller number of names can account for a larger share of market activity.
For active traders, summer scanner use is less about finding more opportunities and more about filtering for quality. Relative volume, catalyst strength, liquidity, and post-open confirmation often become more important than raw percentage gains.
The key question is not whether a stock appears on a scanner. The key question is whether the move is attracting enough participation to hold after the open.
Historical Data & Precedents
Past summers show why active traders should not read scanner alerts in isolation. Summer 2020, 2021, 2022, 2023, 2024, and 2025 each had different market conditions, even though each covered the same seasonal window.
The research-backed historical compilation below compares summer regimes by market condition, index behavior, volatility or leadership context, and scanner takeaway. It is not a prediction model. It is a calibration table for deciding which scanner filters deserve more weight.
| Date | Conditions | Market Reaction | Duration | Scanner Takeaway |
| Summer 2020 | Pandemic recovery, high retail participation, elevated volatility | S&P 500 returned +2.02% in June, +5.32% in July, and +6.45% in August. VIX closed Q2 at 30.43, above its historical average of 19.37. | June through August 2020 | Many names met momentum conditions. Scanner thresholds needed stricter volume, liquidity, and risk filters because alert count could rise quickly. |
| Summer 2021 | Calmer index trend with short volatility spikes | VIX spiked to 24.74 in mid-August and closed August at 16.67. | June through August 2021 | Volatility bursts inside calm tapes made post-open confirmation useful, especially for gappers losing early momentum. |
| Summer 2022 | Inflation pressure, rate-shock volatility, sharp macro reversals | S&P 500 returned -8.78% in June, +9.24% in July, and -3.83% in August. It also fell 22.99% from Jan. 4 to June 16, then climbed 17.68% from June 16 to Aug. 16. | June through August 2022 | Gap size alone was not enough. VWAP, opening range, and post-open confirmation mattered more. |
| Summer 2023 | Narrow leadership, AI-linked strength, sector concentration | S&P 500 returned +6.39% in June, +3.11% in July, and -1.55% in August. Nasdaq was up 34.1% YTD by August, while energy was the only positive U.S. sector in August at +1.6%. | June through August 2023 | Sector-cluster scanners helped identify whether movement was theme-backed or isolated. |
| Summer 2024 | Rotation from large-cap leadership into smaller-cap participation during July | S&P 500 returned +3.08% in June, +0.94% in July, and +2.00% in August. Russell 2000 rallied 11.5% in July. | June through August 2024 | Small-cap and breadth scans mattered because index-level movement did not tell the full story. |
| Summer 2025 | Positive index tape with selective catalyst pockets | S&P 500 returned +5.23% in June, +2.46% in July, and +2.75% in August. July showed the S&P 500 at +2.24% for the month and +8.59% YTD. | June through August 2025 | Continuation scans and sector breadth checks helped traders avoid treating every mover as equal. |
A separate liquidity note matters for scanner interpretation: August has been cited as a slower trading month, with about 9.3 billion shares changing hands per day across major U.S. exchanges in one 2024 market summary, nearly 30% fewer than the 13.2 billion shares in March. That supports a summer focus on volume quality rather than raw alert volume.
Pro Tip: History helps set the scanner checklist, not the trade decision. Past performance does not guarantee future results, and current summer conditions can differ when volume, volatility, macro catalysts, or sector leadership shift.
Also Read: For more on managing active conditions, see 7 Strategies for Navigating Market Volatility.
Scenario Analysis
Summer scanner use works best when traders prepare for multiple conditions instead of treating one market script as fixed. These scenarios are if/then frameworks, not predictions.
| Scenario | IF trigger | THEN historical precedent suggests | Scanner focus | Main risk |
| Selective-volume summer | IF broad scan count drops, but a few names show relative volume above 2.0x by 10:00 a.m. ET | THEN fewer, higher-quality alerts may matter more than broad participation | Relative volume, spread, dollar volume, post-open hold | Forcing trades when alert quality is weak |
| Catalyst-led tape | IF most active names are tied to earnings, filings, guidance, macro data, or sector headlines | THEN, catalyst scanners may carry more weight than generic gainer lists | News, earnings, filing, gap %, relative volume | Chasing headlines without liquidity confirmation |
| Failed-breakout tape | IF pre-market gappers lose VWAP or fail to hold the opening range after 15 to 30 minutes | THEN post-open confirmation may matter more than the pre-market gap | VWAP, opening range, high-of-day reclaim, volume acceleration | Entering before the setup confirms |
| Quiet index, active themes | IF SPY and QQQ show limited movement, but three or more related names move on volume | THEN theme scanners may reveal activity hidden by the index | Sector clusters, peer confirmation, relative strength | Treating one isolated mover as a full theme |
The contrarian case is simple: a quieter summer tape does not automatically mean no tradeable activity. It can mean fewer setups, stricter filters, and a higher bar for confirmation.
Trading Approaches
A day trading scanner should support different trading styles, not force one setup. The summer adjustment is to make the scanner more selective when conditions become thinner, noisier, or more catalyst-driven.
Day Traders: Build the List Before the Open, Then Re-Rank It
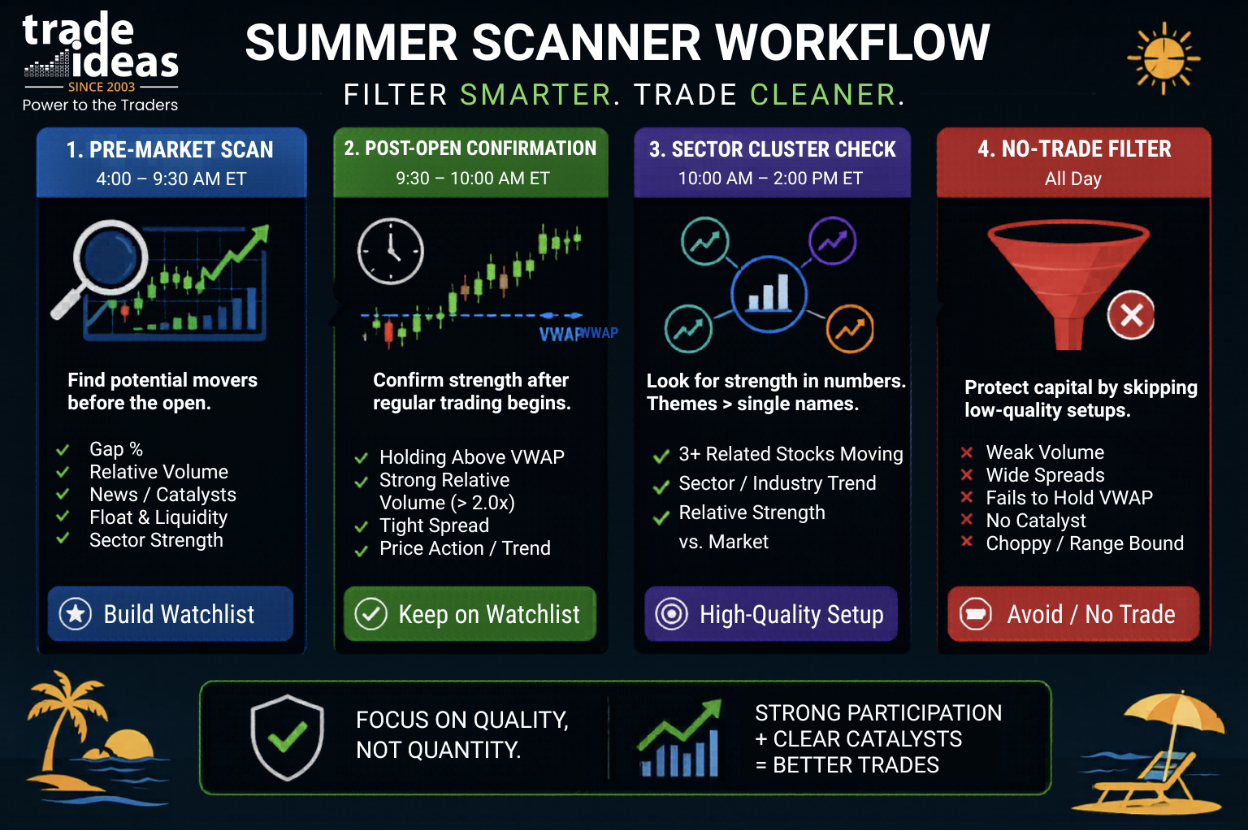
Pre-market scans help find names with gaps, news, and early volume. They should not be treated as final decisions. A practical workflow is:
- Scan for gaps above 3%.
- Require pre-market volume above a minimum liquidity threshold.
- Check for a confirmed catalyst.
- Re-rank the list after the first 15 to 30 minutes of regular trading.
- Remove names that lose VWAP, lose the opening range, or show wide spreads.
Momentum Traders: Prioritize Participation
Momentum traders need more than price movement. A summer mover with relative volume above 2.0x, tight spreads, and sector confirmation is more useful than a large percentage gap with weak trading activity. For a broader foundation, see How Momentum Trading Works: A Beginner’s Guide.
Swing Traders: Watch Sector Clusters
Swing traders can use intraday scanners to identify early theme formation. If three or more names in the same sector show above-normal volume, that can create a watchlist for multi-day review. The scanner is the first filter, not the full plan.
Position Traders: Use Scanners as Timing Tools
Longer-term traders can use scanner output to monitor whether a macro or sector thesis is becoming active. A planner watching technology, small caps, or energy can track whether intraday scanner activity supports or conflicts with the broader view.
Risk-First Traders: Use the No-Trade Condition
A scanner that produces few clean alerts is still useful. The no-trade condition can include:
- Relative volume below 1.2x after a pre-market gap.
- Spread wider than 0.5% of the price.
- No confirmed catalyst.
- Failed opening range hold.
- One isolated mover with no sector peer confirmation.
Common Mistake: Treating a large pre-market percentage move as tradable before checking volume, spread, catalyst, and post-open behavior. In summer, thin liquidity can make that error harder to manage.
Tools & How Trade Ideas Can Help
Trade Ideas can help active traders monitor the signals above by separating scanner windows by purpose rather than putting all alerts into a single feed. The goal is to make the workflow easier to read during summer sessions, especially when fewer names meet clean criteria.
| Scanner channel | Example filters | Purpose |
| Summer Gap Watch | Gap above 3%, price above $5, relative volume above 1.5x, spread below 0.5% | Builds the pre-market list |
| Post-Open Continuation | Opening range hold, VWAP hold, relative volume above 2.0x by 10:00 a.m. ET | Confirms which gaps still have participation |
| Catalyst Monitor | Earnings, filings, guidance, macro headlines, sector news, volume confirmation | Separates news-backed moves from unexplained moves |
| Sector Cluster Scan | 3+ names in the same sector or theme moving on above-normal volume | Tracks theme strength |
| No-Trade Filter | Wide spreads, weak volume, failed opening range, no catalyst | Helps identify weak scan quality |
Trade Ideas scans thousands of stocks in real time, which helps compare live scanner output against the signal dashboard. The key is to set alerts for conditions, not just symbols: relative volume crossing 2.0x, a stock reclaiming VWAP, or several related names moving together.
Conclusion
Summer scanner use is about calibration, not emotion. Historical patterns show that volume, liquidity, catalysts, and post-open confirmation can change the quality of scanner alerts. Past performance does not guarantee future results, so traders should prepare for multiple scenarios, review current data, and treat weak scanner output as information.
Explore how Trade Ideas can help monitor summer scanner signals in real time, from relative volume and gap alerts to catalyst-driven watchlists.
Common Questions About Day Trading in Summer Answered
What scanner settings matter most for summer day trading?
The most useful summer scanner settings are relative volume, gap %, liquidity, spread, catalyst type, sector confirmation, VWAP status, and opening range behavior. A starting point is relative volume above 2.0x by 10:00 a.m. ET, gap above 3%, and spread below 0.5% of price.
Is summer usually slower for active traders?
Summer can have lower participation during holiday periods and late-August sessions, but slower broad volume does not mean every stock is inactive. Past summers show that catalyst names, sector clusters, and theme-driven moves can still appear. The scanner should help identify whether activity is concentrated or broad.
Should active traders scan before the open or after the open?
Both matter, but they serve different jobs. Pre-market scans help build a candidate list. Post-open scans help confirm whether those candidates still have participation after regular trading begins. In summer, the first 15 to 30 minutes can be especially useful for filtering out weak gaps.
What risks are higher when using a scanner during low-volume sessions?
The main risks are wider spreads, slippage, false breakouts, weak follow-through, and gap reversals. A scanner can show when these risks are present, but it cannot remove them. This is why spread, dollar volume, VWAP, and opening range checks should sit beside price and volume alerts.
What should traders do if a scanner shows fewer setups than usual?
Fewer setups can be useful information. If the scanner shows weak relative volume, poor liquidity, and failed opening range holds, the best approach may be to wait. The no-trade condition is part of the scanner workflow, not a failure of the scanner.
How often should scanner thresholds be adjusted during summer?
Thresholds should be reviewed when the market regime changes, when holiday weeks distort participation, or when scanner output becomes too noisy or too thin. A trader might keep the same core rules but adjust relative volume, spread, and catalyst requirements based on the current tape. Any current readings should be refreshed before publication.