Santa’s Rally: Myth, Magic, or Measurable Edge For Investors?
Santa’s Rally: Myth, Magic, or Measurable Edge For Investors?

Every year, as December winds down and the financial world wraps up for the year, a familiar phrase, Santa’s rally, returns to trading desks and analyst reports.
This seasonal pattern refers to the market’s tendency to rise during a specific 7-trading-day window: the last 5 trading days of December, and the first 2 trading days of January. But is Santa’s rally truly a reliable pattern? Or simply festive market mythology?
As the new year approaches, this guide breaks down what drives Santa’s rally, whether it still matters today, and how modern traders can position themselves to take advantage of it.
Here’s a five-year retrospective chart for Santa Claus Rally (last 5 trading days of Dec + first 2 trading days of Jan), using publicly cited data for recent years for the S&P 500.
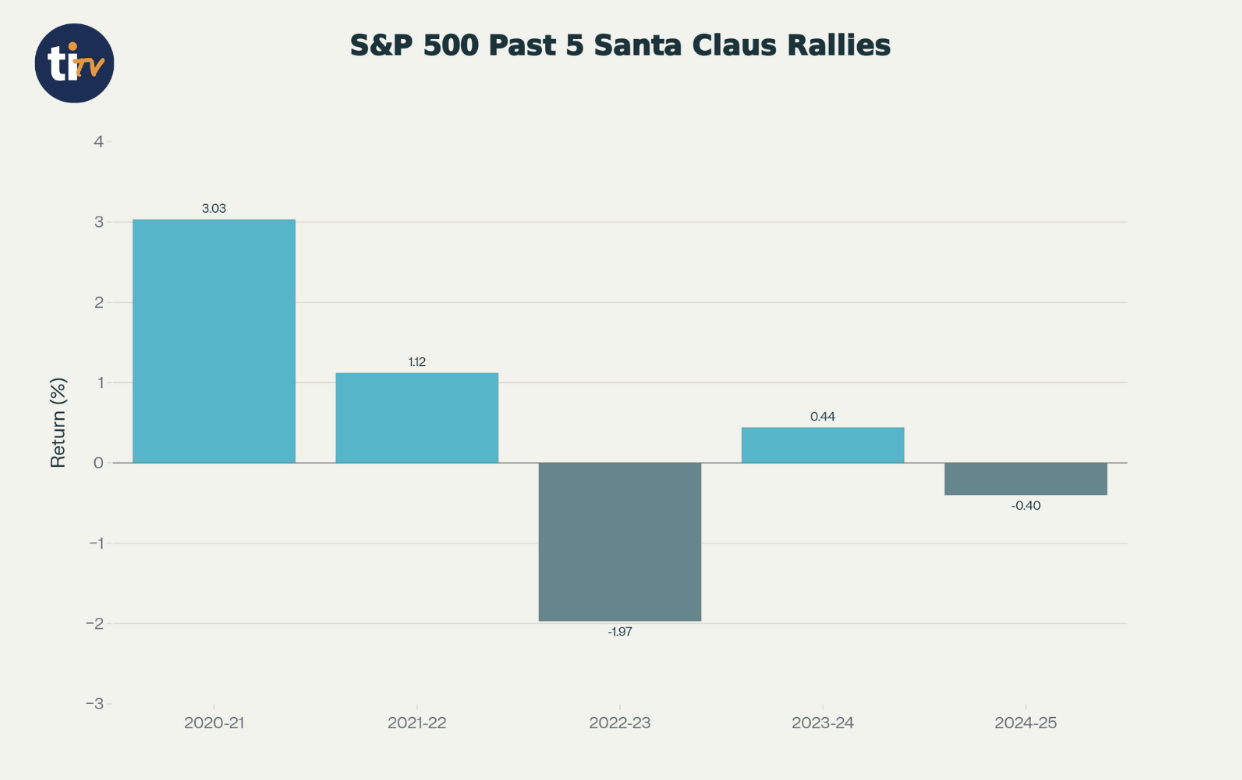
“Return during Santa Window” = performance over the last 5 trading days of December + first 2 trading days of January.
Note: Trading-day counts follow U.S. market holidays and calendar conventions.
What This Chart Shows
The S&P 500’s performance during the past five Santa Claus Rally periods has been mixed, with three gains and two declines. Overall, the pattern shows that while the effect is often positive, it is not guaranteed.
During the 2020–2021 Santa Claus Rally window, the index advanced by about 3.03%, marking the strongest gain of the five periods. In 2021–2022, the S&P 500 continued to rise, delivering a smaller but still positive return of roughly 1.12%.
The 2022–2023 stretch broke this positive trend, as the index declined by approximately 1.97%, standing out as the most notable downside move in the group. The following 2023–2024 period saw a modest rebound, with the S&P 500 posting a gain of around 0.44%.
In 2024–2025, the index slipped again, falling about 0.40% during the Santa Claus Rally window, reflecting the broader weakness seen in December 2024. Together, these results illustrate that while the Santa Claus Rally can coincide with year-end strength, outcomes can vary significantly from year to year.
What Exactly Is Santa’s Rally?
Santa’s rally is a historical seasonal trend in which equities, especially U.S. indices such as the S&P 500, Dow Jones, and Nasdaq, often rise in the final days of December and the opening days of January. The pattern was first documented and popularized by Yale Hirsch in the Stock Trader’s Almanac.
The key question is whether this is a coincidence or a pattern supported by psychology, institutional behaviour, and market structure.
Why Santa’s Rally Happens: The Psychology + Mechanics
Multiple forces converge during this period to create conditions that often push markets upward. These five forces are the most commonly cited drivers behind the Santa effect, and they tend to cluster in late December.
1. Thin Liquidity Creates Cleaner Price Movements
Late December trading typically involves:
- Reduced hedge fund activity
- Fewer institutional participants
- Smaller trading desks
With fewer players, even modest buying pressure can lift prices more easily.
2. Optimistic Investor Sentiment
Year-end typically brings:
- A positive outlook
- Lighter risk aversion
- Increased willingness to hold positions
This supportive sentiment reduces selling pressure and encourages incremental accumulation.
3. End of Tax-Loss Harvesting
Selling pressure from tax-loss harvesting usually ends mid-December. Once it fades:
- Declines stabilize
- Bargain hunters step in
- Reversal setups appear
4. Institutional Window Dressing
Portfolio managers often buy top-performing stocks late in the year to improve the appearance of their annual holdings. This behaviour typically leads to:
- Increased demand for leading names
- Upward pressure on strong momentum stocks
- A final boost in outperforming sectors
5. New Year Positioning + Inflows
Early January brings:
- Pension fund allocations
- Retirement account contributions
- Corporate investment flows
These inflows frequently add momentum to the tail end of the rally window.
How Traders Can Prepare for Santa’s Rally
Two ways to use this edge
Investors: Treat Santa’s strength as a mild seasonal tailwind, not a timing signal. Avoid reshuffling long-term allocations just for a 7-day pattern.
Traders: Use it as a short-window probability boost, best paired with relative-strength leaders, clear entries, and strict risk control.
Successful traders combine preparation, timing, and selective stock picking. Here’s a streamlined approach.
1. Focus on Stocks Showing Relative Strength
Strong names often outperform during Santa’s rally, especially those showing new highs, clean uptrends, high-volume breakouts, and consistent strength. This period tends to reward leaders rather than laggards, making relative strength one of the most reliable filters.
TradeIdeas scanners help surface momentum leaders, breakout candidates, high-RS names, and intraday strength setups, allowing traders to quickly identify stocks positioned to benefit from seasonal tailwinds.
2. Watch for Pullbacks Before December 20th
Seasonal pullbacks caused by tax-loss harvesting, profit taking, and holiday slowdowns often create discounted entries that reverse into the Santa rally window. These dips can be some of the best setups of the season. TradeIdeas alerts such as “Oversold Bounce,” “Trend Change,” or “Power Gap” help traders spot early reversals before the real rally window begins, increasing the odds of entering ahead of the upswing.
3. Use Seasonal and Historical Data
Combine price action, relative strength, volume alignment, and seasonality charts. The more confluence, the higher the confidence. Historical performance reinforces this approach: decades of data show Santa’s rally has been positive 75–80% of the time, with average returns of 1% to 1.5%. When this period is negative, it has historically hinted at weaker January and Q1 performance.
As Yale Hirsch famously said, “If Santa Claus should fail to call, bears may come to Broad and Wall.” While not a guarantee, this window acts as a valuable sentiment gauge for traders using seasonal patterns.
4. Avoid Deeply Weak Stocks
Severely beaten-down names rarely participate meaningfully in Santa’s rally. Seasonal strength tends to flow toward high-quality movers, liquid tickers, and stocks backed by strong sectors such as tech or consumer discretionary. Names with catalysts; earnings revisions, upgrades, product news, respond exceptionally well during this period. Maintaining a focus on leaders rather than laggards increases participation in the seasonal upside while avoiding dead money.
5. Manage Risk
Although Santa’s rally is historically reliable, it is not guaranteed. Unexpected shocks such as inflation surprises, geopolitical events, or earnings disappointments can disrupt the pattern. Traders should stay disciplined with stops, appropriate position sizing, and partial exits to prevent gains from evaporating.
Seasonal edges work best when paired with solid risk management, ensuring traders can benefit from the rally without being exposed to unnecessary downside.
How TradeIdeas Helps Traders Navigate Santa’s Rally
TradeIdeas can be especially effective during Santa’s rally because it helps traders interpret unusual year-end market behaviour with clearer, data-driven signals.
1. Real-Time Pattern Detection
Trade Idea’s real-time scanning engine continuously monitors U.S. markets and highlights actionable setups as they form. This makes it easier to spot breakouts, low-float movers, high-relative-strength names, and oversold reversals, all of which tend to appear more frequently when liquidity is thin and sentiment shifts quickly in late December.
2. Seasonality-Aligned Scanning
Because Trade Ideas allows highly customizable filters, traders can build scans that align with seasonal factors. This includes identifying stocks that historically perform well in December, names showing patterns similar to prior Santa-rally periods, or setups where volume and price behaviour match familiar year-end tendencies. This approach helps traders narrow down which opportunities deserve attention when the market behaves differently from the rest of the year.
3. AI-Driven Strategy Alerts (Holly AI)
Holly AI reviews market conditions using historical statistics and technical criteria, then highlights setups with historically favourable characteristics. During late-December sessions when liquidity is inconsistent and institutional behaviour plays a larger role, Holly’s filtered alerts can help traders stay focused on higher-quality setups rather than chasing noise.
4. Backtesting Santa-Rally Strategies
TradeIdeas’ backtesting engine, OddsMaker, allows traders to evaluate how specific strategies or scans would have performed during previous Santa-rally periods. This includes identifying which tickers tend to move consistently, which entry/exit rules perform best, and which seasonal patterns repeat often enough to be useful. Backtesting doesn’t predict the future, but it provides a grounded framework for decision-making.
5. Spotting Volume Divergences and Unusual Activity
Volume is a crucial signal during quiet holiday trading. Trade Ideas’ scanning and alerting tools help surface unusual volume spikes, early accumulation, or rotation into specific sectors. These early signs often precede price continuation during the Santa-rally window, especially when institutional activity returns after mid-December.
What a Failed Santa’s Rally Means
If Santa doesn’t show up, history suggests caution. Negative Santa periods have often preceded:
- Weak January
- Soft Q1 performance (If Santa doesn’t show up, it can be a caution flag, not a forecast.)
- Higher volatility
- Declining risk appetite
It’s not a perfect predictor, but professional traders watch it closely for sentiment shifts.
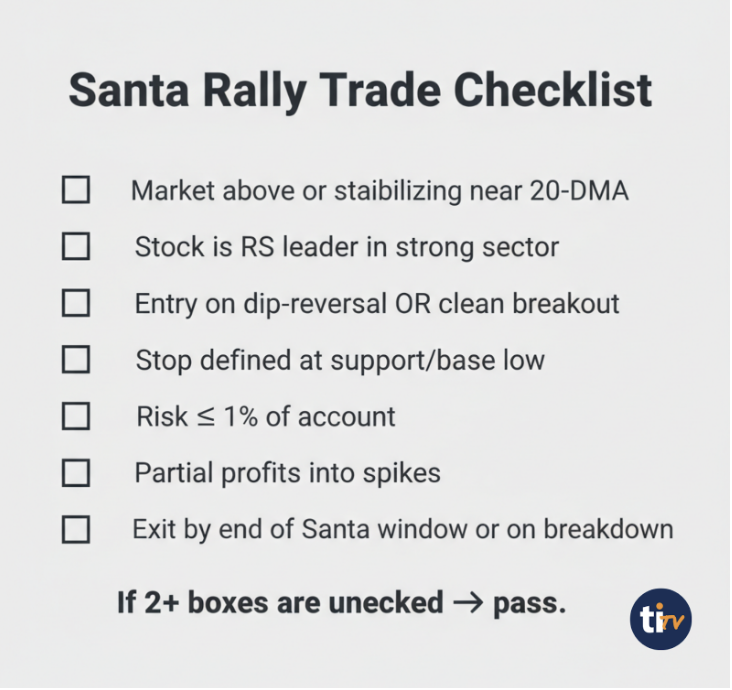
Santa Rally Trade Checklist (Save This)
Before you place any Santa-rally trade, run it through this quick checklist. If the setup doesn’t meet most of these conditions, skip it; seasonal edges only work when the chart and market agree.
Final Thoughts: Making Sense of Santa’s Rally and Its Market Impact
Santa’s rally is not guaranteed, but decades of market data show it remains one of the most persistent seasonal trends in equities. Much of its reliability comes from a blend of institutional positioning, where large investors rebalance portfolios and lock in year-end results. Predictable human behaviour as retail optimism rises during the holiday season.
Reduced liquidity also plays a role, allowing smaller waves of buying to influence price action more than usual. At the same time, new-year inflows from funds and retirement accounts add another layer of upward pressure. All of these forces contribute to a recurring pattern that consistently appears in market history.
For traders who prepare early, stay selective, and lean on scanning tools like Trade Ideas, Santa’s rally can provide a measurable though not magical edge. With the right strategy and discipline, this seasonal window can be an opportunity to close the year strong and begin the new one with renewed momentum.
Related Reads
Swing Trading vs. Day Trading: Understanding the Differences and Benefits
The Psychology of Paper Trading vs. Real Trading
FAQs About Santa’s Rally
1. Does Santa’s Rally Still Matter Today?
Yes, Santa’s Rally still matters. Despite modern algorithms and constant news flow, the same forces: liquidity, investor psychology, institutional activity, and year-end inflows, continue to create seasonal strength. These patterns appear in U.S. equities, small caps, and high-volume large caps, keeping the effect relevant today.
2. How often has Santa’s rally been successful historically?
Historically, the rally period has delivered gains more often than not. Data shows the stock market has risen during the Santa rally window roughly 75–80% of the time, with average gains around 1–1.5%.
3. Does Santa’s rally work in all market conditions or for all sectors?
No. The effect doesn’t guarantee success, and not all sectors or stocks benefit equally. Market conditions, underlying fundamentals, and volatility all influence whether a Santa rally materializes. Some stocks outperform or underperform, depending on broader economic and market-specific factors.
4. Should investors rely on Santa’s rally or treat it as a guaranteed strategy?
Santa’s rally can offer a favourable seasonal bias, but it isn’t a guarantee. It should be treated as one factor among many, combined with strong stock selection, risk management, and awareness of market conditions. Seasonal patterns add context, but fundamentals and market structure remain critical.
5. Does Santa’s Rally Affect All Markets Equally?
Santa’s Rally doesn’t affect all markets equally. It’s strongest in U.S. equities, particularly major indices where large caps benefit from institutional flows and small caps see bigger but more volatile moves. Forex and crypto show weaker effects, though low liquidity can still create outsized swings.