Crossed Above Resistance vs False Breakouts: How to Find the Difference
Crossed Above Resistance vs False Breakouts: How to Find the Difference
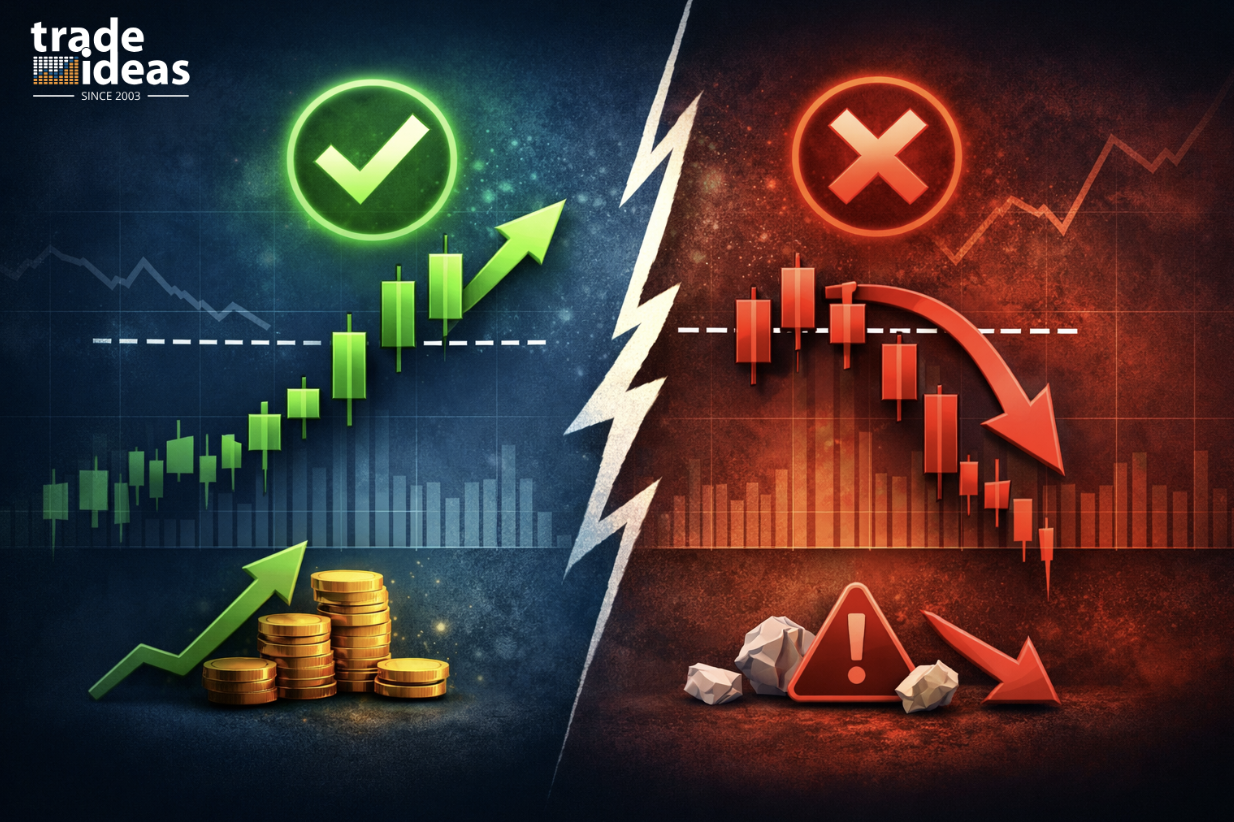
One of the most common moments in trading happens when the price finally pushes above resistance. Alerts fire, momentum looks strong, and traders rush in, only to watch the move stall or reverse.
This is where the difference between a crossed above resistance move and a false breakout matters. While both start the same way, only one leads to sustained follow-through. Let’s find out how to separate them so you can protect your capital and improve your entries.
What Does “Crossed Above Resistance” Mean?
A Crossed Above Resistance (CAR) alert triggers when the price moves above a clearly defined resistance level based on prior price behavior.
Resistance represents an area where the price previously struggled to move higher. When the price crosses above it, the market is signaling a potential shift in supply and demand.
However, a key point many traders miss is that crossing resistance is a signal and not a guarantee. Price can cross resistance briefly and still fail. That’s where false breakouts come in.
What Is a False Breakout?
A false breakout occurs when the price breaks above resistance but fails to hold that level. Instead of continuing higher, it quickly reverses and moves back into the prior range.
False breakouts often trap traders who enter too early, assuming every resistance break will lead to a trend. These failed moves are especially common in choppy markets, low-volume sessions, or during weak overall market conditions.
How to Tell a Real Breakout from a False Breakout
| Treating Every Resistance Break as a Breakout Leads To | Identifying False Breakouts Helps You |
| Chasing weak moves | Avoid low-quality trades |
| Getting stopped out repeatedly | Improve timing |
| Giving back gains in sideways markets | Trade with confirmation, not hope |
Key takeaway: The goal isn’t to avoid resistance breaks; it’s to trade the right ones.
1. Look at What Happens After the Break
This is the most important step.
- Real breakout: Price holds above resistance and begins to build higher lows
- False breakout: Price quickly slips back below the resistance level
If the price can’t stay above the level, the market is rejecting higher prices.
2. Check Volume and Participation
Breakouts work when participation increases.
- Rising volume supports a genuine breakout
- Weak or declining volume often signals a false breakout
A resistance break without participation is usually fragile.
3. Watch the Retest
Many strong breakouts retest the resistance level after crossing it.
- Healthy breakout: Resistance turns into support
- False breakout: Retest fails, and price drops back into the range
The retest shows whether the market truly accepts the new price level.
4. Consider Market Conditions
Even strong technical signals can fail in the wrong environment.
False breakouts are more common when:
- The broader market is weak
- Volatility is low
- There’s no clear catalyst or momentum
Context matters just as much as the level itself.
5. Use Momentum as Confirmation
Momentum indicators can help filter breakouts.
- Strong momentum supports continuation
- Divergence or fading momentum increases false breakout risk
Momentum should expand after the break, not slow down.
How Traders Approach Each Scenario
Trading a Real Breakout
- Wait for confirmation above the resistance
- Enter after the price holds the level
- Place stops below the former resistance
- Manage risk in case momentum fades
Trading a False Breakout
- Avoid chasing the initial break
- Look for rejection signals
- Consider reversal setups once the price falls back below the resistance
- Keep tight risk controls
Not every trader trades false breakouts. However, recognizing them helps everyone avoid bad entries.
Tools for Better Analysis
Trade Ideas isn’t just a scanner; it’s a market intelligence platform built to help traders separate real breakouts from false ones using powerful alerts, real-time scanning, and analytical tools:
1. Real-Time Alerts & Scans
Trade Ideas continuously scans the market and sends instant alerts when price action meets specific criteria (like crossing key resistance levels or unusual volume spikes). This lets you react quickly without staring at charts all day.
2. Custom Breakout Filters
Use alerts like Channel Breakout or High Volume Moving Average Breakouts to focus only on moves with statistical significance and real participation, helping reduce noise and false signals.
3. Pattern Recognition at Scale
Automate technical pattern detection, including breakouts and key setups, so you can find high-probability setups across the entire market without manually scanning symbols one by one.
4. Volume & Momentum Filters
Combine alerts with custom volume thresholds or momentum filters to ensure breakouts have participation behind them, a core principle for distinguishing real moves from false breakouts.
5. AI-Driven Insights (Holly)
Trade Ideas’ AI engine, Holly, evaluates thousands of scenarios and highlights setups that statistically have stronger follow-through potential. Pairing CAR alerts with AI confirmations can significantly improve signal quality.
6. Backtesting & Refinement
Test your breakout strategies against historical data to see how they would have performed, helping you build confidence before risking capital.
Why This Helps
Unlike generic platform indicators, Trade Ideas gives you actionable alerts, market-wide scanning, and analytical depth, letting you pre-filter noise and focus only on breakouts with conviction.
You can tailor each tool to your style; whether you’re a momentum trader, day trader, or swing trader, making it easier to separate true breakouts from false ones and improve your entry timing overall.
Managing Breakout Trades After Entry
Identifying a breakout is only the first step. What separates consistent traders from frustrated ones is how they manage the trade after entering.
Breakouts can move quickly, stall, or reverse without warning. Having a clear exit plan helps traders protect capital, lock in gains, and avoid emotional decisions when price action changes.
1. Use the Breakout Level as a Risk Reference
A common approach is to place a stop just below the former resistance level.
If the breakout is valid, the price should hold above that area. A move back below resistance often signals a failed breakout or weakening momentum. This gives traders a logical, technical exit point rather than guessing.
2. Adjust Stops as Price Moves Higher
As price continues higher, many traders trail their stops to reduce risk and protect gains.
Trailing stops allow traders to:
- Stay in strong trends longer
- Lock in profits without predicting the top
- Exit automatically if momentum fades
Trade Ideas alerts can help traders monitor these levels without constantly watching charts.
3. Define Profit Zones in Advance
Some traders prefer predefined profit targets to remove emotion from decision-making. Common approaches include:
- Risk-to-reward targets (such as 2:1 or 3:1)
- Prior swing highs or key price levels
- Measured moves based on the prior range
Planning exits before entering helps traders stay disciplined during fast breakout moves.
4. Have Rules for Failed Breakouts
Not every breakout works, and that’s normal.
When price falls back below resistance after a Crossed Above Resistance alert, many traders choose to:
- Exit quickly to limit losses
- Avoid re-entering until a new setup forms
- Reduce position size in choppy conditions
Clear rules help prevent small losses from turning into larger drawdowns.
5. Monitor Volume and Momentum for Exit Signals
Volume and momentum don’t just matter for entries, they matter for exits too.
Warning signs often include:
- Price stalling while volume fades
- Momentum is slowing after an initial surge
- Sharp rejection candles near highs
Trade Ideas users can combine price alerts with volume and momentum filters to recognize when a breakout is losing strength.
Crossed Above Resistance vs False Breakout: Key Takeaways for Traders
A Crossed Above Resistance alert signals a potential opportunity, not guaranteed continuation. Some price moves develop into strong trends, while others fail quickly and turn into false breakouts that reverse back into the prior range.
The difference depends on price behavior after the break. Price holding above resistance, strong volume and participation, successful retests, and supportive market momentum point to a valid breakout. Traders who wait for confirmation can filter false breakouts and focus on higher-quality setups.
Frequently Asked Questions
What does Crossed Above Resistance mean in trading?
Crossed Above Resistance means price moves above a previously defined resistance level, which signals a possible breakout but does not guarantee continuation.
Is Crossed Above Resistance the same as a breakout?
No. Crossed Above Resistance only shows that the price crossed a key level. A breakout becomes valid only when the price holds above that level with follow-through.
What is a false breakout in trading?
A false breakout occurs when the price breaks above resistance or below support but quickly reverses and returns to the prior trading range.
Can a Crossed Above Resistance signal turn into a false breakout?
Yes. When the price fails to stay above resistance after the alert, the move often becomes a false breakout.
How can traders tell if a breakout is real or false?
Traders watch for price holding above resistance, strong volume, and continued momentum. Failure in any of these areas often signals a false breakout.
Why do false breakouts trap traders?
False breakouts trigger early entries without real participation. When the price reverses, trapped traders exit, which pushes the price back into the range.
Does volume matter after Crossed Above Resistance?
Yes. Rising volume supports a real breakout. Weak or falling volume often points to a false breakout.
Should traders wait after a Crossed Above Resistance alert?
Yes. Waiting for confirmation or a successful retest helps traders avoid false breakouts and improve entry timing.
Why does price cross above resistance and then reverse?
Price often reverses when market conditions weaken, momentum fades, or buyers fail to support higher prices.
Are false breakouts more common in certain markets?
False breakouts appear more often in low-volume, sideways, or highly volatile markets without a clear trend.