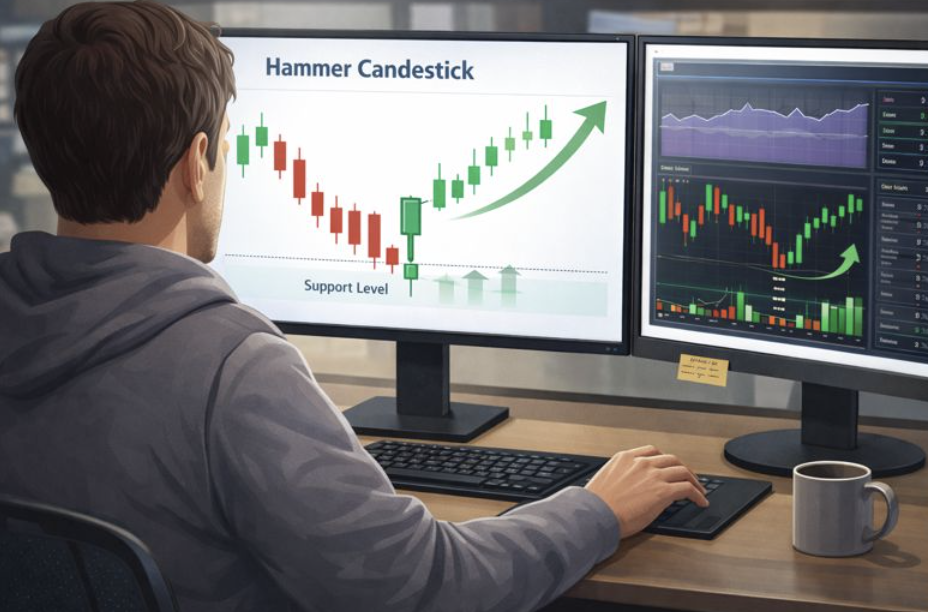
Hammer Candlestick Pattern: How to Identify and Trade Bullish Reversals
Hammer Candlestick Pattern: How to Identify and Trade Bullish Reversals
Late reversal entries are where traders bleed.
You see a price bounce, you chase it, your stop sits right under the low, and the market taps it before running.
The Hammer candlestick helps you catch reversals early, but only if you know what a real Hammer looks like and how to trade it with rules.
This guide is built like a trading playbook, not a textbook.
By the end, you’ll be able to:
- Spot valid Hammers in seconds,
- Filter weak ones,
- Enter with precision,
- Place stops where they make sense,
- And avoid the false signals most traders lose money on.
Let’s get into it.
What Is a Hammer Candlestick Pattern?
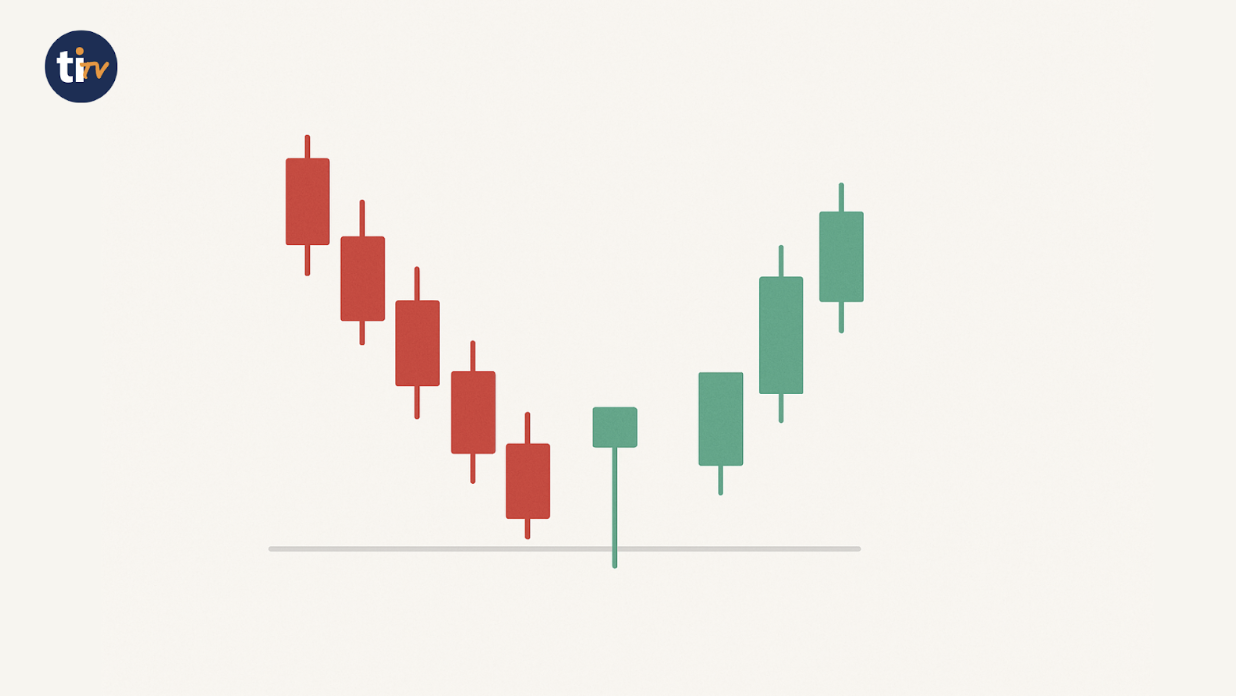
A Hammer is a single-candle reversal signal that appears after a downtrend.
It tells a simple story:
- Sellers drive the price down hard,
- Buyers step in aggressively,
- Price closes back near the open, rejecting lower levels.
A valid Hammer has 3 features:
- Small body near the top
(close is near the open = buyers resisted selling)
- Lower wick at least 2× the body
(price was pushed down and rejected)
- Little to no upper wick
(buyers controlled the end of the session)
If those aren’t present, it’s not a Hammer. It’s just a candle.
Quick Hammer Checklist (Save This)
Before you even think about trading it, confirm:
✅ Trend: Clear downtrend before the Hammer
✅ Wick: Lower shadow ≥ 2× body
✅ Close: Near the top of the candle
✅ Location: At/near a real support zone
✅ Confirmation: Next candle closes above Hammer high
✅ Bonus: Volume spike / RSI oversold
If 2–3 of these are missing, skip it.
Key Differences You Need To Know
Green vs Red Hammer (Does Color Matter?)
Short answer: yes, but structure + context matter more than color.
Both green and red Hammers can signal a bullish reversal if they form after a downtrend.
1. Green Hammer (bullish close)
A green Hammer closes above its open.
That means buyers not only rejected the low, but they also won the close.
What it usually implies:
- Stronger buyer conviction
- A higher chance of follow-through
- Cleaner confirmation setups
You can treat this as the “ideal” Hammer.
2. Red Hammer (bearish close)
A red Hammer closes below its open.
Buyers still rejected the low, but sellers fought back into the close.
What it usually implies:
- Still valid if wick + location are perfect
- Weaker than a green Hammer
- Needs stronger confirmation next candle
Practical rule traders use:
- Green Hammer = 1 confirmation is enough (close above the high)
- Red Hammer = 2 confirmations are better (next candle closes above high + volume/RSI support)
If you see a red Hammer in a weak location, skip it.
Red Hammers are “earned setups,” not automatic buys.
Hammer vs Hanging Man (Same Shape, Different Meaning)
This is the #1 visual trap in candlestick trading.
They look the same; the trend decides the meaning.
| Pattern | Appears after | Market meaning |
| Hammer | downtrend | bullish reversal |
| Hanging Man | uptrend | bearish reversal |
How to avoid mixing them up:
Before labeling the candle, ask:
“What was price doing before this candle formed?”
- If price was falling and hitting support → Hammer
- If the price was rising near resistance → Hanging Man
Practical mindset:
Same candle. Opposite context. Opposite trade idea.
So never trade the shape alone. Trade the trend + location + confirmation.
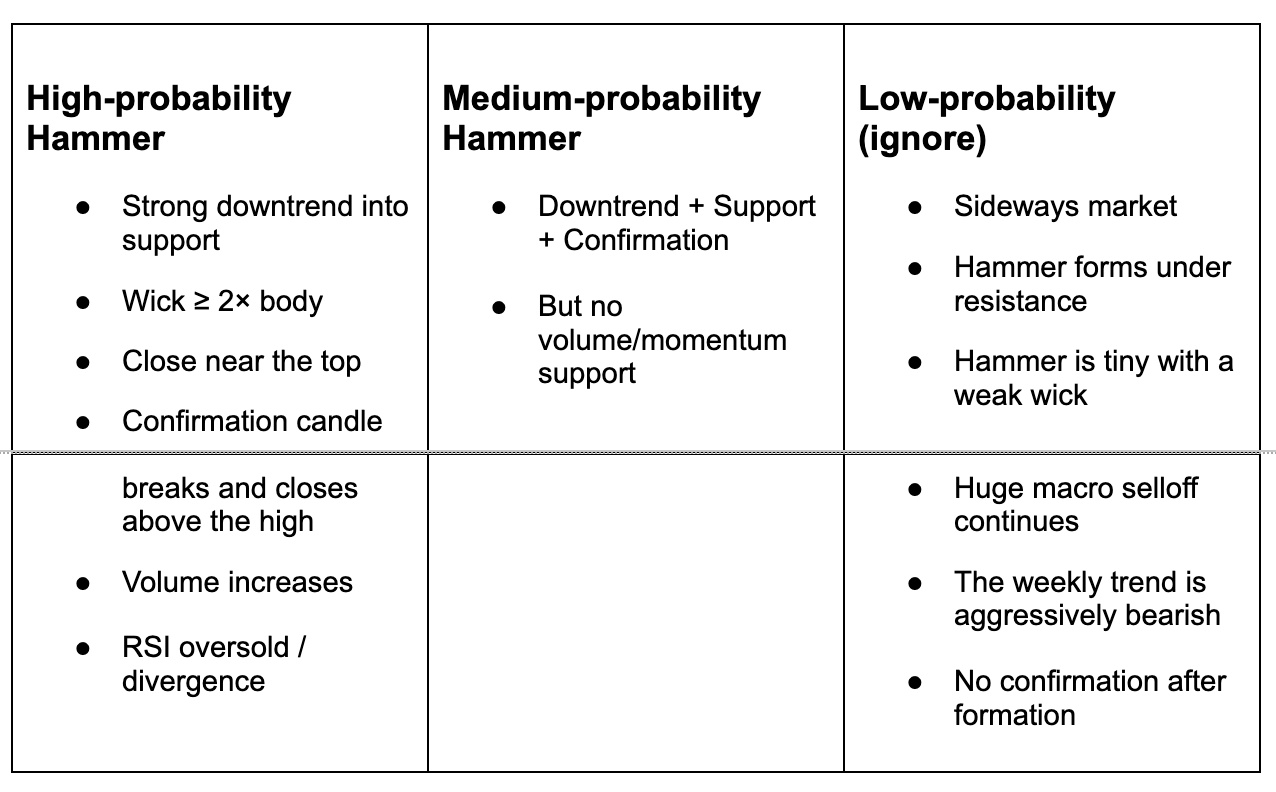
How Reliable Is the Hammer Candlestick Pattern?
A Hammer is reliable only in the right environment.
On its own, it’s just a rejection candle.
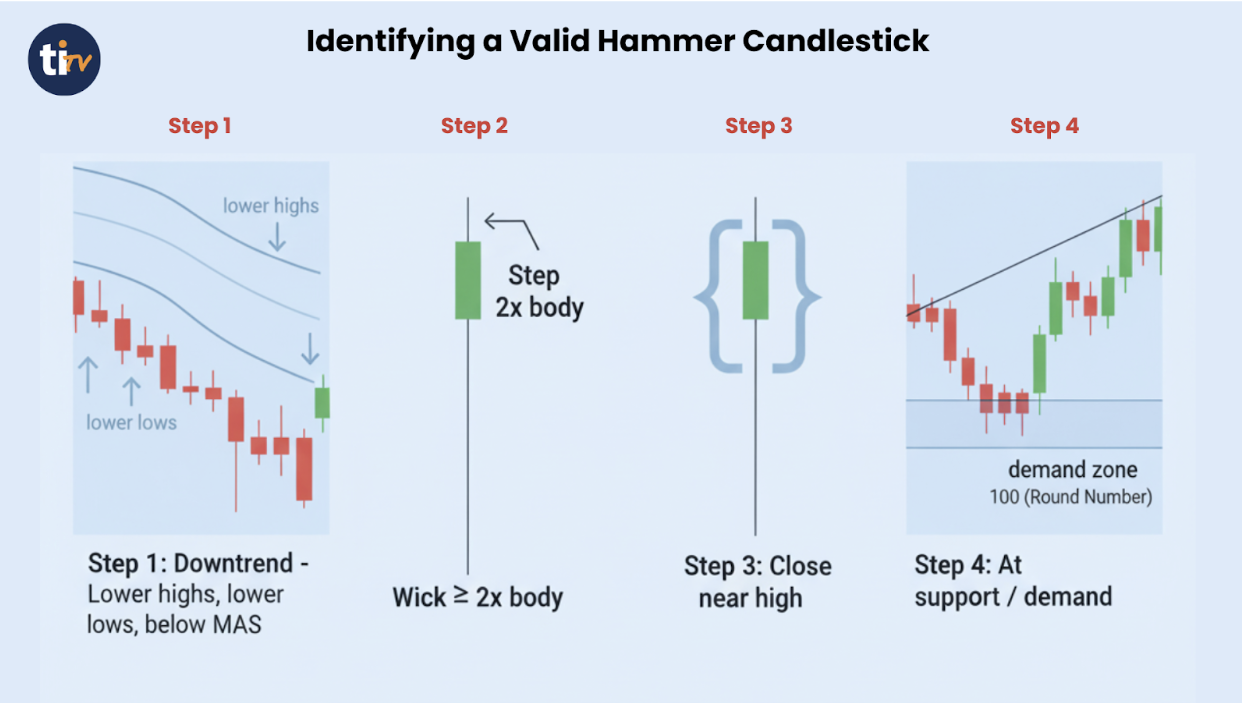
How to Identify a Valid Hammer Candlestick
Not every small candle with a wick is a true Hammer. A valid Hammer candlestick must meet specific conditions.
Step 1: Check the trend first
Ask yourself:
- Are we making lower highs + lower lows?
- Did the price fall for at least 3–5 candles?
- Are we below key moving averages?
No downtrend = no Hammer signal.
Step 2: Measure the wick
Lower wick should be 2× body minimum.
Quick eye test: If the body is 1 part, → wick should look like 2–3 parts.
Step 3: Ensure close is near the top
A Hammer closing mid-range is weak.
A Hammer closing near highs = strong rejection.
Step 4: Mark the location
A Hammer in the middle of nowhere is noise.
Great places for Hammers:
- Previous swing low
- Demand zone
- Round number
- Daily/weekly support
- Trendline/channel low
How to Trade Bullish Reversals Using the Hammer Pattern
Identifying the Hammer is only half the work. Execution is what makes you money.
Here is a simple step-by-step trading model.
Step 1: Wait for the Downtrend
Look for:
- Lower lows
- Lower highs
- Strong bearish candles
You want exhaustion, not random pullbacks.
Step 2: Identify the Hammer
Confirm:
- Long lower wick
- Small body near the top
- Located at or near a support zone
Bonus confirmation if RSI is oversold.
Step 3: Entry Strategy
There are two safe ways to enter:
Aggressive Entry
- Buy at the open of the next candle
Conservative Entry
- Wait for the price to break above the Hammer’s high
Most professional traders prefer the conservative method.
Step 4: Stop Loss Placement
Your stop loss should be placed:
- A few pips below the Hammer’s low
This protects you if the market continues to be bearish.
Step 5: Take Profit Targets
Good profit methods include:
- Nearest resistance level
- 1:2 risk-to-reward ratio minimum
- Previous swing highs
Real Use Cases of Hammer Candlestick in the Market
Let’s look at how this pattern plays out in real market scenarios.
Use Case 1: Hammer in Currency Markets (EUR/USD Example)
During major economic uncertainty, EUR/USD dropped sharply over several sessions.
At a previous support zone:
- RSI was oversold
- Sellers pushed the price down.
- Buyers strongly rejected the lower price.
A Hammer formed.
The next candle broke above the Hammer’s high, triggering a long entry. Over the next three sessions, the price moved aggressively upward, delivering a clean bullish reversal.
This is how professional traders use the Hammer, not in isolation, but combined with structure and confirmation.
Use Case 2: Hammer Pattern in Stocks Before Earnings
In stocks, the Hammer often appears before major sentiment shifts.
Example scenario:
A high-growth stock sells off in anticipation of earnings. Panic selling increases volume. Then:
- A Hammer forms near a long-term support zone
- Volume spikes
- The next day opens bullish.
This often leads to short-term bullish reversals known as relief rallies.
Many competitors in trading education, such as Investopedia and BabyPips, highlight this exact setup as a classic reversal structure.
Use Case 3: Cryptocurrency Trading Use Case
Crypto markets are highly emotional and volatile, making hammer patterns even more frequent.
Bitcoin and Ethereum regularly form hammer candles near major support zones after sharp corrections.
Example:
- Bitcoin drops sharply due to negative news.
- A hammer forms on the 4-hour or daily chart.
- Whale buying is spotted through increased volume.
- Price begins to reverse upward.
Crypto-focused platforms like Cointelegraph often analyze hammer patterns as early signs of market recovery.
Use Case 4: Hammer + Santa’s Rally Strategy.
One of the most powerful seasonal confirmations for the Hammer pattern is Santa’s rally.
What Is Santa’s Rally?
Santa’s rally refers to the historical tendency of markets (especially stocks and indices) to rise during the last 5 trading days of December and the first 2 trading days of January.
This period is known for:
- Thin liquidity, with fewer market participants active, causes sharper price swings and allows smaller volumes to drive stronger, faster market movements.
- Optimistic market sentiment, as traders and investors feel positive about the year ahead, increases buying pressure and reduces fear-driven selling behavior.
- Institutional positioning, in which large funds adjust their holdings before year-end, often adds upward pressure on well-performing stocks and market indices.
- End-of-year portfolio rebalancing, as investors buy outperforming assets and sell weaker ones to align portfolios with performance and risk targets before the new year begins.
How the Hammer Fits into Santa’s Rally
When a Hammer candlestick forms in mid to late December after a short market pullback, it becomes a powerful signal.
Example setup:
- Market pulls back in early December
- Panic selling creates a sharp drop.
- Hammer forms near key support
- RSI shows oversold
- The timing aligns with Santa’s rally window.
This setup has historically produced strong bullish reversals in indices like the S&P 500 and Nasdaq.
Professional traders actively watch for Hammer formations during this seasonal window.
4 Common Mistakes Traders Make With the Hammer Pattern
Even though the pattern looks simple, many traders misuse it.
Here are the most common errors:
1. Trading the Hammer Without Confirmation
Entering a trade immediately without waiting for a strong bullish confirmation candle often leads to false signals and unnecessary losses.
2. Ignoring Volume
High-quality bullish reversals are usually supported by strong trading volume, while weak volume often indicates that the buying pressure is not real.
3. Using It in Sideways Markets
The Hammer pattern performs best after clear downtrends, and in choppy or sideways markets, its reliability drops significantly.
4. Forgetting the Bigger Trend
A Hammer on a short timeframe, such as 5 minutes, is far less reliable when it occurs against a strong higher-timeframe downtrend.
Best Indicators to Combine With Hammer Candlestick
To improve accuracy, combine the Hammer with:
- RSI (Relative Strength Index) → Look for oversold below 30
- Support and Resistance Levels
- Moving Averages (50/200 EMA)
- Volume Indicators
The Hammer is most powerful when multiple confirmations align.
Technology and Tools for Identifying Hammer Patterns
Spotting a Hammer on one chart is easy.
Spotting high-quality Hammers early, across dozens of tickers and timeframes, is where most traders fall behind.
That’s why modern traders don’t rely on manual scanning anymore; they use tools that:
- Scan the whole market for them,
- Flag valid Hammer candidates instantly,
- Let them test the setup statistically,
- And trigger alerts when the second confirmation happens.
Let’s break down what that looks like in a real workflow.
1. Real-Time Market Scanning (Find the Hammer Before Everyone Else)
The biggest edge with Hammer trading is timing.
If you notice it late, you’re buying into the bounce instead of the reversal.
So professional traders use scanners that monitor the entire market in real time and surface Hammer setups as they form. Platforms like Trade Ideas are built specifically for that, scanning thousands of stocks continuously, not just your watchlist.
How traders use this in practice:
- Run a Hammer scan on higher timeframes (4H / Daily).
- Let the scanner bring you 10–20 candidates.
- Manually filter using your checklist (trend → support → confirmation).
This removes 90% of the chart-scrolling fatigue.
2. Candlestick-Specific Hammer Alerts (Automatic Detection)
Instead of guessing, traders often set pattern-specific alerts that only trigger when a textbook Hammer closes.
Trade Ideas provides dedicated Hammer alerts by timeframe (example: their “5-minute Hammer” alert), and the system only reports the Hammer after the candle closes, because the close is what validates the pattern.
Why this matters:
- You’re not reacting mid-candle,
- You’re getting the signal when it’s actually valid,
- And you can stack it with trend + support filters.
In other words, the tool finds the candle, and you judge the trade.
3. Custom Filters (So You Control the Definition)
One reason traders distrust candlestick scanners is that many tools label weak candles as patterns.
Higher-grade platforms let you tighten the definition:
- Wick ≥ 2× body
- Close near the highs
- Only after X bearish candles
- Only at support zones
Trade Ideas alerts and scans can be customized with filters, so the Hammer you get flagged is closer to your rulebook, not a generic one.
That’s how you reduce false signals without missing real reversals.
4. Backtesting (Know the Odds Before You Risk Money)
This is where Hammer trading shifts from “pattern spotting” to repeatable edge.
Instead of assuming Hammers work, traders test them. Trade Ideas includes OddsMaker, an event-based backtesting tool that lets you test alerts like Hammers across historical data to see what actually performs.
Simple backtest idea you can mention:
- Rule: Hammer at support + confirmation close above high
- Test the last 50–100 occurrences
- Track win rate + average R multiple
Backtesting turns Hammer trading into probability, not hope.
5. AI Trade Assistants (Extra Confirmation Layer)
After you identify a Hammer, the next question is always:
“Is this reversal worth trading right now?”
Some traders use AI engines as a second filter.
Trade Ideas’ AI system, Holly, is designed to surface high-probability setups based on historical behavior and real-time conditions.
You’re still the decision-maker, but AI helps answer:
- Is momentum shifting?
- Is this stock behaving like past reversal winners?
- Is the timing clean or choppy?
Used correctly, it’s a confidence boost, not a crutch.
The Right Way to Use Tools (One Line Rule)
Automation finds the Hammer. Your checklist decides the trade.
Tools should speed up discovery and testing, but trend, support, and confirmation are still your edge.
When you combine both, Hammer trading becomes a clean, repeatable system instead of manual guesswork.
Final Thoughts: Trading the Hammer With Precision
The Hammer isn’t magic.
It’s a signal of rejection, not a guarantee.
Used alone, it’ll trick you.
Used with trend + support + confirmation, it helps you enter reversals before the crowd and manage risk like a pro.
If you want to master it fast:
- Mark 20 historical Hammers on daily/4H charts
- Record which ones worked and why
- You’ll build real pattern intuition in a week.
Related Reads
5 Minute Bullish Engulfing Alert
15 Minute Piercing Pattern Alert
FAQs About Hammer Candlestick Pattern
1. What exactly is a Hammer candlestick, and how do I recognise one?
A Hammer is a single-candle pattern that appears after a downtrend: it has a small real body near the top, a long lower shadow at least twice the body’s size, and little to no upper shadow.
2. When is a Hammer pattern valid, and when should it be ignored?
A Hammer only carries meaning when it appears after a clear downtrend in sideways markets or uptrends; similar-looking candles usually don’t signal a reversal.
3. Does a Hammer always guarantee a bullish reversal?
No. The Hammer alone is not a guarantee. Its reliability improves when combined with additional confirmation tools like volume spikes, support/resistance levels, or momentum indicators.
4. What should I do after a Hammer appears — when should I enter, set stop-loss, and targets?
Wait for a confirmation candle (a bullish candle that closes above the Hammer’s high) before entering a trade. Then set stop-loss just below the Hammer’s low and target either nearest resistance or a favorable risk-to-reward ratio.
5. Can Hammer patterns work on all timeframes and in all markets (stocks, forex, crypto)?
Yes. The Hammer pattern can appear on different timeframes and across asset classes (stocks, forex, crypto). However, shorter timeframes and highly volatile markets tend to produce more false signals, so extra caution and confirmation are advised.
6. How Beginners Can Practice Trading the Hammer Pattern?
Beginners can practice by using demo accounts, backtesting historical charts, saving screenshots of clean setups, and journaling trade outcomes. This builds pattern recognition, improves discipline, and strengthens confidence without risking real money.
7. Why the Hammer Candlestick Still Works in Modern Markets
Some traders think candlestick patterns are outdated. But they’re not. Institutions, hedge funds, and algorithmic models still use price action as a foundation. Even AI-powered systems scan for structures like the Hammer because human psychology still drives markets.