5 Critical Market Indicators Every Day Trader Should Know
5 Critical Market Indicators Every Day Trader Should Know
By: Shane Neagle
Are you curious about how certain day traders consistently navigate through the stock market’s unpredictable fluctuations? The world of day trading, where rapid changes can lead to significant gains or losses, necessitates something beyond just an instinct for spotting chances. It’s about a thorough grasp of market indicators. These indicators do more than just assist in trading; they serve as vital navigational aids, helping traders chart their course in the often-stormy waters of the stock exchange.
This understanding is similar to learning a new language. Each market indicator, much like individual words and phrases, has its own specific meaning and application in the context of trading. They offer crucial insights into the market’s dynamics, uncovering trends and potential pivot points that might otherwise be missed. For day traders, gaining this knowledge isn’t just an advantage—it’s a critical component for enduring success and profitability.
We explore the nuances of the most important market indicators in the article below. Every subject, from the commonly used Moving Averages to the sophisticated interpretations of the MACD, is designed to improve your trading knowledge. These insights will provide you the tools to make more planned and well-informed judgments, whether you are an experienced trader or a novice, turning day trading from a reckless hobby into a methodical art.
Moving Averages
In the complex terrain of day trading, the use of moving averages is critical in guiding strategic decisions. These averages efficiently condense the unpredictable character of price data across certain time periods, providing a better grasp of the market’s directional momentum. Day traders mostly use two types of moving averages: the simple moving average (SMA) and the exponential moving average (EMA).
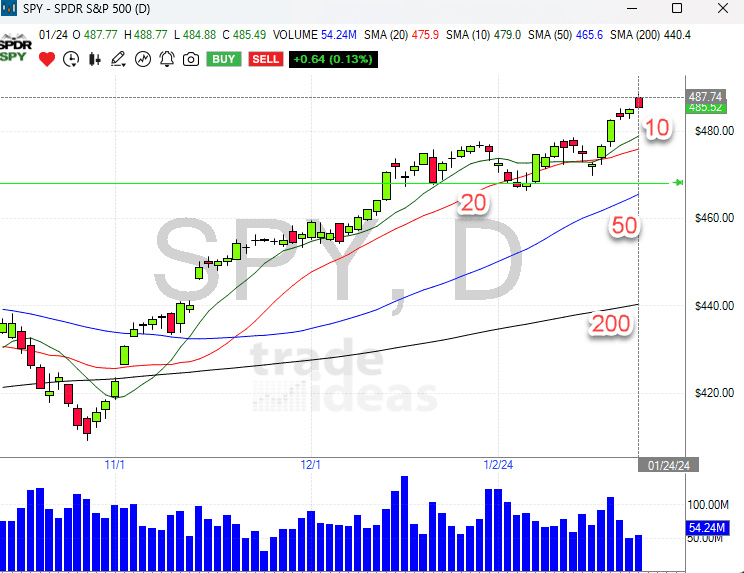
The arithmetic mean of a security’s price over a certain time period is called the Simple Moving Average (SMA). Let’s take a look at a 20-day simple moving average (SMA), which is calculated by squaring the closing prices for the preceding 20 days. This strategy evenly balances each price point over time, providing a reliable metric for evaluating wider market patterns. The SMA is a vital indication of the market’s long-term trend.
On the other hand, recent price movements are given more weight by the Exponential Moving Average (EMA). Traders that prioritize early trend recognition find the EMA to be a popular tool because of its improved sensitivity to incoming market information. While a declining EMA can portend a future decline, a rising EMA frequently denotes an upward market trend.
Both the SMA and the EMA are important indicators of future market reversals. The price of a securities crosses its moving average, which often denotes a change in market momentum. One may consider a price above its SMA or EMA to signal the beginning of an upward trend and a potential buying opportunity. In contrast, a price that falls below the moving average may signal a negative trend, implying a selling approach.
Additionally, a thorough analysis is done of the interaction between short- and long-term moving averages. A “golden cross“, often seen as a bullish indication, is formed when a short-term moving average cross-overs over a long-term one. A “death cross“, which occurs when a short-term EMA falls below a long-term one, is a warning indication.
In summary, day traders must utilize SMA and EMA with skill. These indicators provide light on both past and future trends in the market in addition to revealing patterns that are already in place. A comprehensive understanding and use of these moving averages is essential for traders to make timely, well-informed decisions in the turbulent world of day trading.
Relative Strength Index (RSI)
In the intricate dance of day trading, understanding the rhythm of the market is key. Enter the Relative Strength Index (RSI), not just any indicator, but a critical momentum oscillator that serves as a trader’s pulse checker for the market’s speed and price movements. The RSI, a brainchild of J. Welles Wilder Jr., isn’t merely a numerical gauge; it’s a strategic ally in decoding market behaviors.

Residing in a range between zero and 100, the RSI offers a window into the market’s soul. Picture this: when the RSI climbs above 70, it’s often whispering that the market might be getting a tad overenthusiastic, hinting that a security might be overbought. It’s like a subtle nudge suggesting the asset could be primed for a price correction. On the other end of the spectrum, an RSI dipping below 30 tends to signal an oversold condition, pointing to a potential undervaluation and hinting at an upcoming rise.
But the RSI’s narrative extends beyond these high and low extremes. Its real prowess lies in uncovering divergences – instances where the price trend and the RSI seem to be telling different stories. Imagine a scenario where a stock is reaching new highs, but the RSI isn’t joining the party and fails to hit new peaks. This divergence can be a harbinger of a cooling trend, potentially signaling a future price drop.
The RSI also plays a critical role in identifying ‘failure swings.’ These are the moments that can flag an impending shift in market direction. A failure swing above 70 often foreshadows a selling opportunity, while one below 30 might suggest it’s time to consider buying. These aren’t random market blips; they’re calculated cues for forthcoming action.
Of course, savvy traders know that the RSI isn’t a standalone oracle. It’s most effective when used in concert with other indicators and market analysis techniques, forming a more complete picture of market conditions.
In essence, the RSI is much more than a technical tool – it’s a strategic lens for viewing market momentum. By highlighting overbought or oversold conditions, and skillfully pointing out divergences and failure swings, the RSI becomes an indispensable part of a trader’s arsenal, empowering them to navigate the market’s ebbs and flows with greater acumen.
Volume
The Volume indicator is an essential tool for day traders as it provides insight into the strength and weakness of market movements. The total number of shares or contracts exchanged within a certain period of time is essentially represented by volume. It provides insights into the strength of price changes and is more than simply a number—rather, it is the voice of the market.
Volume can support or contradict the strength of a trend that other indicators seem to be pointing toward. A rising price combined with increased volume is a positive indication that suggests real interest and a trend that is consolidating. On the other hand, if prices increase but volume declines, it may indicate a lack of confidence and may indicate an unsustainable trend.
But volume analysis isn’t limited to confirming market patterns. When thinking about the effects of capital gains tax, particularly in the context of short-term trading, day traders must also address volume. Days with high volume typically result in more deals occurring. Remember that the earnings from these transactions are usually considered short-term capital gains, and that the tax treatment of short-term vs long-term assets differs. Short-term profits are subject to ordinary income tax, which might result in a larger tax burden for the trader than long-term profits, which enjoy reduced tax rates.
This tax aspect underscores the importance of being volume-aware. A savvy day trader not only looks at volume for market insights but also keeps an eye on their trading frequency and resultant tax implications. As such, understanding your volume patterns can be a key factor in strategic trading and tax planning.
Returning to the practical applications of the Volume indicator, let’s consider volume spikes. These sudden increases in volume can be indicative of significant market events or shifts. For instance, a volume spike accompanying a breakout from a resistance level might indicate a strong buying opportunity. Conversely, a spike in volume during a price decline could signal a potential sell-off and an opportunity to exit a position.
In summary, volume serves as a double-edged sword in day trading. Not only does it validate price trends and offer strategic trading insights, but it also plays a crucial role in the financial aspects of trading, such as tax implications. For the day trader, mastering the art of volume analysis is key to navigating both the market waves and the subtleties of trading profitability.
Bollinger Bands
Developed in the 1980s, Bollinger Bands stand out as an essential tool for managing market volatility and spotting possible breakout opportunities, and traders have been using it to interpret market activity ever since.
The three lines that make up Bollinger Bands are a central Simple Moving Average (SMA) and two standard deviation lines that are positioned above and below the SMA. The stock price is surrounded by a dynamic border created by this setup, which reflects the ebb and flow of the market. The bands shrink during calmer times, suggesting that the market is in a state of relaxation, and broaden during times of extreme volatility, suggesting that the market is taking a deep breath.
These bands are closely watched by traders for a number of reasons. A potential retraction is sometimes hinted at when stock prices approach or cross the upper band, indicating that the market may be about to enter overbought condition. On the other hand, if prices approach or drop below the lower band, it might be a sign of an oversold situation and possibly an impending price recovery.
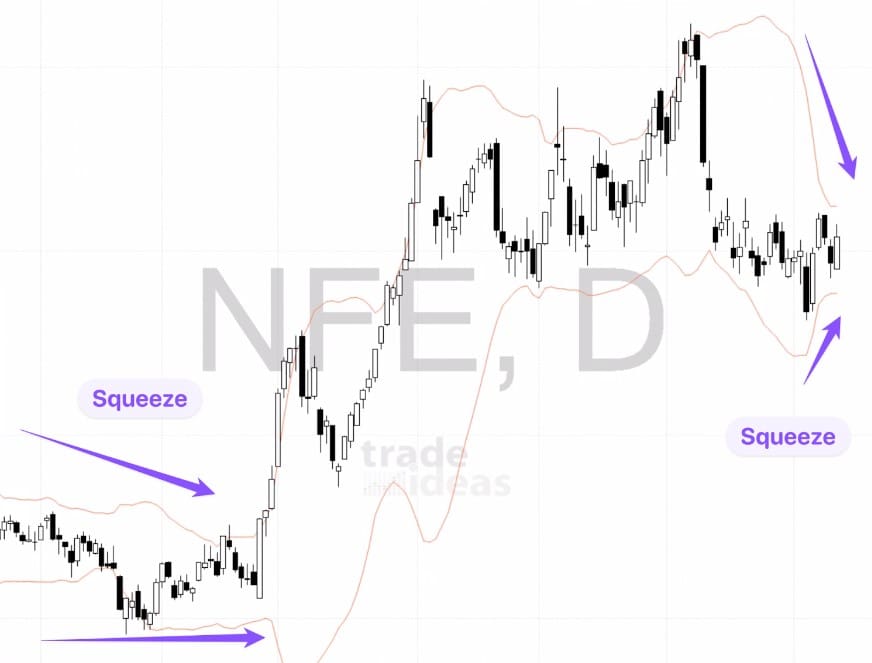
Still, a trader is sometimes drawn in by the nuances in these bands’ behavior. The ‘squeeze’ is a crucial situation in which the bands narrow around the SMA, indicating a decrease in volatility and frequently portending a big price shift. The calm before the storm is a crucial sign for traders, who believe that the squeeze’s release might signal the start of a new trend in the market, either bullish or negative.
Furthermore, Bollinger Bands are often utilized in conjunction with other market indicators to support or contradict upcoming trading choices. For instance, a breakthrough from the bands accompanied by an increase in trading volume might give a trader more assurance in their chosen course of action.
MACD (Moving Average Convergence Divergence)
The MACD is an important indicator that gives traders a better understanding of market patterns and momentum. Moving Average Convergence Divergence (MACD), which Gerald Appel developed in the 1970s, is an essential component of a trader’s approach as it helps reveal the underlying story of the market.
The two main lines that comprise MACD are the signal line and the MACD line. It functions as follows: the difference between the 12- and 26-period EMAs is used to calculate the MACD line. The signal line, which is just the MACD line’s 9-period EMA, is then drawn beside this line. The recent momentum of the market and its overall trajectory are having an ongoing dialog.
The magic occurs in the dance between these two lines—the MACD and the signal line. We refer to these exchanges as “crossovers.” A bullish flag, indicating a possible purchasing opportunity, may be waved when the MACD line swings above the signal line. However, if the MACD falls below the signal line, this can be a bearish nudge that suggests a selling opportunity.
The MACD’s observations, however, go beyond crosses. It is very adept at identifying “divergence.” Let’s say that the stock price is rising to unprecedented levels, but the MACD isn’t reflecting this energy. This difference may indicate that the present trend is losing momentum and might portend a trend reversal.
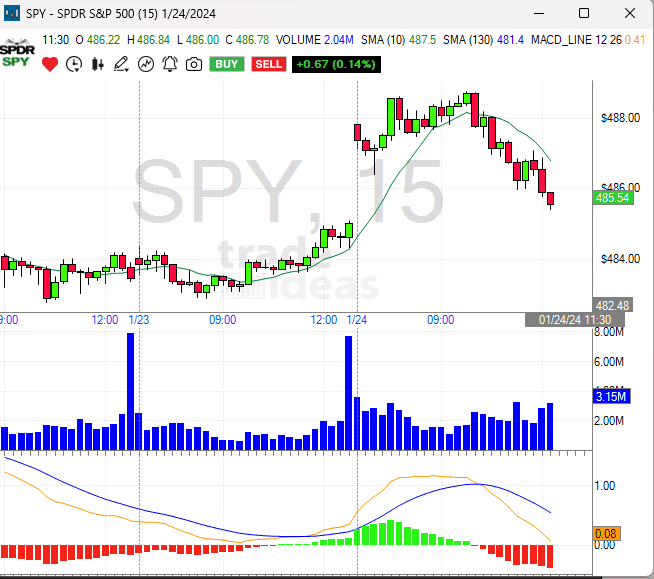
The difference between the MACD line and the signal line around a zero line is plotted on the MACD histogram, which provides a visual aid. This histogram climbs higher as momentum fluctuates over time. It provides a rapid impression of the strength of the momentum, much like a visual heartbeat of the market.
In conclusion, the MACD is not only a trend-follower. This indicator is subtle and provides information on possible trend reversals, trade timing, and market momentum. The MACD is a priceless tool for traders who can navigate the intricate currents of the stock market if they know its language.
Conclusion
Wrapping up, it’s clear that the array of indicators like Moving Averages, RSI, Volume, Bollinger Bands, and MACD isn’t just a cluster of tools; they’re the trader’s compass. They do more than just crunch numbers – they peel back layers of the market, offering a deeper understanding of its movements. For anyone diving into day trading, these indicators are like guides, helping to navigate through market complexities with more confidence and clarity.
The real magic happens when these indicators are woven together in a trading strategy. It’s not just about using them individually, but understanding how they complement each other. This combined approach provides a more rounded perspective of the market, enabling traders to make decisions with greater insight. In the ever-shifting landscape of the stock market, this holistic view is what sets apart successful trading strategies.
In essence, mastery in day trading comes down to how well these indicators are interpreted and applied. It’s an ongoing journey of learning and adapting, requiring a sharp eye for detail and a disciplined approach. Embracing these tools, traders can navigate the market’s ups and downs, aiming not just for fleeting successes, but for sustained, informed trading performance.