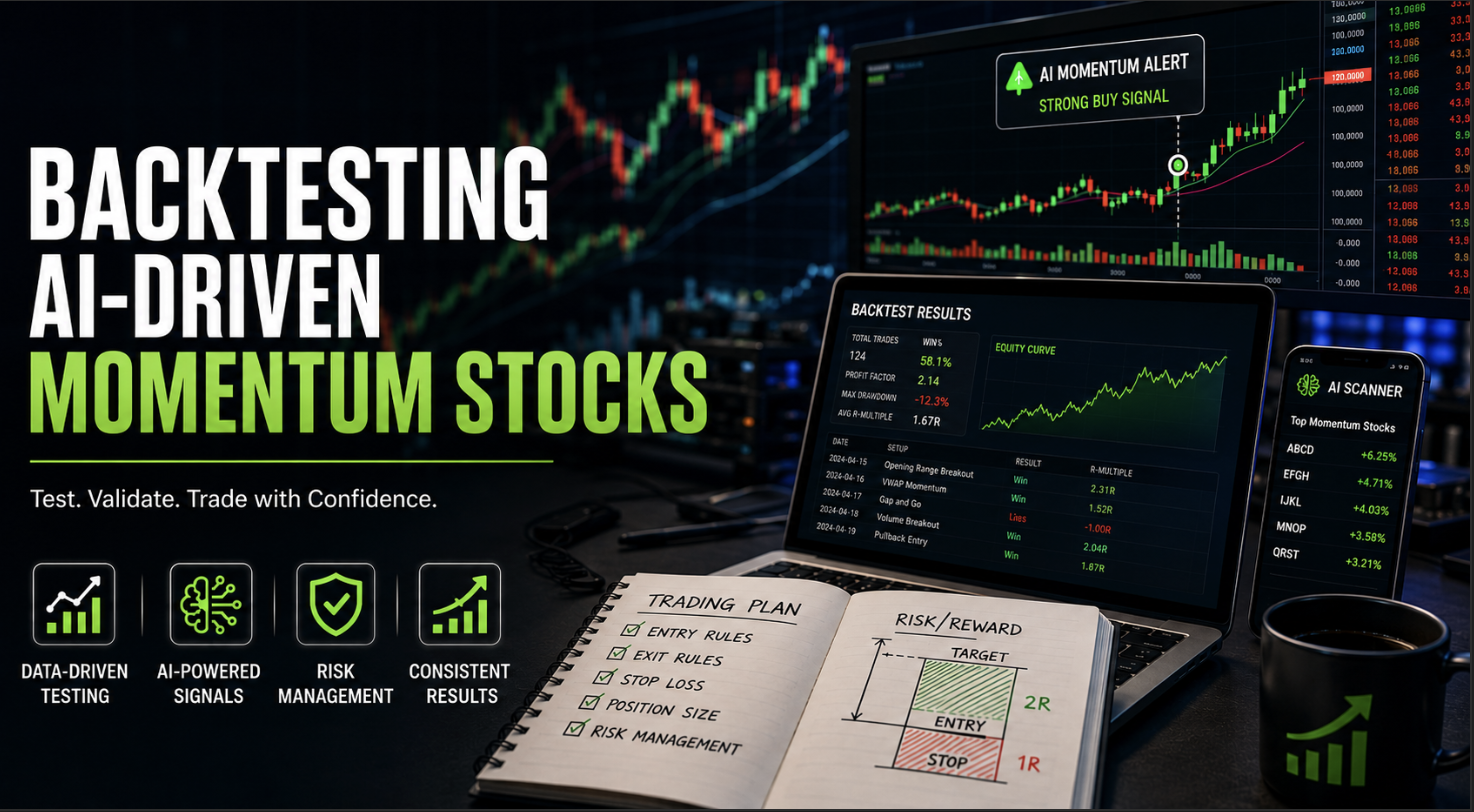
Backtesting Trading Strategies for AI-Driven Momentum Stocks
Backtesting Trading Strategies for AI-Driven Momentum Stocks
An AI momentum alert fires near the open, price jumps above VWAP, and the entry looks clean until the breakout slips, reverses, and turns a planned 1% risk trade into a larger loss.
A day trader sees the speed, a swing trader wonders if the move can hold for three sessions, and a risk-focused trader wants proof before sizing up. Backtesting trading strategies for AI-driven momentum stocks gives that proof only when the setup has written entries, exits, stops, and position size rules, especially for a momentum trading strategy driven by fast signals.
Here’s how to make it work.
When Should You Backtest AI Momentum Strategies?
Backtesting trading strategies for AI-driven momentum stocks works best when the signal can be reduced to repeated conditions. “AI likes this stock” is not testable. A useful setup needs price behavior, volume behavior, entry timing, stop placement, and exit logic that can be repeated across many examples.
Momentum stock tests are most reliable when the market has enough activity to create clear movement. Strong relative volume, tight spreads, and defined intraday structure make results easier to trust. Thin stocks, one-time news spikes, and wide spreads make the test weaker because historical signals may not match real execution.
Intraday and swing momentum also need separate tests. A five-minute opening range breakout faces slippage and speed risk. A three-day pullback trade faces overnight gap risk. Mixing them in one backtest creates results that look cleaner than the actual trade plan.
| Condition | Favors Backtesting | Avoid |
| Relative volume | Above 2.0x on active stocks | Low volume names with erratic fills |
| Spread | Less than 10% of planned stop distance | Wide spreads that distort entries and exits |
| Setup frequency | 30 or more historical examples where possible | One strong historical winner treated as a system |
| Market regime | Bull, bear, and sideways samples tested separately | One strong trend period only |
| Trade type | Intraday and swing samples separated | Mixed holding periods in one result set |
| Rule clarity | Written entry, exit, stop, and size rules | Vague AI score without execution rules |
Also Read: How Momentum Trading Works: A Beginner’s Guide
Why Does Risk Management Matter in AI Backtests?
AI-driven momentum backtests can look better than live execution when they assume perfect fills, ignore slippage, or size trades too aggressively. Momentum stocks often move quickly around breakouts. A test that enters at the exact trigger price and exits at the exact target can overstate the setup.
Risk management matters because the same signal can produce different account outcomes depending on share size and stop distance. A $25,000 account risking 1% per trade has a planned risk of $250. If the planned stop is $0.50, the position size is 500 shares.
If the breakout slips and the actual loss becomes $1.25 per share, the loss is $625. That is 2.5% of the account instead of the planned 1%. One trade did not break the system, but the backtest no longer matches the real risk.
| Account Rule | Planned Trade | Slipped Trade |
| Account size | $25,000 | $25,000 |
| Planned risk | 1%, or $250 | 1%, or $250 |
| Share size | 500 shares | 500 shares |
| Stop distance | $0.50 | $1.25 |
| Actual loss | $250 | $625 |
| Account impact | 1.0% | 2.5% |
The goal is not to avoid losses. Every momentum system has losing trades. The goal is to know whether the strategy still makes sense after realistic stops, slippage, losing streaks, and drawdown are included.
Which AI Momentum Backtesting Strategies Should You Test?
Each strategy below should be tested with the same discipline: entry rule, exit rule, stop-loss placement, position size, and risk-to-reward ratio. Risk-to-reward ratio means the planned profit compared with the planned loss. A 2:1 setup targets $2 of potential gain for every $1 risked.
1. Test an AI-Filtered Relative Volume Breakout
Best for: Active day traders testing intraday momentum stocks with unusual participation.
Entry rule: Enter when price breaks above the pre-market high or opening range high, relative volume is above 2.0x, and price is above VWAP.
Exit rule: Take partial profits at 2R. Exit the remaining position if price loses VWAP or forms a lower high after the breakout.
Stop-loss placement: Place the stop below the breakout candle low or 1x the five-minute Average True Range, whichever creates the smaller planned loss. Average True Range measures how much a stock typically moves during a period.
Position sizing: Risk 0.5% to 1% of account equity. If the stop is $0.40 and max risk is $200, share size is 500 shares.
Risk/reward ratio: Minimum 2:1. Reject the setup if the nearest target is less than 2R.
Risk warning: Breakout stocks can reverse quickly after the first push. Add slippage to the test before accepting the results.
2. Backtest Gap-and-Go Momentum Continuation
Best for: Stocks gapping up with high pre-market activity and clear opening structure.
Entry rule: Wait for the first 5-minute or 15-minute range to form. Enter only if price breaks above that range while holding above VWAP.
Exit rule: Take partial profits at 1.5R to 2R. Exit the rest on a close below VWAP or failed new high.
Stop-loss placement: Place the stop below the opening range low.
Position sizing: Risk 0.5% of account equity because gap stocks often have wider spreads and faster reversals.
Risk/reward ratio: Minimum 1.5:1 for partial exit and 2:1 for full-position targets.
Risk warning: Avoid testing gap stocks with weak pre-market volume. Poor liquidity can make the backtest too clean compared with real fills.
Pro Tip: Test gap-and-go setups with both five-minute and 15-minute opening ranges. The shorter range gives earlier entries, but the longer range can reduce false breakouts.
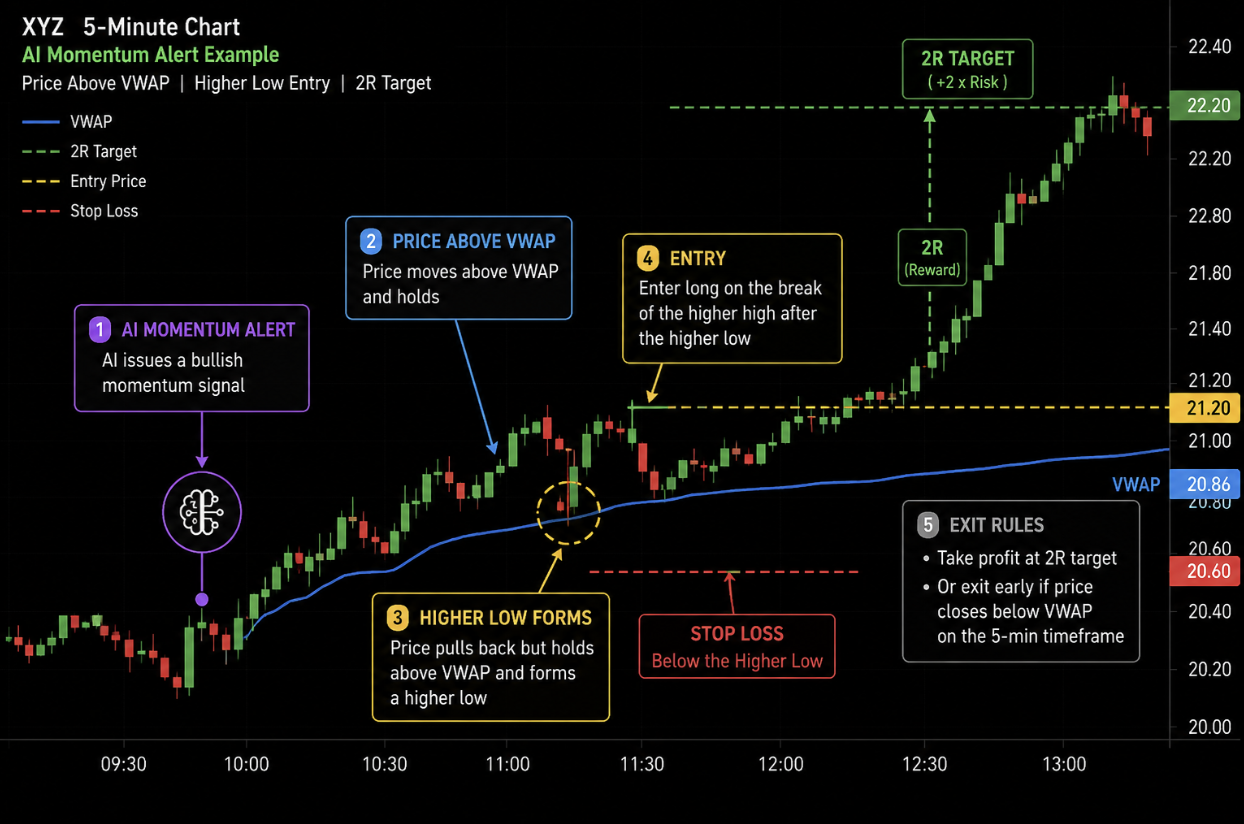
3. Test AI Signal Confirmation With VWAP
Best for: Traders who want an AI signal to confirm a setup, not replace the trade plan.
Entry rule: Enter only when an AI bullish signal aligns with price above VWAP and a higher low forms on the test timeframe.
Exit rule: Exit at 2R or when price closes below VWAP on the trade timeframe.
Stop-loss placement: Place the stop below the higher low that confirmed the setup.
Position sizing: Risk 1% maximum. Reduce to 0.5% if entry is more than 2% above VWAP because the trade may be extended.
Risk/reward ratio: Minimum 2:1.
Risk warning: A strong AI signal does not remove downside risk. If the stop is too wide for a 2R target, skip the trade in the backtest.
4. Backtest Multi-Day Momentum Pullbacks
Best for: Swing traders testing continuation after a strong move.
Entry rule: Stock pulls back to the 10-day or 20-day moving average after a momentum breakout, then closes back above the prior day’s high.
Exit rule: Target the prior momentum high or trail under the 10-day moving average.
Stop-loss placement: Place the stop below the pullback low or 1.5x daily ATR.
Position sizing: Risk 0.5% to 1% of account equity. Use the lower end when the stock reports earnings soon or has large overnight gaps.
Risk/reward ratio: Minimum 2:1, based on the distance from entry to stop versus entry to target.
Risk warning: Swing setups carry overnight risk. Keep these backtests separate from intraday tests.
5. Compare AI Momentum Signals Across Market Regimes
Best for: Testing whether a strategy works outside one favorable period.
Entry rule: Use the same entry rule across bull, bear, and sideways market samples.
Exit rule: Keep the exit logic unchanged across each sample.
Stop-loss placement: Use the same stop method in each sample, such as 1x intraday ATR or 1.5x daily ATR.
Position sizing: Keep risk constant at 1% so results are comparable.
Risk/reward ratio: Minimum 2:1 for each tested setup.
Risk warning: Reject strategies that only work during one strong trend period and fail when volatility changes.
6. Test Volume Exhaustion Exit Rules
Best for: Fast momentum spikes that fade after a strong move.
Entry rule: Use the original AI or scanner entry, then test exit variations after volume extension.
Exit rule: Exit if volume surges while price fails to make a new high, or if price closes below the prior candle low after an extended move.
Stop-loss placement: Keep the original stop active until the exit trigger appears.
Position sizing: Keep account risk fixed at 0.5% to 1% and compare results by R-multiple.
Risk/reward ratio: Minimum 2:1 on the original trade plan, even if the exit rule gets tested separately.
Risk warning: Do not change entry rules while testing exit rules. That makes the comparison unreliable.
7. Backtest AI Watchlist Filters Before Entry
Best for: Removing low-quality candidates before trade testing begins.
Entry rule: Only test stocks that meet minimum price, volume, spread, and volatility filters before the setup forms.
Exit rule: Use the exit rule from the specific strategy being tested.
Stop-loss placement: Use the stop rule from the specific strategy being tested.
Position sizing: Exclude setups where the stop distance creates impractical share size or exceeds the risk cap.
Risk/reward ratio: Minimum 2:1 after filters are applied.
Risk warning: Filters should remove weak candidates before entry. They should not be added after the fact to improve past results.
8. Validate Paper Trading Before Live Execution
Best for: Final testing after historical results look acceptable.
Entry rule: Take only simulated trades that match the backtested setup exactly.
Exit rule: Follow the tested target, trailing stop, or invalidation rule.
Stop-loss placement: Enter the stop immediately after simulated entry.
Position sizing: Start with simulated 0.5% account risk. Compare fill quality with backtest assumptions.
Risk/reward ratio: Minimum 2:1 before entry.
Risk warning: If paper fills are consistently worse than the backtest, revise the model before live trading.
Pro Tip: Track every result in R-multiple. A 1R loss means the trade lost the planned risk. A 2R win means the trade gained twice the planned risk. This keeps performance comparable across account sizes.
| Strategy | Timeframe | Entry Focus | Stop Method | Position Size |
| Relative volume breakout | Intraday | Opening range or pre-market high | Candle low or 1x five-minute ATR | 0.5% to 1% risk |
| Gap-and-go | Intraday | First range breakout | Opening range low | 0.5% risk |
| AI plus VWAP | Intraday | AI signal and higher low | Higher low | 0.5% to 1% risk |
| Multi-day pullback | Swing | 10-day or 20-day moving average reclaim | Pullback low or 1.5x daily ATR | 0.5% to 1% risk |
| Regime test | Intraday or swing | Same rule across markets | Fixed test rule | 1% risk |
| Volume exhaustion exits | Intraday | Exit rule testing | Original stop | 0.5% to 1% risk |
| Watchlist filters | Pre-entry | Liquidity and volatility screen | Strategy-specific | Risk cap required |
| Paper validation | Simulated real time | Exact rule match | Immediate stop | 0.5% simulated risk |
Also Read: Calculating Risk-to-Reward Ratio: A Key Metric for Traders
How Do You Run the Backtest Step by Step?
A reliable backtest starts before any result is reviewed. Write the rules first, then test them without adjusting midstream.
1. Define the Momentum Setup
Write the setup in one sentence. Example: “Long stocks breaking above the opening range high while above VWAP, with relative volume above 2.0x.”
2. Set the Entry and Exit Rules
Define the trigger, target, invalidation level, and holding period. A rule like “buy strength” is too vague. A rule like “buy the first five-minute close above opening range high” can be tested.
3. Add Stop-Loss and Position Size Rules
Use 0.5% to 1% account risk per trade. Position sizing is how much of the account gets allocated to a trade based on planned loss, not how confident the setup feels.
Use this formula:
Share size = Account dollars at risk / Stop distance per share
Example: a $25,000 account with 1% risk has $250 at risk. If the stop is $0.50, the share size is 500 shares before slippage and fees.
4. Include Slippage, Fees, and Spread Assumptions
Add realistic costs before judging the system. Momentum entries often fill above the trigger, and exits can slip during fast reversals.
Use three cases:
| Case | What It Tests |
| Base case | Normal spread and expected fill |
| Conservative case | Slightly worse entry and exit |
| Stop-loss stress case | Loss expands because the exit fills beyond the stop |
5. Test Across Multiple Market Conditions
Run the same rules across different trend and volatility periods. Do not change the rule set for each period.
Tag each trade as first-hour, midday, high-volatility, low-volatility, trending, or choppy. This shows whether the strategy works broadly or only in one narrow condition.
6. Review Drawdown, Win Rate, and R-Multiple
Track win rate, average win, average loss, maximum drawdown, average R, and longest losing streak. A strategy with a lower win rate can still be tradable if winners are larger than losses.
Reject tests where one trade creates most of the profit. A cleaner result has many trades contributing to total performance.
7. Paper Trade Before Live Execution
Paper trading tests whether real-time alerts, fills, and decisions match the historical model. Run 20 to 30 simulated trades using the exact backtested rules before deciding whether the system is ready for capital.
Common Mistake: Do not change the strategy after every losing trade during paper validation. Save the first test, duplicate it, and adjust one variable at a time.
Pre-Trade Backtest Checklist
- Setup definition is written in one sentence.
- Minimum stock price is defined.
- Minimum average daily volume is defined.
- Relative volume threshold is set.
- Entry trigger is specific.
- Exit trigger is specific.
- Stop-loss rule is written before testing.
- Position size formula is applied.
- Slippage assumption is included.
- Minimum sample size is set.
- Market regime is tagged.
- Post-test pass or fail criteria are defined.
What Mistakes Break AI Momentum Backtests?
Testing Too Few Trades
Why it happens: A trader sees three clean winners and assumes the setup works.
What to do instead: Treat small samples as pilot tests. Aim for 30 or more trades where possible, then retest with fresh data.
Ignoring Slippage on Fast Breakouts
Why it happens: Historical charts show the breakout level, but not always the fill quality.
What to do instead: Add slippage before judging expectancy. If the setup still works after worse fills, the test is more realistic.
Optimizing Until the Chart Looks Perfect
Why it happens: AI testing tools can make it easy to add filters until past trades look cleaner.
What to do instead: Limit changes. Test one variable at a time and validate on data that was not used to build the rule.
Using Win Rate Without R-Multiple
Why it happens: Win rate is simple to understand, so it gets too much attention.
What to do instead: Track average R and drawdown. A 45% win rate can be acceptable if winners average more than twice the size of losses.
Letting AI Signals Override Stops
Why it happens: A strong signal can make the trade feel safer than it is.
What to do instead: Set stop-loss and position size before entry. Do not widen the stop because the signal still looks strong.
Mixing Day Trades and Swing Trades
Why it happens: Both setups may come from the same momentum scan.
What to do instead: Separate intraday and multi-day trades. Overnight gaps, holding periods, and stop distances change the risk profile.
What Makes an AI Momentum Backtest More Reliable?
Use Walk-Forward Testing
Build the rules on one sample, then test them on a later sample. If performance drops sharply, the original rules may have been too fitted to past conditions.
Track R-Multiple Instead of Dollars Alone
Dollars change with account size and share size. R-multiple keeps the focus on planned risk. A 2R win matters because it doubled the planned risk, whether the account is $5,000 or $50,000.
Separate First-Hour Trades From Midday Trades
Opening momentum has more volume and faster movement. Midday continuation often has slower follow-through. Testing them separately makes the result easier to act on.
Compare Fixed Stops With ATR-Based Stops
Fixed stops are simple. ATR stops adjust for volatility. A $0.50 stop may work on one stock and be too tight on another, while a 1x ATR stop adapts to the stock’s normal movement.
Reject Strategies That Depend on One Outlier
If one trade creates most of the backtest profit, the system needs more testing. A cleaner result has many trades contributing to total performance.
Review Missed Trades, Not Just Taken Trades
A backtest should show whether rules are practical. If many valid setups are missed because alerts fire too late or entries move too fast, the live process may need tighter filters or slower confirmation rules.
How Can Trade Ideas Help Test These Setups?
Trade Ideas can support the testing process by helping traders find repeatable momentum candidates, set alerts around written rules, and validate the plan in simulated trading. The workflow should start with scans, not trades.
For an intraday AI momentum scan, use filters such as:
- Price above VWAP
- Relative volume above 2.0x
- New intraday high
- Minimum average daily volume
- Minimum price filter
- Spread filter where available
For alerts, focus on confirmation events:
- Break above opening range high
- Break above pre-market high
- New high with volume confirmation
- VWAP reclaim
- AI signal alignment
Trade Ideas scans 40+ real-time channels for momentum, earnings, and industry-specific setups, which can help create a larger sample of candidates for testing. AI-powered buy and sell signals can support timing, but the written entry, exit, stop, and position size rules still control the trade.
Before live execution, use simulated trading to test 20 to 30 real-time examples. Compare fills, slippage, stop execution, and journal notes against the historical model.
What Should Traders Take Away?
Backtesting AI-driven momentum stocks is useful only when the test reflects real trading conditions. Define the setup, control risk, include slippage, and reject results that depend on perfect fills or one strong winner. Practice the rules in paper trading before adding capital.
Test the Strategy Before You Trade It
Test the setup, risk rules, and paper-trading process before putting capital at work. Start with a structured paper trading workflow and move forward only when the data supports the plan.
FAQ
How many trades do I need before trusting a backtest?
Aim for 30 or more trades where possible. A smaller sample can still be useful as a pilot test, but it should not be treated as proof. For active momentum strategies, larger samples are better because one outlier can distort the result.
What is a good win rate for AI momentum strategies?
A good win rate depends on average win, average loss, and risk-to-reward ratio. A 45% win rate can be workable if average winners are much larger than average losses. A 65% win rate can still fail if losses are not controlled.
Should I use fixed stops or ATR-based stops?
Test both. Fixed stops are easy to apply, but they may be too tight for volatile stocks and too loose for slower stocks. ATR-based stops adjust to normal movement, which can make them better for AI-driven momentum names with changing volatility.
How much should I risk per trade when testing momentum stocks?
Use 0.5% to 1% account risk per trade during testing. Use the lower end for gap stocks, wider spreads, overnight holds, or setups with limited history. The goal is to test the strategy, not prove confidence through larger size.
Can AI signals replace my entry and exit rules?
No. AI signals can help filter candidates or support timing, but they should not replace written rules. Every tested trade still needs entry criteria, exit criteria, stop-loss placement, position sizing, and a risk-to-reward target.
How do I know when a backtest is overfitted?
Warning signs include too many filters, results that depend on one large winner, strong performance in only one market period, or performance that disappears when tested on newer data. A reliable strategy should survive reasonable changes in timing, costs, and market conditions.