Small Caps Have Taken the Lead in 2026, and Here’s Why It Matters
Small Caps Have Taken the Lead in 2026, and Here’s Why It Matters

For most of the past decade, the story on Wall Street was simple. Buy the Magnificent Seven and watch the market index go up. In 2025, that playbook still worked. The Nasdaq 100 gained 21.24% while the S&P 500 returned 17.88%. Small caps, however, sat on the sidelines, nursing high debt loads against a Fed that kept rates elevated.
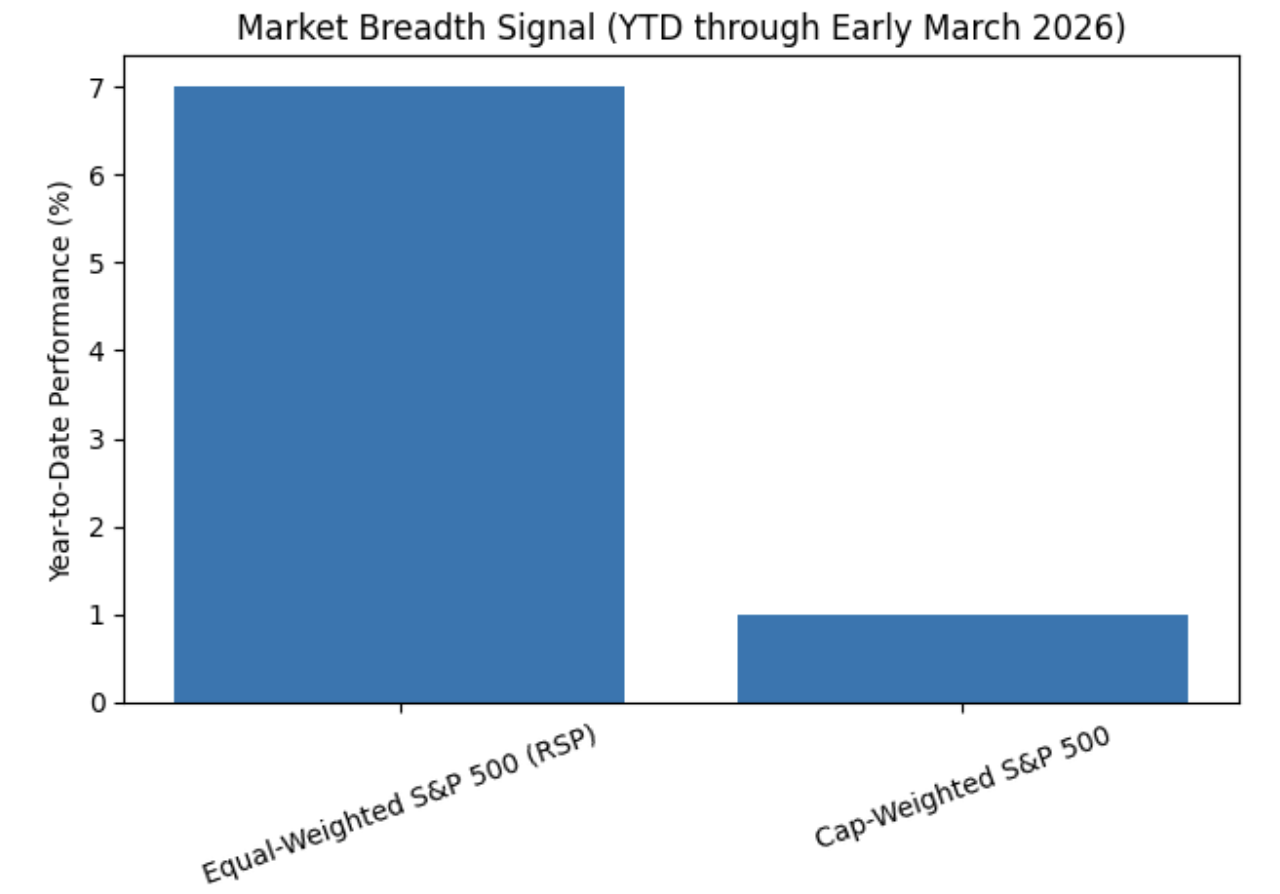
From the first trading day of the new year, the Russell 2000 began a 15-session winning streak against the S&P 500, a feat not seen since 1996. By early March, the index was up 6.1% year-to-date while the S&P 500 managed just 0.65%. The Roundhill Magnificent Seven ETF (MAGS) actually dipped into negative territory over the same stretch, and for the first time in years, the so-called “real economy” is setting the pace.
This is not a seasonal blip. Three converging forces broke the logjam that had kept small caps compressed for years, and understanding them is the key to navigating what comes next.
What Actually Triggered the Rotation?
Three things came together at once, and timing was everything.
1. The Fed finally blinked
Between September and December 2025, the Federal Reserve cut rates three consecutive times, bringing the federal funds rate down to 3.50%–3.75%. For small-cap companies carrying floating-rate debt, this was not just good news; it unlocked structural earnings.
Unlike Microsoft or Apple, which sit on mountains of cash and barely feel the effects of interest rate movements, smaller companies have been suffocating under elevated borrowing costs. Lower rates translated directly into improved cash flow almost overnight.
2. Fiscal tailwinds kicked in
The One Big Beautiful Bill Act (OBBBA), signed in mid-2025, included permanent tax deductions for small and mid-sized enterprises and front-loaded $150 billion in domestic defense modernization contracts. By January 2026, those provisions were fully in effect.
Companies like Gorman-Rupp (GRC) saw order books swell. Regional banks like Citizens Financial Group (CFG) benefited from small business lending incentives embedded in the legislation. Washington had, perhaps inadvertently, written a subsidy for Main Street.
3. Valuations had reached an extreme
By late 2025, the Russell 2000 was trading at a 31% discount to the S&P 500 on a forward price-to-earnings basis, a gap analysts were calling a “coiled spring.” Heavy tax-loss harvesting in Q4 2025 pushed small-cap prices to a technical floor. When January arrived, those same positions were being repurchased. The snapback was historic.
Why AI Fatigue Is a Real Thing
The other half of the rotation story is what’s happening to large-cap tech. NVIDIA, which seemed untouchable for much of 2024 and 2025, is facing a market that’s asking harder questions. Alphabet issued a massive bond offering to fund further AI infrastructure, and its long-term debt quadrupled in 2025 to $46.5 billion.
Rather than cheering the ambition, investors questioned the return on investment. Vanguard estimates the industry needs to generate $3.1 trillion in AI revenue between 2025 and 2027 to justify current valuations, and that math is getting harder to ignore. The technology sector fell 3.9% in February 2026. Communication Services dropped 5.1%.
The term being used across trading desks is “AI Capex Fatigue.” The market rewarded companies for announcing large AI investments for two years. Google Cloud grew 48% year-over-year in Q4 2025, yet analyst projections warn big tech free cash flow could drop up to 90% in 2026 as capital expenditure outpaces revenue growth. Now it wants to see the margin.
Until Alphabet, Microsoft, and Meta can demonstrate that their infrastructure spending is generating measurable margin expansion and new high-margin products, the premium valuations that carried them through 2023–2025 are harder to justify.
That does not mean big tech is broken. These are cash-generating machines with durable competitive positions. But the era of “buy the Magnificent Seven at any price” appears to be on pause, and the capital flowing out of those names has to go somewhere. It’s going to small caps.
Where the Money Is Actually Going
The rotation is not uniform. It’s worth understanding which segments of the Russell 2000 are leading, because not all small caps are created equal.
Materials rose 8.9% within the Russell 2000 in February 2026. Communications was up 8.7%. These are companies with tangible assets, physical infrastructure exposure, and revenues tied to the domestic economy rather than global software licensing.
Industrials are seeing real momentum. Demand for physical infrastructure to support AI data centers and mining operations is surging, and the beneficiaries extend well into the small and mid-cap tiers. Willdan Group (WLDN), an energy engineering firm, has experienced record demand for AI-related power grid upgrades, underscoring that the AI buildout has physical dependencies that extend to companies far outside Silicon Valley.
Regional banks are having a genuine moment. Citizens Financial Group (CFG) has outperformed its large-bank peers as the OBBBA’s small business lending incentives revitalize a model that had been squeezed for years. If the soft landing narrative holds and commercial loan demand continues, regional lenders could sustain their outperformance through the year.
At the speculative end, biotech is showing risk-on behavior. Celcuity (CELC) has become a poster child for investor appetite moving away from the Nasdaq and toward high-beta growth in specialized healthcare.
The Risks That Could Stall the Rally
Any honest market analysis has to account for the counterarguments. The rotation has momentum, but several risks could slow or reverse it before the year is out.
1. Fed Policy Reversal
February’s Producer Price Index surged 0.5%, raising concerns about sticky inflation. If the Fed signals a pause or reversal of its rate-cutting path, small caps will feel it disproportionately. Floating-rate debt becomes a liability again the moment the rate trajectory shifts.
2. Overextension
After the January surge, the Russell 2000’s RSI entered overbought territory. Technical consolidation after such a rapid move is normal, and short-term pullbacks are a feature, not a bug, of a genuine rotation cycle. But traders need to distinguish between a healthy pause and a reversal.
3. Large Cap Comeback
The Magnificent Seven are not standing still. If Q2 2026 earnings reports show that AI infrastructure spending is finally generating measurable margin expansion, institutional capital could rotate back quickly. The rotation thesis depends partly on large-cap tech continuing to disappoint.
4. Geopolitical Shocks
Small caps are predominantly domestically focused, which insulates them from some global risks but not from macro disruptions that affect credit markets or consumer confidence.
How to Think About Trading This Environment And What History Says Happens Next
The 2026 rotation rewards selectivity more than passive allocation. Simply buying the IWM ETF captures the trend, but the variance within the Russell 2000 is wide. A buy-the-dip approach on confirmed rotation leaders is more precise than broad exposure.
Key factors for evaluating small-cap candidates right now: domestic revenue concentration, floating-rate debt reduction or fixed-rate refinancing completed in late 2025, infrastructure, energy, or defense sector ties benefiting from OBBBA contracts, regional banking or Main Street consumer exposure, and Q4 2025 earnings beat rate. Small caps showed a 65% beat rate in the last reporting cycle.
Momentum signals matter too. Trade Ideas’ HOLLY AI scans 8,000+ U.S. stocks in real time and generates automated alerts across 300+ pre-built strategies, with a 68% win rate in backtesting. In a rotation environment where small-cap leaders emerge faster than traditional fundamental research can track, a real-time scanner that identifies volume acceleration, breakout patterns, and statistical divergences is a genuine edge.
This kind of rotation has precedent, and the historical data on magnitude and duration should give investors pause about underestimating it. From April 1999 to April 2006, a seven-year stretch spanning the dotcom bust and early 2000s recovery, the Russell 2000 outperformed the S&P 500 by 99%. Going back further, the late-1970s and early-1980s cycle driven by the unwinding of the “Nifty Fifty” concentration and a Fed that eventually began easing saw the Russell 2000 outperform by 77% between January 1979 and July 1983. In both cases, the rotation was not a one-quarter event. It was a multi-year regime change that rewarded investors who repositioned early and held through the volatility.
The forward data supports a similar setup today. Jefferies analyzed seven comparable periods of significant small-cap underperformance and found that, on average, small caps outperformed large caps by 22.2%, 10.5%, and 9.8% annually over the subsequent one-, three-, and five-year periods following the inflection point. The current rotation is still in its early innings by that measure.
The valuation gap, while narrowing, still favors the Russell 2000. At 18.1x forward earnings versus the S&P 500 near 22x, there is room to run even if the pace slows from January’s speed. The earnings growth differential is 18–22% projected for small caps versus 13% for large caps, which provides fundamental support that makes the rotation less dependent on pure sentiment.
The question analysts are now debating is whether 2026 is the start of a “decade of the domestic,” a multi-year period where the S&P 400 Mid-Cap and Russell 2000 become the primary drivers of portfolio returns, and where stock picking and fundamental analysis matter more than simply owning a concentration of five or six mega-cap names.
The early evidence says yes. But the March CPI report and the Fed’s next communications will do a lot to confirm or complicate that view.
The Bottom Line
The Great Rotation is not a prediction anymore. It’s a data point. The Russell 2000 is up 6.1% year-to-date versus the S&P 500’s 0.65%. Small-cap earnings are growing faster than large-cap earnings for the first time in 13 quarters. The Fed has cut rates three times. The OBBBA is funneling capital into domestic companies. The valuation gap is real.
What happens next depends on the Fed staying the course and small-cap earnings continuing to outperform. But for active traders, the window to position ahead of the crowd has already opened. The question is whether you’re watching it or trading it.
For more insights and strategies on navigating the small-cap market, visit Trade Ideas today.
Related Reads
Why Small Caps Are Crushing Large Caps in 2026
Spring Sector Rotation: Best Stocks February to May
Frequently Asked Questions
1. Do small-cap stocks do well when interest rates fall?
Yes. Historically, the Russell 2000 has averaged 36% returns in the 12 months following the last rate cut in Fed easing cycles since 1984.
2. What percentage of Russell 2000 revenue comes from the U.S.?
The Russell 2000 derives approximately 77% of its revenue domestically, making it far more insulated from global trade disruptions than the S&P 500.
3. How does the valuation gap between small caps and large caps compare right now?
The Russell 2000 trades at a P/E ratio of 19.5x versus the S&P 500 at 28x, meaning small caps would need to rise roughly 50% to reach valuation parity.
4. What is the “debt maturity wall” risk for small caps?
Small caps face a looming $1.35 trillion debt maturity wall, with roughly 32% of Russell 2000 debt tied to floating rates compared to just 6% for the S&P 500.
5. What is the Jefferies year-end target for the Russell 2000?
Jefferies has revised its year-end Russell 2000 target to 2,825, implying double-digit upside from current levels of around 2,285, a projected gain of approximately 23% by year-end.
6. What did the OBBBA change for small businesses specifically?
The act restored 100% bonus depreciation and allowed immediate expensing of R&D costs, unlocking billions in domestic investment for capital-intensive small firms.