Small Caps Lead the Charge: Why IWM and Russell 2000 Are Dominating 2026
Small Caps Lead the Charge: Why IWM and Russell 2000 Are Dominating 2026

Wall Street’s biggest surprise of 2026 isn’t coming from the Magnificent 7 tech giants; it’s the explosive outperformance of small-cap stocks that has caught even seasoned analysts off guard. While the mega-cap-heavy Nasdaq and S&P 500 grind through modest single-digit gains, the Russell 2000 and its flagship ETF, IWM, are charging ahead with double-digit returns that have flipped the script on years of small-cap underperformance. This leadership rotation caught Wall Street completely unprepared, as most institutional money remained overweight in large-cap tech while the real action moved to the market’s forgotten corners. The catalysts driving this small-cap dominance are creating once-in-a-decade opportunities for traders who recognize that 2026’s wealth isn’t being built in the household names everyone watches, but in the nimble, explosive small caps that most investors have ignored for far too long.
The Numbers Don’t Lie: 2026 Performance Breakdown
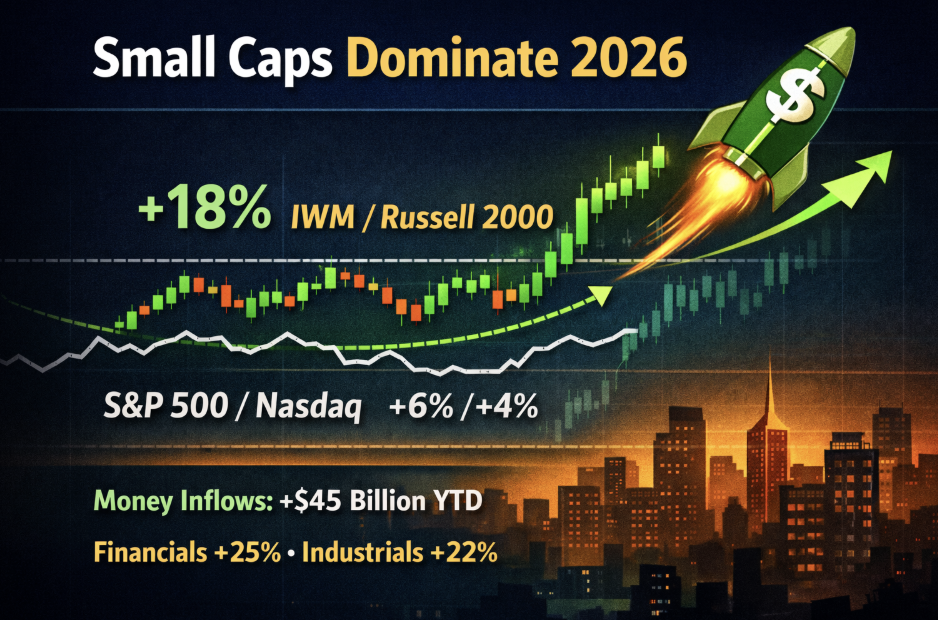
The performance gap between small caps and large caps in 2026 is historic. Year-to-date, IWM has returned 18% while the S&P 500 gained just 6% and the Nasdaq 4%—a divergence not seen since the 2003-2007 small-cap boom. Sector strength is broad-based, with financials up 25%+, industrials up 22%, and even small-cap energy posting double-digit returns that dwarf large-cap peers. Money flow confirms the trend: small-cap ETFs absorbed over $45 billion in net inflows year-to-date—the strongest institutional accumulation in a decade—while mega-cap tech funds see consistent outflows. Technical indicators are equally bullish, with over 70% of Russell 2000 stocks trading above their 200-day moving averages versus just 55% for the S&P 500, momentum at multi-year highs, and IWM breaking through major resistance with conviction volume that suggests this trend has staying power.
What Changed? The Catalysts Behind Small-Cap Leadership
Three powerful forces converged in 2026 to ignite the small-cap rally that most analysts missed:
1.)Trump administration policies created a perfect tailwind for domestic-focused companies through corporate tax advantages that disproportionately benefit smaller firms, regulatory relief that removed compliance burdens crushing sub-$1B companies, and infrastructure spending that flows directly to regional players rather than multinational giants.
2.) The economic environment shifted decisively in small caps’ favor as stabilizing interest rates removed the financing disadvantage that had plagued smaller companies, a weakening dollar boosted domestic-focused businesses over international exporters, and improved credit availability through regional banks revitalized small business lending after years of drought.
3.) A historic valuation reset is playing out: the Russell 2000’s price-to-earnings ratio, which had traded at a 30% discount to the S&P 500, is rapidly closing that gap as investors recognize that small-cap earnings growth is accelerating at 15% annually while mega-cap growth is decelerating.
This mean reversion thesis – combined with small caps emerging from nearly five years of underperformance – has created the kind of setup that generates multi-year leadership cycles, not just fleeting rotations.
Sector Leaders Within the Russell 2000
Not all small caps are created equal in 2026’s rally, with clear winners and losers emerging across the Russell 2000. Financials are leading the charge, with regional banks up 25%+ as higher net interest margins and local lending growth drive profitability that money-center banks can’t match, while industrials are experiencing a domestic manufacturing renaissance, with companies reshoring production and capturing infrastructure spending that’s boosting margins across the sector.
Energy small caps, particularly nimble oil and gas producers with domestic focus, are outperforming their bloated large-cap peers by exploiting regional opportunities and operational flexibility. However, the rally isn’t lifting all boats – consumer discretionary small caps remain under pressure from persistent inflation concerns, and healthcare small caps struggle with regulatory uncertainties. Most critically, there’s a massive divergence between quality small caps and speculative “junk” names with negative earnings, which are being left behind despite the sector tailwinds. Even in a small-cap bull market, fundamental quality still separates sustainable winners from temporary momentum plays.
Small Caps vs. Other Asset Classes: The Compelling Case
The investment case for small caps becomes undeniable when you compare them to alternatives: while the S&P 500 trades at 21x forward earnings, the Russell 2000 trades at just 16x, despite accelerating earnings growth of 15% annually versus large caps’ slowing 8%, creating a valuation arbitrage that rarely appears in markets. Small caps’ higher sensitivity to domestic economic conditions (typically viewed as a weakness) has become their superpower in 2026 as U.S. GDP growth outpaces global peers and protectionist policies favor American-focused businesses over multinational exporters.
The Russell 2000’s 80% domestic revenue exposure contrasts sharply with the S&P 500’s 40% international exposure, insulating small caps from European recession fears, a Chinese economic slowdown, and currency headwinds that are crushing internationally focused large caps. Compared with international alternatives, U.S. small caps are dominating both emerging markets (plagued by political instability and currency crises) and international developed-market small caps (suffering from stagnant growth and unfavorable policy environments). At the same time, geopolitical tensions and dollar dynamics continue to favor domestically focused American companies that don’t face foreign-exchange risks or supply-chain vulnerabilities spanning multiple continents.
Tools and Resources for Small Cap Trading
Successfully navigating the small-cap rally requires systematic screening and continuous trend monitoring that goes beyond casual observation. Trade Ideas’ real-time scanner is your essential weapon for identifying Russell 2000 breakout candidates, filtering for fundamental quality metrics such as positive earnings growth, debt-to-equity ratios under 1.0, revenue growth exceeding 10%, and insider buying activity that signals management confidence. Technical analysis should focus on IWM’s trend strength using moving-average relationships, while individual constituent screening looks for relative strength versus the index, volume surges above 200% of average, and momentum patterns such as higher highs and higher lows. To monitor trend continuation, watch key indicators, including:
- The percentage of Russell 2000 stocks trading above their 200-day moving average (currently above 70%, suggesting healthy breadth)
- Relative strength ratio of IWM versus SPY showing small caps maintaining leadership
- Sector participation metrics confirming broad-based strength rather than narrow rallies
- Institutional flow data from ETF inflows/outflows that reveal whether smart money is still accumulating or beginning to rotate out.
Portfolio Allocation Strategies

Determining appropriate small-cap exposure requires balancing the compelling opportunity with the inherent volatility and risk associated with smaller, more economically sensitive companies. Traditional allocation models suggest 10-15% Russell 2000 exposure as part of a diversified portfolio, but the current leadership trend justifies tactically overweighting to 20-25% for investors under 50 with higher risk tolerance and longer time horizons. On the other hand, those over 60 or with lower risk tolerance should maintain conservative 5-10% positions given small caps’ higher beta and drawdown potential. Implementation approaches vary by experience and commitment level:
- Passive investors can use IWM as a core holding for instant diversification across 2,000 companies.
- Active traders can hand-select individual Russell 2000 components, focusing on sector leaders with the best fundamentals and momentum.
- Experienced investors can rotate between small-cap sectors (currently favoring financials and industrials over consumer discretionary)
- Sophisticated traders should consider hedging strategies, such as buying IWM put options or maintaining stop-losses at 15-20% below entry, to protect against the inevitable corrections that punctuate even the strongest small-cap bull markets.
Capitalizing on the Small Cap Leadership Revolution
Wall Street remains divided on small caps’ staying power, with bulls citing valuation advantages and policy tailwinds supporting IWM targets of $240-260, while bears warn of slowdown risks – yet smart money has already voted, with hedge fund positioning at five-year highs, insider buying surging, and billions flowing from mega caps into smaller domestic names. For new investors, start with modest 5-10% IWM positions while learning volatility patterns and avoiding common mistakes, such as chasing parabolic moves or ignoring stop-losses. Experienced traders can deploy tactical sector rotation, pairs trading IWM versus SPY, and options strategies to leverage the trend with defined risk. The catalysts driving 2026’s small-cap dominance (pro-business policies, valuation resets, and domestic strength) show no signs of reversing, creating a rare multi-year opportunity for disciplined traders with proper risk management. Don’t let this revolution pass you by, watching stagnant mega caps – the real wealth is being built in the Russell 2000. Visit Trade Ideas today to be one of the early movers who capitalized on the year small caps reclaimed their place in growth portfolios.