Why Trade Ideas Has the Most Data-Rich Charts in the Market
Why Trade Ideas Has the Most Data-Rich Charts in the Market
Most traders judge stock charting software and charting platforms on aesthetics and community script libraries, spending hours perfecting visual layouts while missing the fundamental question that actually determines trading success: Does your chart help you make faster, smarter decisions when opportunity emerges and seconds matter?
Trade Ideas built its advanced stock charting platform as intelligent interfaces that think with you rather than passive displays that merely show you data, recognizing that most platforms force constant toggling between multiple windows, tabs, and external tools—breaking flow state and creating decision fatigue as you hunt for confirmation data scattered across interfaces.
Trade Ideas consolidates everything traders actually need into one intelligent view where technical analysis, fundamental metrics, AI-driven signals, and real-time stock charts data coexist on the same canvas your eyes are already watching, eliminating the friction that causes missed entries and hesitant execution when information lives in five different places. The most powerful professional trading charts aren’t the prettiest or most customizable—they’re the ones that eliminate friction between seeing opportunity and acting on it, integrating technical patterns, fundamental context, and AI intelligence directly on the canvas where price action unfolds. This accelerates decision-making rather than overwhelming with endless customization options that slow execution when speed determines whether you capture or miss the move.
Everything You Need — All in One Chart
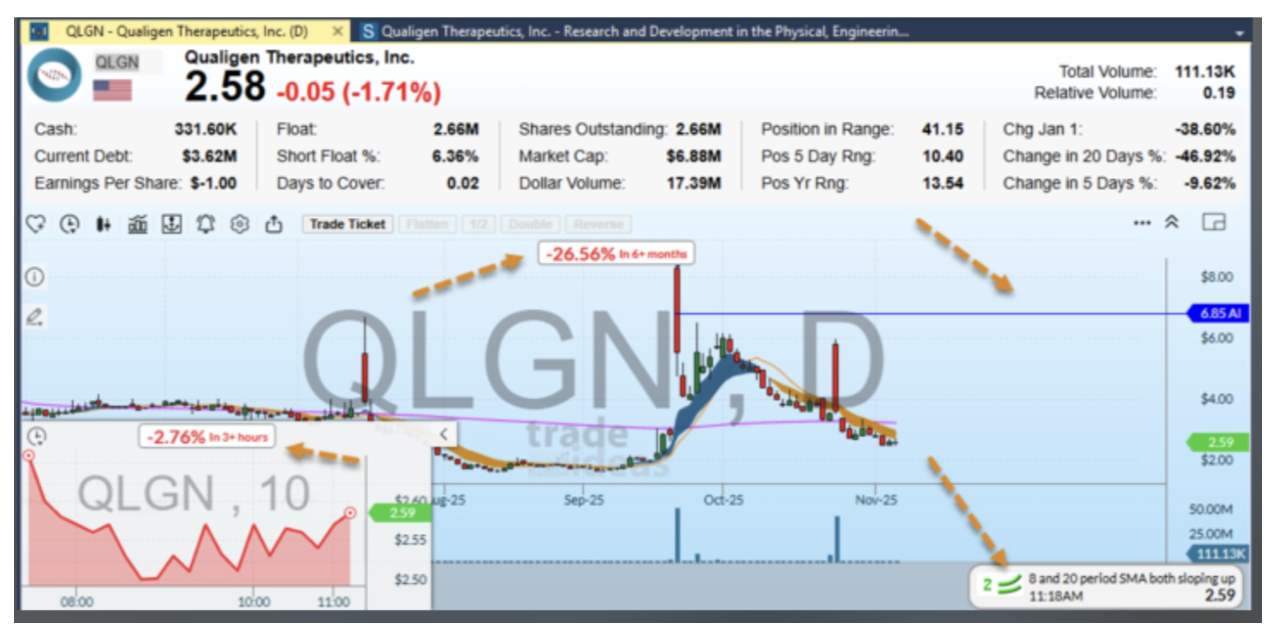
Trade Ideas integrates an unprecedented amount of actionable data directly on the chart canvas: real-time price action across multiple timeframes, moving averages with automatic slope annotations displaying insights like:
- “8 & 20 SMA both sloping up” without manual analysis.
- Volume bars with relative volume calculations distinguishing genuine moves from noise.
- Float and short float percentages make the squeeze potential instantly visible.
- Market cap and dollar volume provide immediate context for position sizing.
- Performance metrics spanning day, week, month, six-month, and year timeframes, updating live as the price moves
- Range position indicators that show contextual information, such as “Trading at 85% of daily range,” indicate whether a stock is near a high or a low.
This integration matters because traditional platforms force inefficient workflows: open a chart to see price action, switch to a screener for fundamental data, check a separate window for volume analysis, pull up float and short interest elsewhere, then cross-reference with scanner results. By the time you’ve gathered all this confirmation data scattered across five different tools, the opportunity has disappeared, and the entry you wanted no longer exists. On the other hand, Trade Ideas’ approach delivers everything at a glance:
1.) You see a stock breaking above its 20-day moving average with elevated volume (technical confirmation)
2.) Recognize it has a low float of 10 million shares with 25% short interest (fundamental catalyst for a squeeze)
3.) Observe it’s up 15% today and 8% this week (momentum confirmation), and immediately understand you’re looking at a high-probability short squeeze setup requiring immediate action.
And this all happens without ever leaving the chart or breaking your analytical flow to hunt for data living in external windows.
Picture-in-Picture: Two Timeframes, Zero Toggle
Day traders face an impossible dilemma: they need minute charts for precise entry execution but also require daily charts for trend context, yet traditional platforms force them to toggle between views, losing critical context with every switch. Trade Ideas’ Picture-in-Picture (PiP) solution displays two timeframes simultaneously—your main chart shows your primary trading timeframe, like a daily view. At the same time, a smaller PiP window presents your secondary timeframe, such as a 5-minute intraday view. Both of which update in real time without toggling, resizing, or confusion, preventing tunnel vision that occurs when fixated on single timeframes. These practical applications span all trading styles:
Swing traders: view daily trends in the main chart while timing entries on 4-hour PiP charts
Day traders: execute on 5-minute main charts while maintaining daily trend context in PiP to avoid fighting resistance.
Position traders: monitor weekly trends with daily precision for managing entries and exits without sacrificing detail.
The PiP solution reduces trader analysis time by more than 50% by eliminating constant toggling and providing a capability that no other major charting platform offers.
AI Intelligence and Smart Annotations Built Directly Into Charts
Trade Ideas integrates Holly, its proprietary AI engine trained on years of market data, directly onto the chart canvas with predictive buy and sell signals that transcend traditional lagging indicators by analyzing thousands of technical and fundamental factors simultaneously. The green arrows mark AI buy signals while red arrows indicate sell signals, sized based on conviction level and appearing exactly where your eyes already focus without requiring separate panels or interpretation. Holly also offers:
- Set up confirmation when your technical analysis aligns with the AI agreement, creating high-probability trades.
- Reversal detection when AI signals contrary to current moves, warning of potential turning points
- Entry validation offering visual confirmation without analysis paralysis.
- Pattern recognition AI recognizes that you might miss (i.e., when you’re watching a stock consolidating near resistance and believe it’s ready to break out).
Charts Built for Speed, Clarity, and Flow State Trading
Trade Ideas eliminates the friction that traditional platforms create through constant tab switching and tool hunting, providing an uninterrupted visual stream that keeps you “in the zone.” Our trade-from-chart capability lets traders see setups develop and click directly on the canvas to enter trades without switching to separate order-entry windows, maintaining a seamless flow from analysis to execution. The platform is built for how traders actually think—visual pattern recognition rather than spreadsheet analysis, rapid multi-timeframe comparison, instant confirmation, and action-oriented execution through integrated order entry. All of which result in 50% faster decision-making, dramatically fewer missed opportunities, and less screen fatigue compared to platforms that require constant context switching.
When compared to competitors, the distinctions become clear: TradingView offers beautiful aesthetics and an extensive script library but lacks fundamental data on the canvas, AI signals, and PiP functionality. Think or Swim provides deep customization and professional tools, but it overwhelms users with steep learning curves and data scattered across panels. Interactive Brokers TWS delivers professional execution and global market access, but treats charts as an afterthought with clunky interfaces. The common thread across all competing platforms is that they make you work for insights through configuration, navigation, and analysis; Trade Ideas surfaces insights automatically through intelligent integration of technical, fundamental, and AI-driven data, exactly where your eyes already focus.
The future of stock charting software is about intelligence, integration, and speed that eliminate friction between recognizing opportunity and capturing it. As the best charting platform for traders who value speed and clarity over endless customization, Trade Ideas focuses relentlessly on what actually matters. We help you see and act on opportunity faster than markets can move away from you, delivering professional trading charts that don’t just display price action but actively reveal opportunity through the intelligent synthesis of data that would otherwise require five different tools and constant mental gymnastics to process. Experience the difference: charts that think with you, not just show you data.