Simplify Your Trading Strategy with 2 Moving Averages
Simplify Your Trading Strategy with 2 Moving Averages
As a trader, managing risk is crucial for long-term success in the stock market. While countless indicators and strategies are available, sometimes the most straightforward approach can be the most effective. You really only need to utilize two moving averages to be a successful trader. This article will explore how using just these two moving averages on a 15-minute chart can help you make better trading decisions and manage your risk more effectively.
The Power of the 10 SMA and 130 SMA:
According to experienced trader Steve from Trade Ideas, the 10 SMA (Simple Moving Average) and the 130 SMA are the only two indicators you need to manage risk effectively. The 130 SMA is particularly significant because it represents the average price over a 5-day trading period, as there are typically 130 15-minute candles in a trading week.
Using the 15-Minute Chart
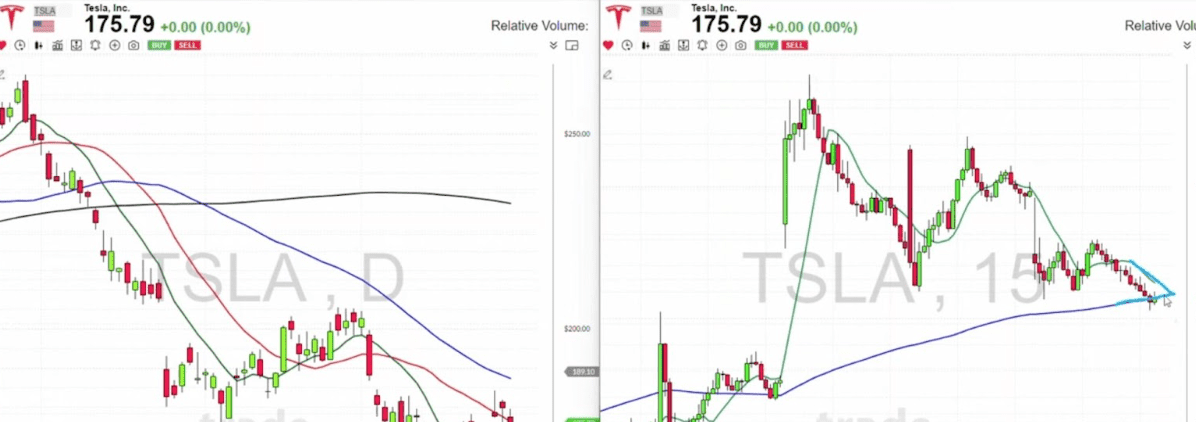
Focusing on the 15-minute Chart can help you avoid cluttering your daily Chart with multiple lines and moving averages. The 130 SMA, represented by a dark blue line on the 15-minute Chart, can act as a dynamic support or resistance level, providing valuable insights into potential entry and exit points.
Identifying the “Pinch Play”
One key strategy is to look for a “pinch play,” which occurs when the 10 SMA (the momentum indicator) and the 130 SMA converge. If the price breaks above this convergence, it may signal a bullish trend, while a break below could indicate a bearish move. By watching for these pinch plays, you can make more informed decisions about whether to stay in a trade or exit your position.
Real-World Examples
The article discusses several real-world examples, including Rumble (RUM), SoundHound AI (SOUN), C3.ai (AI), Mind Medicine (MNMD), Carvana (CVNA), and Tesla (TSLA). In each case, the 10 SMA and 130 SMA provide valuable insights into potential entry and exit points, helping traders manage their risk more effectively.
By focusing on just two moving averages on a 15-minute chart, traders can simplify their approach to risk management and make more informed decisions about when to enter and exit trades. While no strategy is foolproof, understanding the significance of the 10 SMA and 130 SMA can provide a solid foundation for a more effective trading plan. As always, doing your own research and adapting your strategy to suit your individual goals and risk tolerance is essential.