Unlocking the Power of Pullback Scans
Unlocking the Power of Pullback Scans
Identify the setup bar – the day when the stock first reverses or prints a green candle after the pullback. However, entering a trade on the setup bar itself can be risky, as the stock may continue to experience volatility.
Instead, traders can wait for confirmation by looking for the price action to trade above the high of the setup bar on the following day.
Finding Profitable Trading Setups
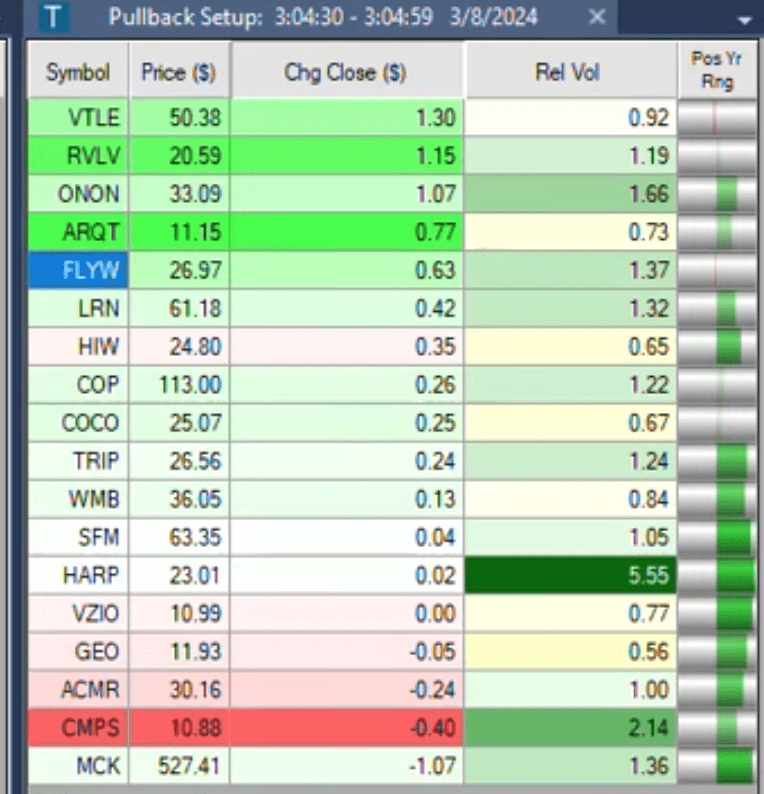
In the fast-paced world of stock trading, identifying the proper setups is crucial for success. Pullback scans are a powerful tool that can help traders find stocks poised for a potential reversal after a period of selling pressure. In this blog post, we’ll explore how to create and use pullback scans to uncover profitable trading opportunities, focusing on the key elements that make these setups effective.
The Configuration: Harnessing the Power of Filters
Creating a pullback scan that consistently identifies high-quality setups requires a well-thought-out configuration. By leveraging the power of filters, such as position in range and moving averages, traders can fine-tune their scans to pinpoint stocks that meet specific criteria.
For example, setting a maximum percentage for the position in a 5-day range ensures that the stock is trading in the bottom half of its recent price action. Additionally, requiring the stock to be above its 50-day and 20-day moving averages helps filter out stocks in a more significant downtrend.
The Importance of Position in Range
One of the most valuable filters in a pullback scan is the position in the range, mainly when applied to the current day’s trading range. By setting a minimum percentage of 75%, traders can identify stocks where buyers have stepped in and pushed the price into the upper portion of the intraday range, even in a weak overall market.
This filter can provide crucial insights into the sentiment surrounding a particular stock. If buyers are willing to support the stock during a market selloff, it suggests that there is underlying strength and potential for a reversal.
Analyzing Pullback Setups
Once the pullback scan is configured, it’s time to analyze the setups it identifies. Some key factors to consider include:
- The depth of the pullback: Shallow pullbacks may indicate a stronger underlying trend, while deeper pullbacks may offer more significant potential for a reversal.
- The volume during the pullback: Increasing volume during a pullback can signal growing buyer interest.
- The overall market conditions: Pullback setups may be more reliable in a robust market environment, while greater caution is warranted in a weak or choppy market.
The Setup Bar: Timing Your Entries
When trading pullback setups, it’s essential topproach helps to filter out false breakouts and increases the likelihood of a successful reversal.
Managing Risk: Setting Stop Losses
One advantage of trading pullback setups is that the stop loss is often clearly defined. By placing a stop loss below the low of the setup bar, traders can quickly exit the trade if the expected reversal fails to materialize, minimizing potential losses.
Pullback scans are valuable for traders seeking to identify stocks poised for a potential reversal. By focusing on critical filters such as position in range and moving averages, traders can create scans that consistently uncover high-quality setups. However, it’s crucial to exercise patience, wait for confirmation before entering a trade, and manage risk by setting appropriate stop losses. With practice and discipline, pullback scans can be a powerful addition to any trader’s arsenal, helping to unlock profitable opportunities in the stock market.