A Simple Way to Use Abnormal Option Activity for Better Trading Decisions
A Simple Way to Use Abnormal Option Activity for Better Trading Decisions
Dec 19, 2023
Hello fellow traders, I’m Barrie Einarson from Trade Ideas, back with a new post that promises to shed some much-needed light on efficient trading strategies.
One thing you should know about me is that I am a loyal advocate for the right scans. I have been raving about my favorite one for over three weeks now! Today, let’s dive right into it. I’d like to show you how this specific scan assists in my trading decisions and how it occasionally keeps me from making a trade.
COMBO Scan Analyzed – ANY CGEN CIFR
To Subscribe: https://go.trade-ideas.com/SHQ
Use Promo Code BARRIE15 for 15% off
The Power of a Good Scan
The scan I’m talking about is the ‘abnormal option activity plus a ten-day daily break’ scan. It’s my go-to tool for assessing the market currently. However, let’s clear one thing up: just because it’s my favorite, it doesn’t mean I blindly take the trade based on the alert it gives me.
Remember, every alert that a scan gives you is a trade idea, but it still deserves your keen scrutinizing.
Let’s take a look at several instances where this scan has worked its magic on my trade decisions.
Case Study: CIFR Trade
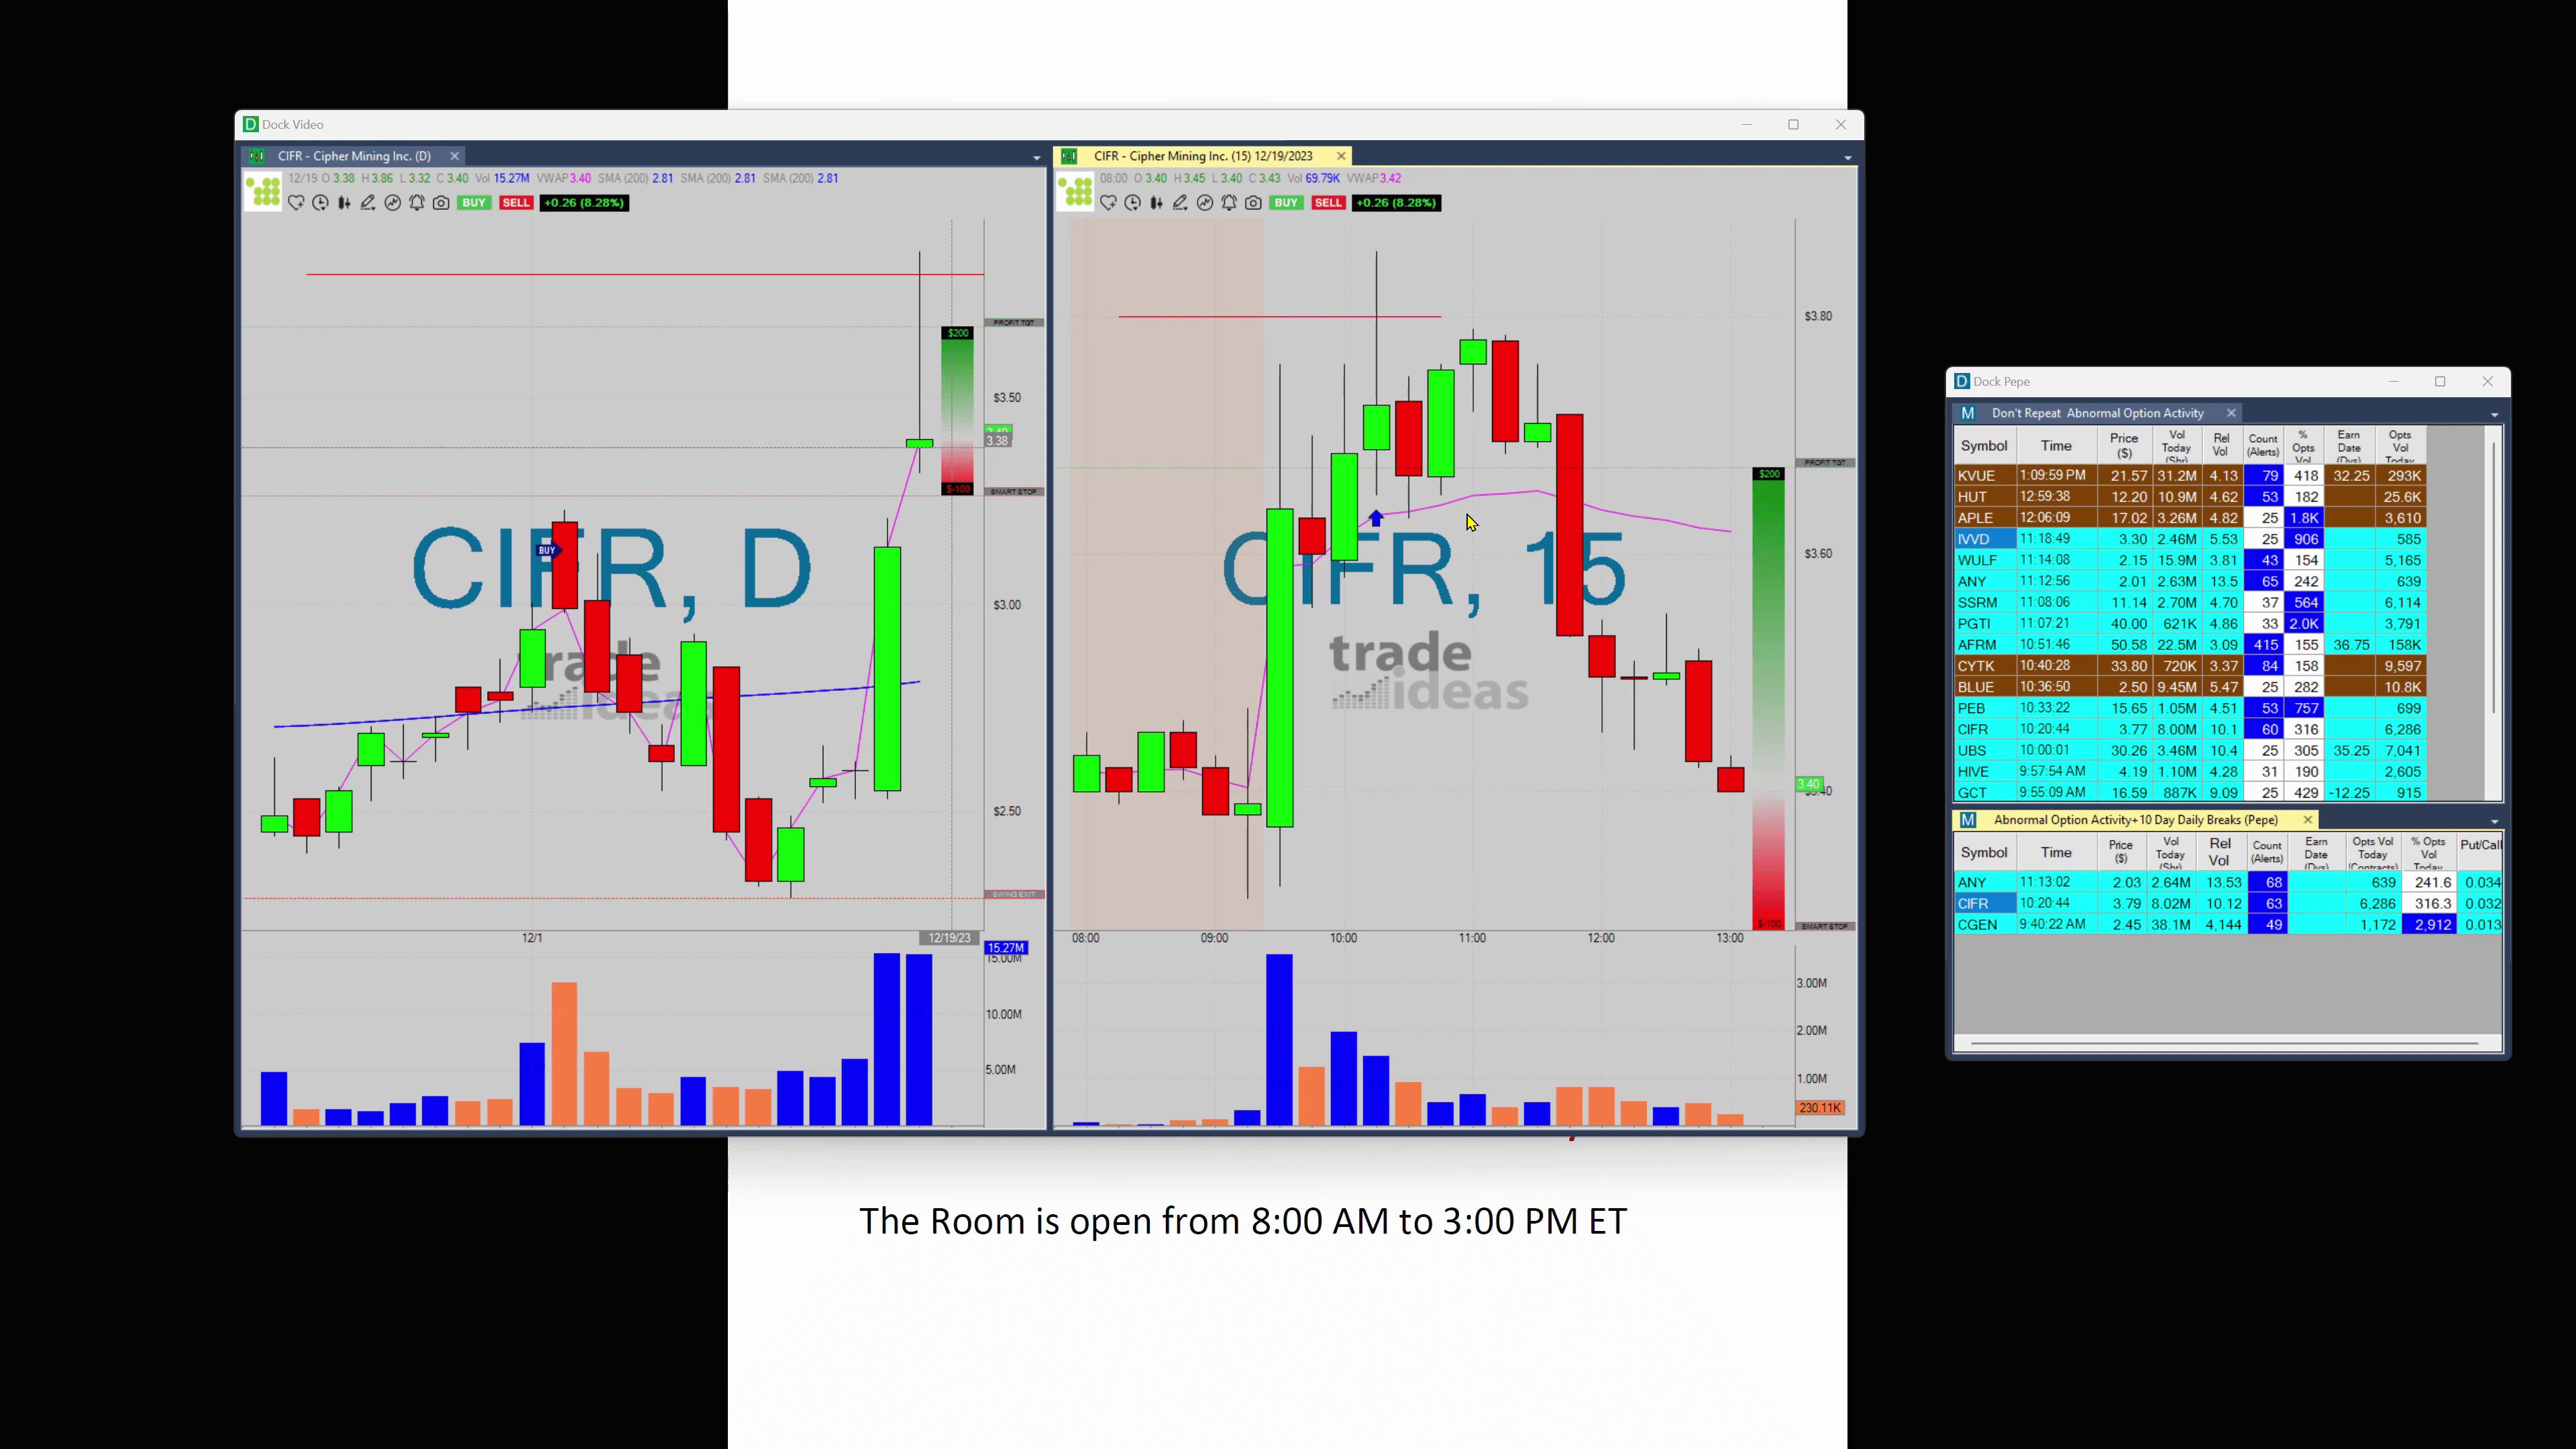
Please bear with me as I load up the details for CIFR. When we received an alert at 379, the first thing that caught my eye was a red line further up on the chart. This represented the next high when looking left on the daily chart. This was the first signal that perhaps I should not take this trade.
Even though the price breached the red line slightly, it gave me pause and I thought:

Should I take the risk when the next high is so close?
That’s when I decided it was a no-go for me.
Another Example: The CGen Trade
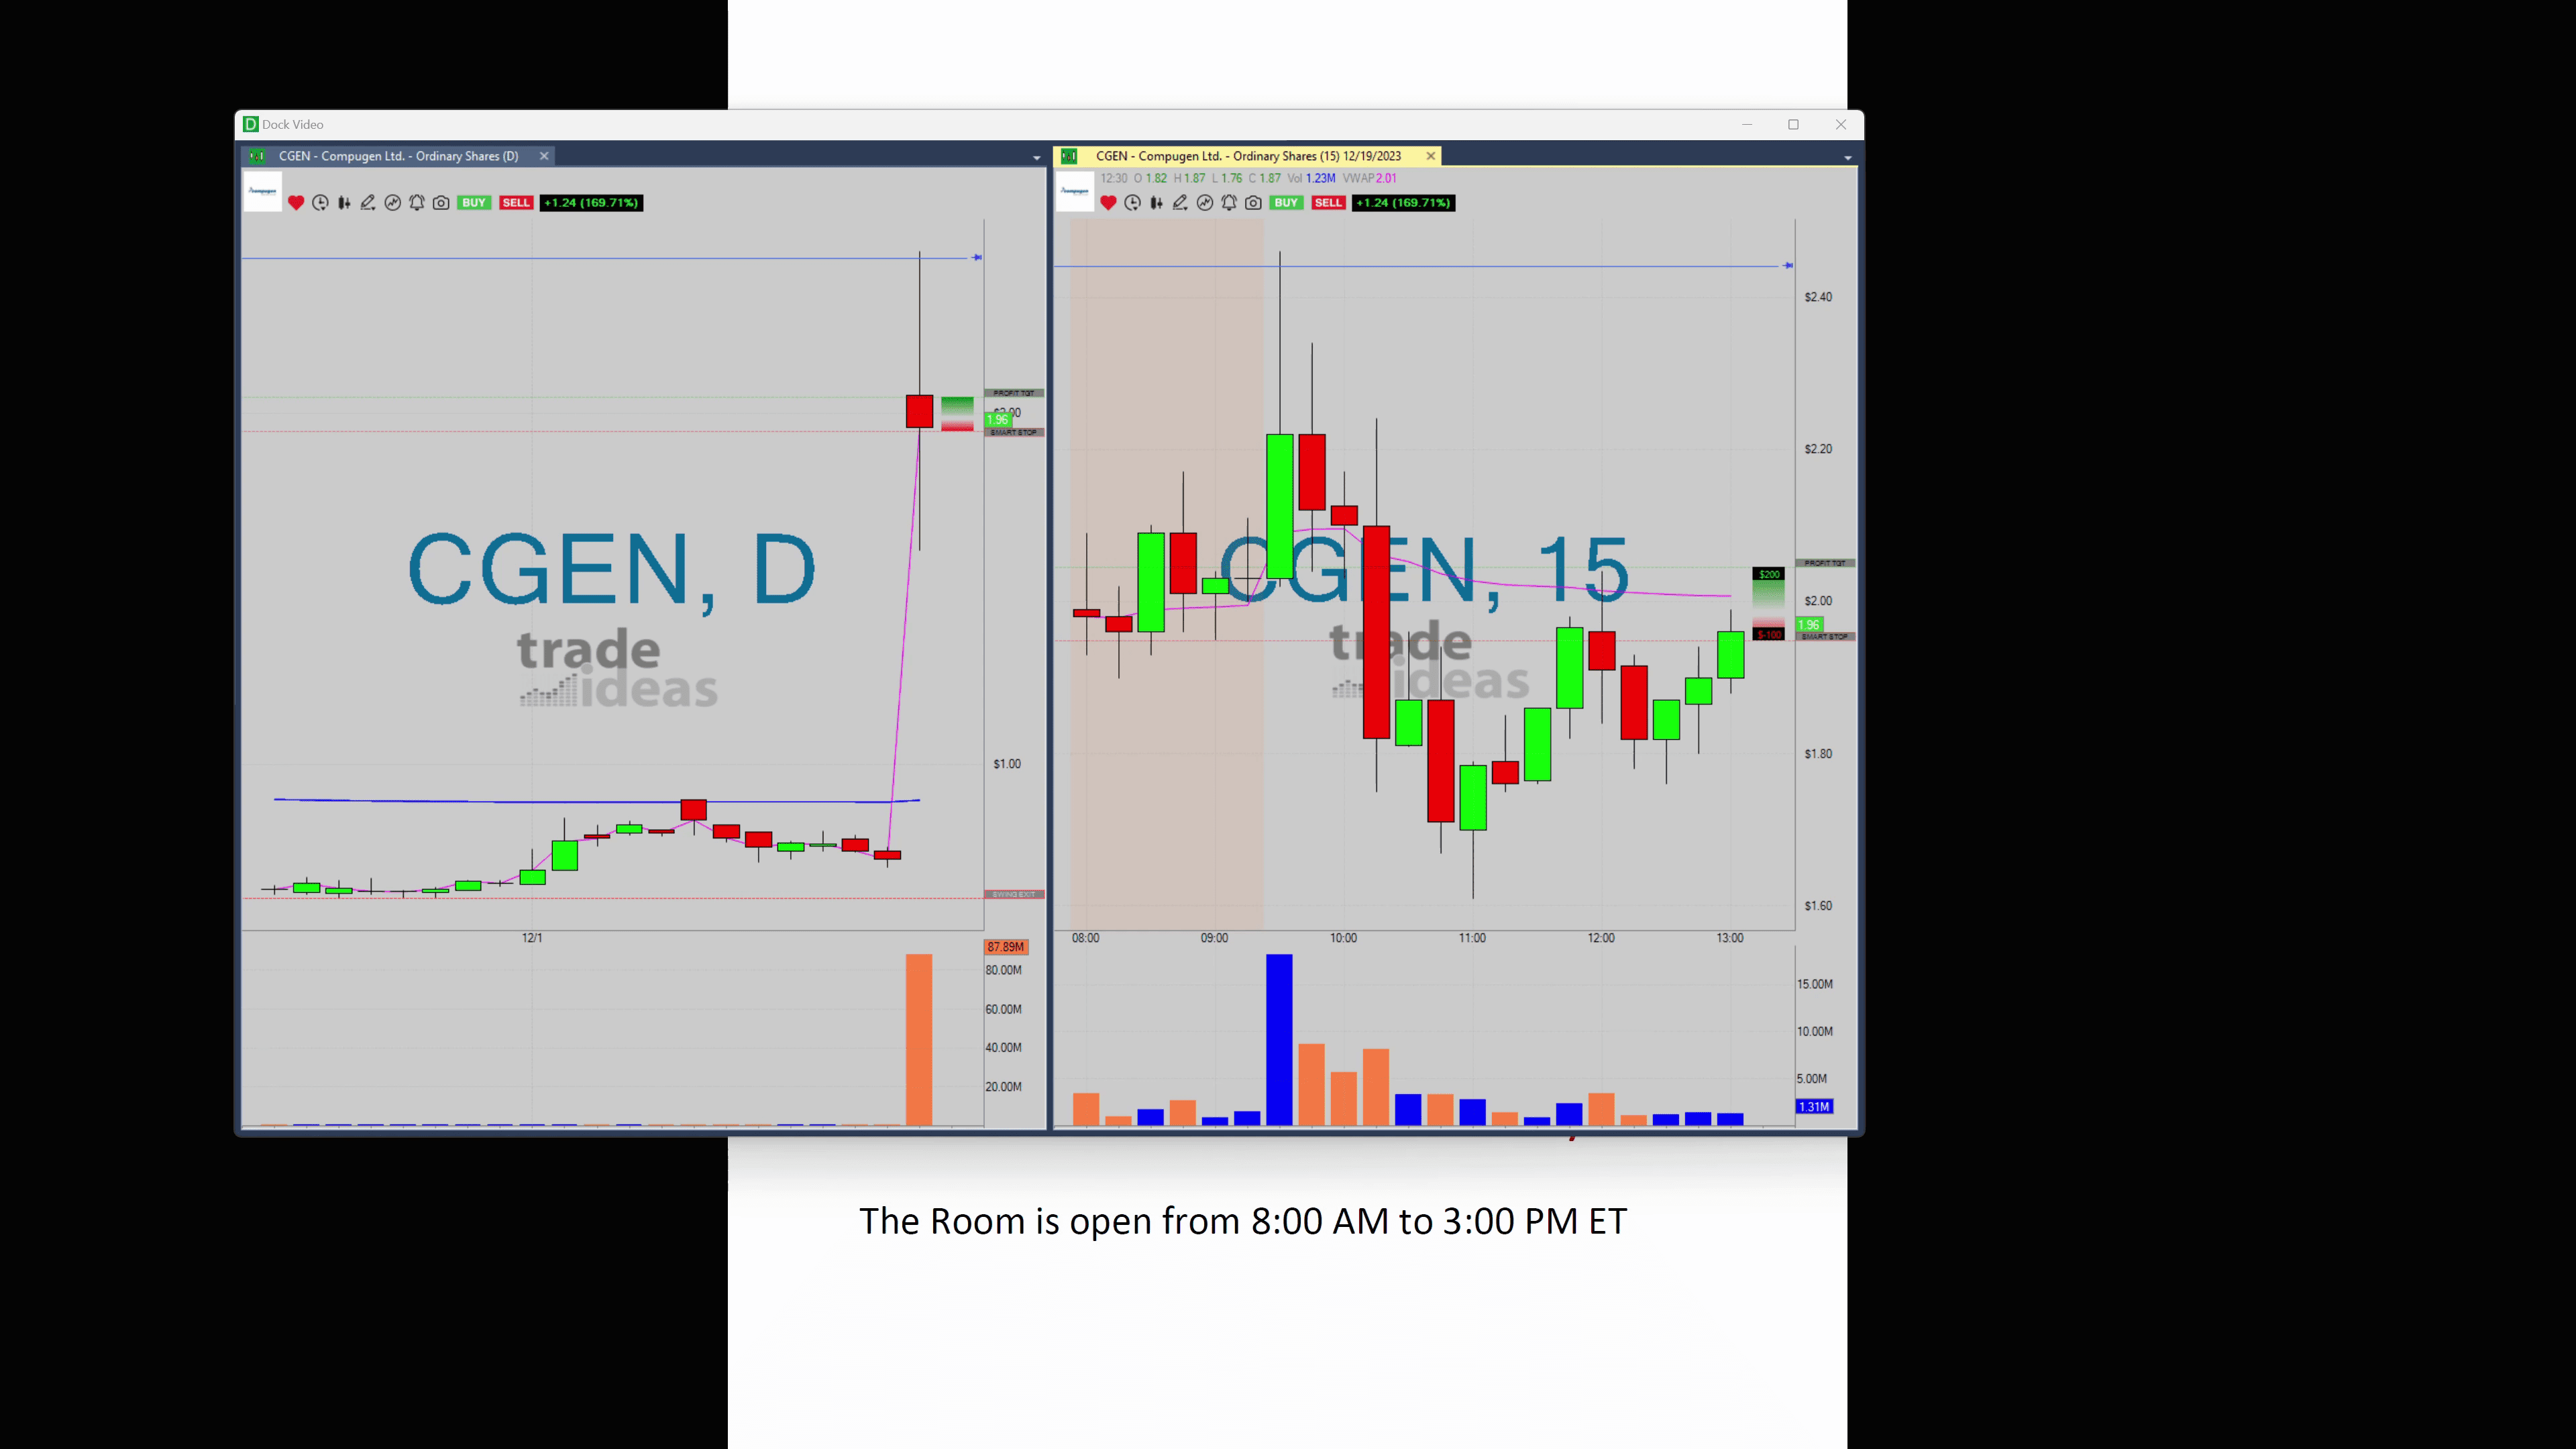
Let’s have a look at the CGen trade. When we got the alert at 245, I noticed that the next high was dangerously close at 251.
Seeing the price approach but not surpassing this next high, I refrained from making the trade. Had the price shot through this line, I would’ve considered it, but without that happening, I decided against it. And my caution paid off, as the price indeed did not surpass that high and later dropped.

The Last Experience: The Any Trade
Our scan gave us alerts for only three trades that day and Any was one of them. At an alert of 203, the next high on the daily chart was just over 204, if not a bit less, and another previous high at 216.
Once again, the proximity to the higher line made me wary. I prefer a lot more room for a stock to potentially run before it hits the next high. However, let me be clear:
Just because there is a high looking left doesn’t guarantee that the stock will stall there; it’s merely a pattern that I have observed throughout my time trading.
All in all, the Any trade was also not for me that day.
Conclusion
Even though the ‘abnormal option activity plus a ten-day daily break’ scan is my favorite, I do not always act on every alert it gives. It merely serves to provide me potential cues and ideas for trades. The red line is an excellent indicator to predict whether the stock will likely rise or fall, and it has proven invaluable in my trading decision-making.
I hope this was helpful. Stay tuned for more tips, tricks and insights on efficient trading strategies. Remember, make your trades smart!
Now, I’m headed back to the trading room. Have a fantastic trading day ahead. Happy trading! It’s time for me to sign off, see you tomorrow!
