Making the Most of the VWAP: A Trade Breakdown
Making the Most of the VWAP: A Trade Breakdown
Nov 13, 2023
Hello, everyone! I’m Barrie Einarson from Trade Ideas, and I’m here with another exciting edition of “What Makes this Trade Great”. Today, we’re going to dive into an oft-overlooked but very crucial trading indicator – the VWAP (Volume Weighted Average Price). Feel free to explore my Home Page, where you can acquire Trade Ideas scanners at a discounted price Use Promo Code EARLYBIRD30
Ranked the second most followed indicator by me, it actually holds a substantial amount of analytical information that traders can take advantage of, especially for earnings play. Let’s see how it works by analyzing a recent trade involving Tyson Foods, Inc. (NYSE: TSN).
Setting the Market Stage
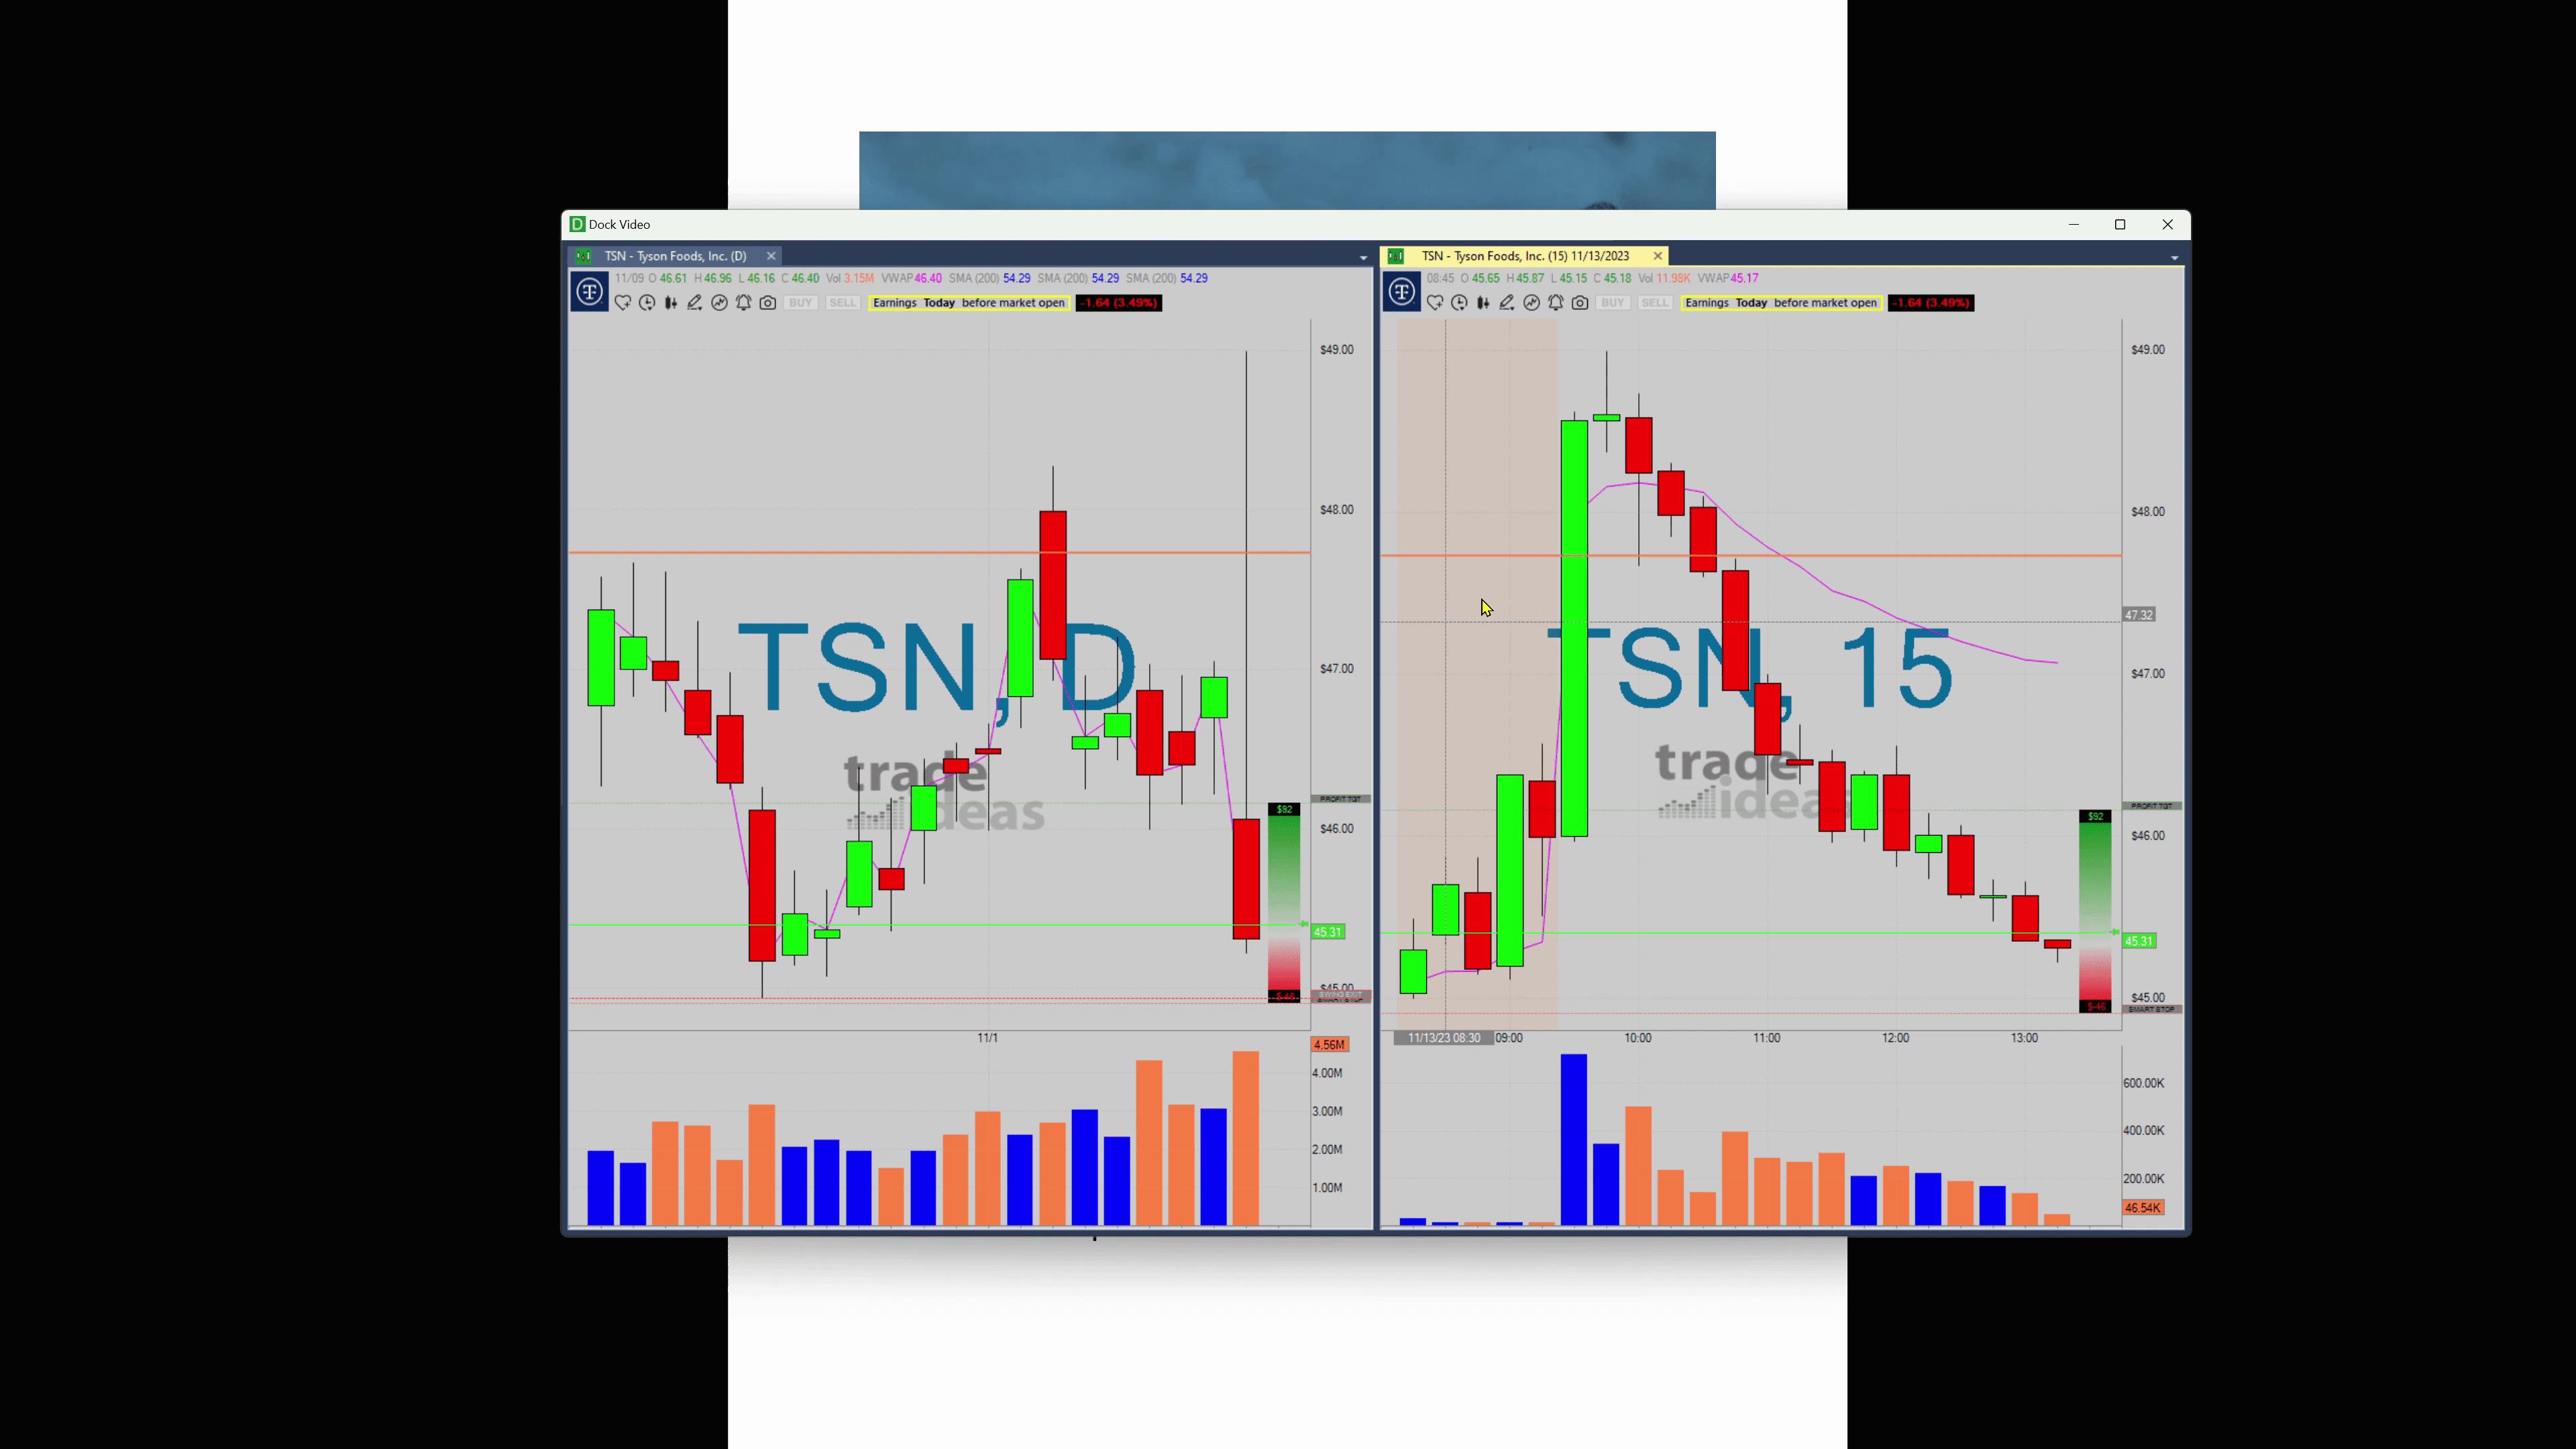
Initially, the pre-market trade indicated a negative opening for the day. Towards the close on Friday, TSN’s stock was going down and opened substantially below the Friday closing rate, near the 43-44 mark. However, as soon as the market opened, we started to see a recovery taking place. TSN’s stock ripped and went significantly above the preceding Friday’s closing rate.

Watching the VWAP Line
At this point, a new player came in – the VWAP. Its horizontal line was drawn at 47.70 and traders were advised to keep an eye on this. Interestingly, something happened in that 15-minute trade candle. The first candle bottom got into the VWAP line, but not at a point which would compel the stock to drop. This effectively signaled that buyers were pushing the stock price higher, keeping it above the VWAP.
This behavior persisted for the second candle as well. However, the story was a little different with the third. It closed below the VWAP, signaling a potential good trade spot.
“The VWAP is a remarkable tool that aids in identifying the spot where a stock is most likely to shift trend. In this case, the shifting point was around the 47.70 mark.”
Keeping the VWAP in mind, you can observe that the stock tries to reach back to the VWAP. And that’s where the magic happens – taking the trade at this key juncture can result in a significant run. This exact situation happened with TSN – the stock ran from approximately 47.63 down to around 40, 518.
Riding the VWAP Wave
This ride is a great example of VWAP breaks. While we did see minor pauses, there were no sizeable green candles that would normally knock the stock out of the run. This demonstrates a key metric of the VWAP – when a stock breaks the VWAP line, it could potentially keep running, and running, and… well, you get the idea!
Wrapping Up
In closing, VWAP is more than just a fancy acronym. It’s a precious tool in the arsenal of a trader. Sure, not all breaks result in a long run. But when they do, much like in our TSN example, the results can be highly rewarding.
So get back in the (trading) room and keep an eye out for the VWAP on your next trade – it could make the difference between a good trade and a great one!
Stay tuned for more trading insights and remember – in the world of trade, information is king. Happy Trading!
