Trading Patterns And Setup Analysis With Trade Ideas: October 26
Trading Patterns And Setup Analysis With Trade Ideas: October 26
Hello, fellow traders! This is Andy here with Trade Ideas, and I’m here to shed some light on what’s been happening in the trading world on this fine day, Thursday, October 26. If you’re wondering what’s been going on, you’ve come to the right place. The configuration we’re looking at right now points towards an unpromising scenario for traders; that’s right, we’re in the midst of a rather unsightly tape pattern.
Don’t let this appalling vista get you down though, because if you flip this chart over, what you’d be looking at would be nothing less than a marvelous bullish setup developing on the upside. Yes, today’s market sessions have seen some ups and downs, even as we register the latest GDP numbers, but quite frankly, the price action is where the real story lies. But remember, right now it’s not about rushing in, it’s about strategizing and taking a step back.
In this purposeful lull, let’s consider a few setups that you may need to pay attention to in your trader’s journey. Time to roll up those sleeves and dive into these charts.
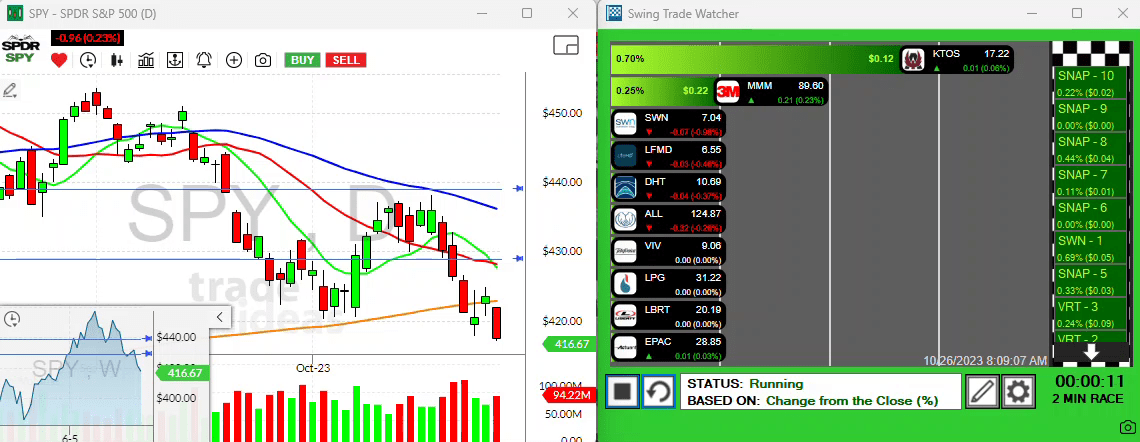
Chart Setup Analysis: SWN, CTRE, EPAC, and Gilead
Let’s start off with SWN (Southwestern Energy Co.).
SWN caught my attention with its recent explosive green bar backed by impressive volumes. After a pullback, it’s maintaining its ten-period moving average and a breakthrough above its four-day high could be noteworthy for SWN.
Moving ahead to CTRE (CareTrust REIT).
This company is an interesting pattern, currently struggling to ascend above its ten-period moving average. However, if it does, you’ll find a neatly developed resistance there, making it a favorable chart to keep tabs on. A movement above the three-day high in CTRE is what we’re aiming for here. So do keep your eyes on that!
Next, let’s take a peek at EPAC (Enerpac Tool Group).
Enerpac recently had earnings. Its chart sports a big explosive move down, highlighted in yellow, not even touching its ten-period moving average. It’s definitely worth keeping under your radar, especially for any movements above its four-day high.
Lastly, we’ll have a look at Gilead Sciences (GILD).
Gilead has been holding its ground rather well, having pulled back to a pivotal support level and currently nudging to regain its ten-period moving average. Breaking that four-day low would indicate a good time to exit; otherwise, it’s a setup to consider keeping in mind.
Remember to keep your trades firm and never overspread yourself. Whether it’s analyzing the dip in the SPY, or the rise in SWN, be prepared for some market uncertainties. We’re keeping things on the calm and quiet side and waiting for the right moments. Hopefully, these chart setups would offer you some insights or spark ideas on your trading strategy. To sum up, keep an eye on these patterns and let’s see what tomorrow brings to the table. Cheers and happy trading!